REVIEW 2 major objections 5 minor 41 references
Tunable active rotational diffusion in swimming droplets
T0 review · 2 major / 5 minor · reviewed 2026-08-14 · deepseek-v4-flash
Pith's one-line read This paper traces swimming-droplet propulsion to the difference in critical micellar concentration between pure water and oil-saturated water, and shows that salt and surfactant independently tune speed and turning.
desk verdict A solid, tunable swimmer paper with a plausible mechanism that the quantitative model does not fully close; deserves review but not without a clear request for gradient-level validation. read the letter →
The pith
A machine-rendered reading of the paper's core claim, the machinery that carries it, and where it could break.
The reading
What carries the argument
The central object is the interfacial monomer-concentration gradient set by ΔCMC, the difference between the critical micellar concentration in pure water and in oil-saturated water. In its simplest form the average gradient along the droplet surface is ∇_||C = ΔCMC/2r, i.e., the CMC difference spread across the droplet diameter. Through the velocity equation this gradient produces a Marangoni (surface-tension-driven) flow, with salt acting on ΔCMC and therefore on speed, and surfactant concentration acting separately on the persistence time. The second piece of machinery is the persistent random walk model, whose mean-square displacement and velocity-correlation formulas extract V and τ from the trajectories. Together, these two elements separate the speed knob from the turning knob.
What would settle it
Measure the local surfactant monomer concentration at the front and back surfaces of a moving droplet directly, for example with fluorescently labelled surfactant, and compare the front-back difference to ΔCMC; the proposed mechanism predicts a gradient of ΔCMC/2r, so a systematically different measured gradient, or swimming at salt concentrations where ΔCMC falls below about 0.5 mM, would falsify the mechanism.
Extended reading notes
Core claim
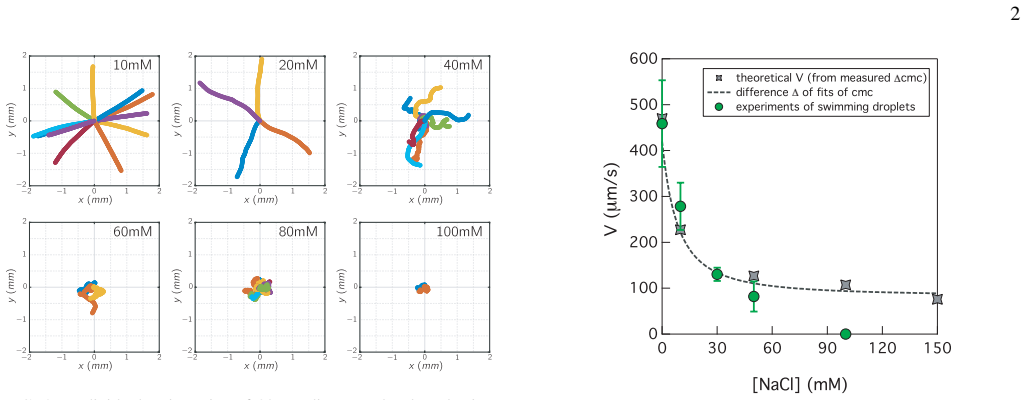
The paper's central claim is that the driving force behind a swimming oil droplet is the difference in critical micellar concentration, ΔCMC, between the surfactant solution in pure water and in the oil-saturated water around the droplet. As the droplet moves, its front faces water that can hold more surfactant monomers before micelles form, while the back faces oil-saturated water with a lower CMC, producing a monomer concentration gradient across the droplet. That gradient, written as ∇_||C = ΔCMC/2r, enters the velocity relation V = r/(2η_o+3η_i) (−∂γ/∂c) ∇_||C and drives a Marangoni flow that sustains propulsion. Salt reduces ΔCMC and therefore reduces the observed speed, from 15 diameters per second down to a stop near ΔCMC ≈ 0.5 mM, while surfactant concentration above the CMC leaves the speed nearly unchanged but cuts the persistence time τ by four orders of magnitude. The trajectories obey a persistent random walk, so single-droplet motility is captured by two independently tunable parameters, V and τ.
Load-bearing premise
The model assumes the surfactant concentration difference between the front and back of a droplet is simply ΔCMC across the diameter, ∇_||C = ΔCMC/2r, without computing how flow and diffusion reshape the concentration field around the moving droplet.
Editorial extensions
If this is right
- Salt provides a continuous speed dial from 3 to 15 droplet diameters per second, with motion ceasing when ΔCMC drops below about 0.5 mM.
- Surfactant concentration above the CMC acts as a turning dial: over one decade of SDS, the persistence time τ falls four orders of magnitude, roughly as [SDS]^{-4}, while the speed stays constant.
- Because V and τ are independent, the effective diffusion constant D_e = V^2 τ can be pushed millions of times beyond thermal rotational diffusion, placing these droplets in the active Brownian particle class at much higher activity.
- The wide, independently tunable activity range makes the system suitable for testing collective predictions such as motility-induced phase separation at high activity.
Reading between the lines
- If the [SDS]^{-4} scaling of τ extends to other droplet radii, measuring τ as a function of radius at fixed surfactant concentration could discriminate between turning set by advective flow chaos and turning set by local micellar fluctuations.
- A natural next experiment is to track tracer particles on the droplet surface during a turn to see whether reorientation begins at the front or the back, a detail the paper leaves open.
- Because salt and surfactant independently control V and τ, mixing droplet populations prepared with different salt and surfactant histories could produce non-equilibrium sorting or effective interactions without changing droplet chemistry.
Signed reviews
Editorial analysis
A structured set of objections, weighed in public.
Referee Report
Summary. The paper reports an experimental study of self-propelled diethyl phthalate (DEP) droplets in aqueous SDS solutions. The authors propose that locomotion is driven by the difference in critical micellar concentration (ΔCMC) between pure water and DEP-saturated water, which generates a monomer concentration gradient and a Marangoni flow along the droplet surface. They measure droplet speeds as a function of NaCl and SDS, and use mean-square-displacement analysis to extract velocity V and persistence time τ. They find V is controlled by salt (through ΔCMC) and is largely independent of surfactant concentration, while τ decreases by four orders of magnitude as SDS concentration increases. The effective diffusion constant is reported to be millions of times larger than thermal values. The paper presents a model (Eq. 1) linking V to ΔCMC with a fitted surface-tension-gradient coefficient, and discusses implications for active matter.
Significance. If the proposed mechanism holds, the work would provide a new, chemically tunable route to control both speed and persistence time of active droplets, and the reported speed range (up to 15d/s) would be a substantial advance. The strengths of the paper include the independent pendant-drop measurements of ΔCMC as a function of salt, the systematic characterization of the MSD with two independent estimates of τ, and the large parameter sweep. The central quantitative link, however, rests on an unmeasured assumption about the surface concentration gradient, and the fitted prefactor absorbs a two-orders-of-magnitude discrepancy with pendant-drop values. The proportionality between V and ΔCMC is informative but does not by itself validate the proposed mechanism.
major comments (2)
- [Eq. (1) and the surrounding velocity-model paragraph] The central quantitative assumption of the paper is the replacement ∇||C = ΔCMC/2r in Eq. (1), but this gradient is not measured and is not derived from the coupled advection-diffusion-Marangoni problem for a moving droplet. Because the coefficient -∂γ/∂c is calibrated from a single measured speed (V≈450 μm/s at ΔCMC=3 mM), the salt-dependence of V in Fig. 3 tests only linear proportionality between V and ΔCMC, not the absolute magnitude of the predicted Marangoni stress. The fitted ∂γ/∂c is two orders of magnitude below the pendant-drop value, and this discrepancy is absorbed into the calibration; the claim that the data 'validate the mechanism' is therefore stronger than the evidence supports. To make the validation convincing, the authors should either measure the surface concentration gradient independently, compute it with a transport model, or explicitly present Eq. (1) as a scaling law with a fitted prefactor and temper the corresponding claims in the abstract.
- [Fig. 3 and the following paragraph (salt dependence)] The observed cessation of swimming for ΔCMC below approximately 0.5 mM is not captured by Eq. (1), which predicts a finite speed in that range. The manuscript interprets this as evidence that motility alone cannot sustain the gradient, but this is also a failure of the model's linear ansatz at low drive. Since the model is used to fit the data in the high-ΔCMC regime, this discrepancy should be discussed as a limitation of the model rather than as a validating feature. A comparison with the instability threshold in the Michelin-et-al. analysis (Ref. [5]) would be instructive.
minor comments (5)
- [Parameter definitions near Eq. (1)] The term 'ηo = 0.89mPa.s is the viscosity of the solute' should read 'viscosity of the continuous phase', and the units of ∂γ/∂c (N/m per M or per mM) should be stated explicitly.
- [Fig. 5b caption] The power-law fit τ = 6×10^6 [SDS]^{-4} is missing units for [SDS] and for the prefactor; please specify that [SDS] is in mM (or M) and give the corresponding dimensions of the prefactor.
- [Fig. 3 caption] The caption states that the dashed line is 'computed from the difference between empirical fits of CMC vs [SDS]' but the horizontal axis of the figure is NaCl concentration; clarify the variable used in the fit.
- [Supplementary figure caption] The caption refers to 'Silicon oil' but should be 'silicone oil' throughout.
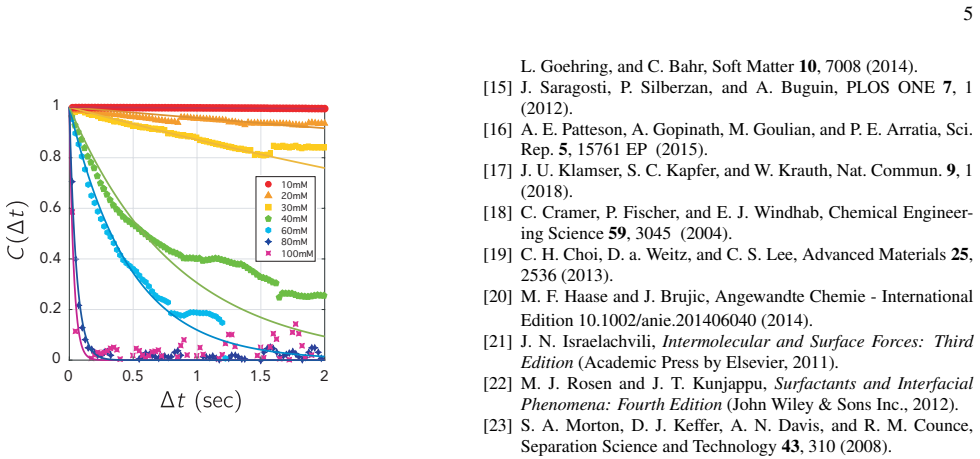
- [Eq. (3) and Fig. 6] Eq. (3) defines the velocity autocorrelation, but the text says the data are fit 'with an exponential decay following equation 3'; clarify that the exponential fit is not Eq. (3) itself, but rather a fit of C(Δt) = exp(-Δt/τ).
Circularity Check
One-parameter calibration of ∂γ/∂c makes the absolute speed a fit, but the salt-dependence test is a meaningful independent proportionality check; no load-bearing self-citation.
-
fitted input called prediction
[Eq. (1), 'More quantitatively' paragraph, and Fig. 3 caption]
"For the experimentally determined speed V∼ 450 µm/s, shown in Fig. 3, we then calculate ∂γ/∂c = 0.01N/m/M. ... Assuming all other terms in Eq. 1 remain the same, the change in ∆CMC accurately predicts the sharp decrease in the average instantaneous speed shown in Fig. 3."
The single prefactor ∂γ/∂c is calibrated from one measured droplet speed in the same dataset, so Eq. (1) is not an ab initio prediction of the absolute speed. With ∇||C defined as ∆CMC/2r, the velocity curve V([NaCl]) is forced through that calibration point and its shape is just the independently measured ∆CMC([NaCl]) multiplied by the fitted constant. The agreement in Fig. 3 therefore tests only the linear proportionality V ∝ ∆CMC, not the absolute magnitude or the physical origin of the gradient. The independent pendant-drop determination of ∆CMC makes this a genuine proportionality test, but the quantitative central claim is partly fitted rather than predicted.
full rationale
The paper's strongest quantitative link is Eq. (1) with ∇||C = ∆CMC/2r. The ∆CMC values themselves are measured independently by pendant-drop experiments, not extracted from droplet speeds, so the salt-dependence comparison has independent content. However, the prefactor ∂γ/∂c is calibrated from a single measured speed in the same dataset, and the paper then describes the resulting salt-dependent curve as 'accurately predict[ing]' the speed decrease; thus the absolute speed is fitted, and only the scaling with independently measured ∆CMC is genuinely predicted. This is a partial calibration issue, not a full construction-level circularity. The paper's appeal to Michelin's external numerical prediction to justify the factor-of-100 discrepancy is not a self-citation, and the turning-time analysis (Eq. 2 and the heuristic τ power law) is explicitly a fit and is not used to prove the propulsion mechanism. No load-bearing self-citation chain is present: the cited prior work by the authors is for microfluidic fabrication and general background, not for the central claim. Overall, the mechanism is plausible and the salt trend is meaningful, but the quantitative prediction is one-parameter-normalized, warranting a mild circularity score rather than a clean zero.
Assumptions & free parameters
free parameters (3)
- ∂γ/∂c (effective surface tension gradient coefficient) =
0.01 N/m/M
- Power-law prefactor for τ =
6×10^6 (with [SDS] in mM)
- Power-law exponent for τ =
-4
assumptions (4)
- domain assumption Marangoni stress drives droplet velocity according to Eq. 1 (V = r/(2ηo+3ηi) (-∂γ/∂c) ∇||C)
- ad hoc to paper The average surface concentration gradient is ∇||C = ΔCMC/2r
- domain assumption ∂γ/∂c below the CMC is independent of salt concentration
- domain assumption Active Brownian particle model (persistent random walk) applies to droplet trajectories
Cite this review
Pith. "Pith review of Tunable active rotational diffusion in swimming droplets." pith.science (2026). https://pith.science/paper/Q2EVRTN7
@misc{pith2026190800581,
  author       = {Pith},
  title        = {Pith review of: Tunable active rotational diffusion in swimming droplets},
  year         = {2026},
  howpublished = {\url{https://pith.science/paper/Q2EVRTN7}},
  note         = {Machine review of arXiv:1908.00581}
}
abstract
Here we characterize the motility of athermal swimming droplets within the framework of active rotational diffusion. Just like active colloids, their trajectories can be modeled with a constant velocity $V$ and a slow angular diffusion, but the random changes in direction are not thermally driven. Instead, $V$ is determined by the interfacial tension gradient along the droplet surface, while local micellar fluctuations lead to droplet reorientation with a persistence time $\tau$. We show that the origin of locomotion is the difference in the critical micellar concentration $\Delta$CMC in the front and the back of the droplet. Tuning this parameter by salt controls $V$ from $3-15$ diameters $d/s$. Surfactant concentration has little effect on speed, but leads to a dramatic decrease in $\tau$ over four orders of magnitude. The corresponding range of the effective diffusion constant $D_e$ extends beyond the realm of synthetic or living swimmers, in which $V$ is limited by fuel consumption and $\tau$ is set by temperature or biological activity, respectively. Our tunable swimmers are ideal candidates for the study of the departure from equilibrium to high levels of activity, on both the single particle level and their collective behavior, including the motility-induced phase separation (MIPS).
Figures


Figures from the paper (4 more)


Reference graph
Works this paper leans on
-
[5]
S. Michelin, E. Lauga, and D. Bartolo, Physics of Fluids 25, 061701 (2013)
work page 2013
-
[1]
J. R. Howse, R. a. L. Jones, A. J. Ryan, T. Gough, R. Vafabakhsh, and R. Golestanian, Phys. Rev. Lett. 99, 8 (2007). 5 0 0 0.5 1 1.5 2 1 0.8 0.6 0.4 0.2 10mM 20mM 30mM 40mM 60mM 80mM 100mM FIG. 6. Normalized auto-correlation of the velocity for each con- centration. Each dataset is computed from averaging the C(∆t) of experimental trajectories at a given ...
work page 2007
-
[2]
A. P. Solon, M. E. Cates, and J. Tailleur, Eur. Phys. J. ST 224, 1231 (2015)
work page 2015
-
[3]
M. E. Cates and J. Tailleur, Europhys. Lett. 101, 20010 (2013)
2013
-
[4]
C. A. Weber, D. Zwicker, F. Jülicher, and C. F. Lee, Rep. Prog. Phys. 82, 064601 (2019)
work page 2019
-
[6]
P. G. Moerman, H. W. Moyses, E. B. Van Der Wee, D. G. Grier, A. Van Blaaderen, W. K. Kegel, J. Groenewold, and J. Brujic, Phys. Rev. E 96, 032607 (2017)
work page 2017
-
[7]
K. Peddireddy, P. Kumar, S. Thutupalli, S. Herminghaus, and C. Bahr, Langmuir 28, 12426 (2012)
work page 2012
- [8]
Show all 41 references
-
[9]
N. Ueno, T. Banno, A. Asami, Y . Kazayama, Y . Morimoto, T. Osaki, S. Takeuchi, H. Kitahata, and T. Toyota, Langmuir 33, 5393 (2017)
2017
-
[10]
M. Suga, S. Suda, M. Ichikawa, and Y . Kimura, Phys. Rev. E 97, 1 (2018)
2018
-
[11]
Thutupalli, R
S. Thutupalli, R. Seemann, and S. Herminghaus, New Journal of Physics 13, 073021 (2011)
2011
-
[12]
Z. Izri, M. N. Van Der Linden, S. Michelin, and O. Dauchot, Phys. Rev. Lett. 113, 1 (2014)
2014
-
[13]
C. Jin, C. Krüger, and C. C. Maass, Proc. Natl. Acad. Sci. U.S.A. 114, 5089 (2017)
2017
-
[14]
Herminghaus, C
S. Herminghaus, C. C. Maass, C. Krüger, S. Thutupalli, L. Goehring, and C. Bahr, Soft Matter 10, 7008 (2014)
2014
-
[15]
Saragosti, P
J. Saragosti, P. Silberzan, and A. Buguin, PLOS ONE 7, 1 (2012)
2012
-
[16]
A. E. Patteson, A. Gopinath, M. Goulian, and P. E. Arratia, Sci. Rep. 5, 15761 EP (2015)
2015
-
[17]
J. U. Klamser, S. C. Kapfer, and W. Krauth, Nat. Commun. 9, 1 (2018)
2018
-
[18]
Cramer, P
C. Cramer, P. Fischer, and E. J. Windhab, Chemical Engineer- ing Science 59, 3045 (2004)
2004
-
[19]
C. H. Choi, D. a. Weitz, and C. S. Lee, Advanced Materials 25, 2536 (2013)
2013
-
[20]
M. F. Haase and J. Brujic, Angewandte Chemie - International Edition 10.1002/anie.201406040 (2014)
2014 doi
-
[21]
J. N. Israelachvili, Intermolecular and Surface F orces: Third Edition (Academic Press by Elsevier, 2011)
2011
-
[22]
M. J. Rosen and J. T. Kunjappu, Surfactants and Interfacial Phenomena: F ourth Edition(John Wiley & Sons Inc., 2012)
2012
-
[23]
S. A. Morton, D. J. Keffer, A. N. Davis, and R. M. Counce, Separation Science and Technology 43, 310 (2008)
2008
-
[24]
Anderson, Ann
J. Anderson, Ann. Rev. Fluid Mech. 21, 61 (1989)
1989
-
[25]
See Supplementary Material
-
[26]
Hayashi and S
S. Hayashi and S. Ikeda, J. Phys. Chem. 84, 744 (1980)
1980
-
[27]
Duplâtre, M
G. Duplâtre, M. F. Ferreira Marques, and M. da Graça Miguel, J. Phys. Chem. 100, 16608 (1996)
1996
-
[28]
Principles, Emulsion Science , Springer Tracts in Modern Physics, V ol
B. Principles, Emulsion Science , Springer Tracts in Modern Physics, V ol. 181 (Springer Berlin Heidelberg, Berlin, Heidel- berg, 2002)
2002
-
[29]
von Szyszkowski, Zeitschrift für Physikalische Chemie 64, 385 (1908)
B. von Szyszkowski, Zeitschrift für Physikalische Chemie 64, 385 (1908)
1908
-
[30]
Fily and M
Y . Fily and M. C. Marchetti, Phys. Rev. Lett.108, 1 (2012)
2012
-
[31]
Burov, S
S. Burov, S. M. A. Tabei, T. Huynh, M. P. Murrell, L. H. Philip- son, S. a. Rice, M. L. Gardel, N. F. Scherer, and A. R. Dinner, Proc. Natl. Acad. Sci. U.S.A. 110, 19689 (2013)
2013
-
[32]
Palacci, S
J. Palacci, S. Sacanna, A. P. Steinberg, D. J. Pine, and P. M. Chaikin, Science 579 (2012)
2012
-
[33]
Schmitt and H
M. Schmitt and H. Stark, Physics of Fluids 28, 012106 (2016)
2016
-
[34]
Morozov and S
M. Morozov and S. Michelin, J. Chem. Phys. 150, 044110 (2019)
2019
-
[35]
Chamolly, Alexander and Lauga, Eric, Eur. Phys. J. E 42, 88 (2019)
2019
-
[36]
Gonnella, D
G. Gonnella, D. Marenduzzo, A. Suma, and A. Tiribocchi, C. R. Physique 16, 316 (2015)
2015
-
[37]
Fodor, C
E. Fodor, C. Nardini, M. E. Cates, J. Tailleur, P. Visco, and F. van Wijland, Phys. Rev. Lett.117, 038103 (2016)
2016
-
[38]
Stark, Acc
H. Stark, Acc. Chem. Research 51, 2681 (2018)
2018
-
[39]
Thutupalli, D
S. Thutupalli, D. Geyer, R. Singh, R. Adhikari, and H. A. Stone, Proc. Natl. Acad. Sci. U.S.A. , 201718807 (2018)
2018
-
[40]
McMullen, M
A. McMullen, M. Holmes-Cerfon, F. Sciortino, A. Y . Grosberg, and J. Brujic, Phys. Rev. Lett. 121, 138002 (2018)
2018
-
[41]
Zeravcic, V
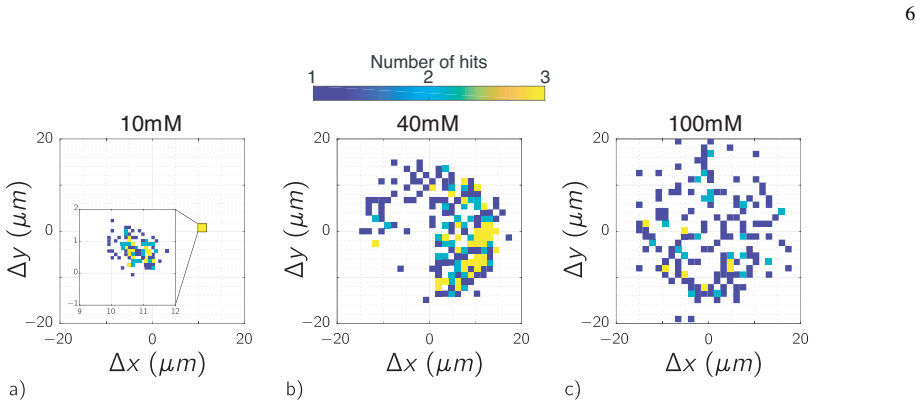
Z. Zeravcic, V . N. Manoharan, and M. P. Brenner, Rev. Mod. Phys. 89, 1 (2017). 6 10mM 40mM 100mM 31 Number of hits 2 FIG. 7. Displacements of the droplet between consecutive time-steps ( i.e. ∆t = 25ms), for three surfactant concentrations. Colors represent the density at whi...
2017 arXiv
Reviewed August 14, 2026 · model on record in the stance chip above.
Discussion (0). Continue with ORCID to comment.