REVIEW 3 major objections 5 minor 36 references
Explaining Image Classifiers using Statistical Fault Localization
T0 review · 3 major / 5 minor · reviewed 2026-08-14 · deepseek-v4-flash
Pith's one-line read The paper claims that statistical fault localization, a debugging technique from software engineering, produces image-classifier explanations that are consistently better than those of five state-of-the-art methods.
desk verdict A genuine new application of SFL to DNN explanation, weakened by missing error bars and an unvalidated ground-truth benchmark; worth reviewing but not yet definitive. read the letter →
The pith
A machine-rendered reading of the paper's core claim, the machinery that carries it, and where it could break.
The reading
What carries the argument
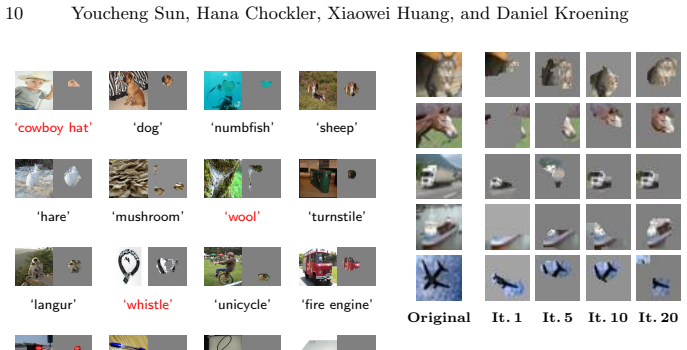
The mechanism that carries the argument is the per-pixel SFL spectrum $\langle a_{ep}, a_{ef}, a_{np}, a_{nf}\rangle$, where $e/n$ records whether a pixel is present or masked in a mutant and $p/f$ records whether the mutant keeps or changes the original label. Four standard measures—Ochiai, Tarantula, Zoltar, and Wong-II—turn these counts into a suspiciousness score, and Algorithm 2 adaptively tunes the masking fraction $\sigma$ so the mutant suite stays balanced between passing and failing cases. This ranking feeds a greedy loop that adds pixels in descending suspiciousness until the DNN outputs the original label, and that set is returned as the explanation. Because the loop stops at the first sufficient set, the result is an approximation of a minimal explanation rather than an exact one; exact computation is DP-complete, i.e. intractable.
What would settle it
Take a Chimera image, mask exactly the embedded red-panda patch by setting all other pixels to the background color, and check whether the network still outputs "red panda"; if it does not, the patch is not sufficient, and the ground-truth assumption behind the 76.7% IoU comparison fails.
Extended reading notes
Core claim
The paper's central claim is that SFL measures transfer from program statements to input pixels without modification. For a fixed image classified as $y$, DeepCover constructs many masked mutants and records, for each pixel, how often it is present or absent in mutants that keep $y$ ("passing") and mutants that leave $y$ ("failing"). Applying measures such as Ochiai, Tarantula, Zoltar, and Wong-II turns these four counts into a suspiciousness score per pixel. Sorting by that score and greedily adding pixels until the masked image is again classified as $y$ produces an approximation of a minimal sufficient explanation. The paper reports that this explanation is better than the five comparison methods on every evaluation axis, with the Chimera benchmark giving DeepCover 76.7% accuracy at IoU ≥ 0.5, 6 percentage points above the second-best method, Extremal.
Load-bearing premise
The Chimera benchmark assumes that the superimposed red-panda patch is the exact ground truth: every pixel inside the patch is explanatory and every pixel outside it is not, so any explanation overlapping the patch is counted correct and any overlap outside is counted wrong.
Editorial extensions
If this is right
- Because DeepCover only needs the network's output labels on masked images, it works for any classifier that can be queried as a black box, without gradients or internal activations.
- Explanations for ImageNet-scale images can be produced in time linear in the number of mutants and pixels, making the approach practical on a laptop.
- The same ranking can serve as a deletion test: masking only 2% of the highest-ranked pixels changes classification in 60% of images, far fewer pixels than the second-best method requires.
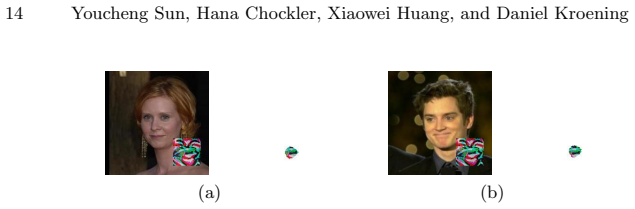
- On the Trojan-trigger dataset, the top 8% of DeepCover-ranked pixels localize 80% of the planted triggers with IoU ≥ 0.5, suggesting the method can support security auditing of deployed models.
- Because the explanation tracks model parameters during training, DeepCover satisfies the sanity requirement that explanations should change when the model changes, and it can reveal cases where a correct label is reached for the wrong reason.
Reading between the lines
- The paper's explanation metric rewards smallness and sufficiency, but a direct human study could test whether DeepCover's minimal explanations are more or less trusted than redundant ones; the authors cite evidence that people sometimes prefer redundancy.
- The Chimera ground-truth assumption could be stress-tested by constructing synthetic images where the planted object is necessary but not sufficient for the label; if the network then relies on context, IoU against the patch would systematically understate or overstate quality.
- Because the mutant generator treats any pixel mutation as a program statement, the same pipeline should transfer to text and tabular data by replacing pixel masking with token or feature masking, giving a domain-generic black-box explainer.
- A natural algorithmic next step is to use multiple SFL measures together or to select a measure per image, since the paper evaluates four fixed formulas but notes that hundreds exist.
Signed reviews
Editorial analysis
A structured set of objections, weighed in public.
Referee Report
Summary. The paper proposes DeepCover, a black-box method for explaining image classifier decisions, built on statistical fault localization (SFL) from software engineering. It defines an explanation as a minimal subset of pixels sufficient for the same classification, generates a test suite of randomly mutated images, ranks pixels by four SFL measures (Ochiai, Tarantula, Zoltar, Wong-II), and greedily grows a sufficient pixel set. The method is evaluated against GradCAM, LIME, SHAP, RISE, and Extremal using explanation size, deletion-based sensitivity, weakly supervised object localization, a synthetic Chimera benchmark with known ground truth, and Trojan trigger localization. The headline claim is that DeepCover achieves 76.7% accuracy on the Chimera benchmark, 6% better than the second-best method.
Significance. The paper is a novel and potentially impactful cross-pollination of statistical fault localization and explainable AI. DeepCover is black-box, linear-time in the image and test-suite size, and the authors provide an open-source implementation. The construction of a synthetic Chimera benchmark with known ground truth and the successful localization of Trojan triggers are valuable contributions that go beyond pixel-ranking comparisons. If the empirical claims hold, the method offers a competitive and efficient alternative to existing explanation tools. The main weaknesses are lack of statistical rigor in the evaluation and an unvalidated ground-truth assumption in the Chimera benchmark, both of which are fixable.
major comments (3)
- [Section 6.4, Table 1] The Chimera benchmark assumes that the embedded 'red panda' patch is the exact ground truth explanation. Under the paper's own Definition 1, this requires that the patch alone (with all other pixels set to background) is sufficient for the red-panda classification, and that no pixels outside the patch contribute to the classification. The paper only verifies that the composed image retains the red-panda label with MobileNet and VGG16. If the network uses background cues from the host image, DeepCover's top-ranked pixels outside the patch are legitimate explanations and the IoU metric unfairly penalizes them; conversely, if the patch contains irrelevant pixels, the metric rewards including them. This assumption is load-bearing for the headline 76.7% vs. 70.7% result, so the authors should test the patch's sufficiency and analyze whether top-ranked pixels outside the patch are truly non-explanatory.
- [Section 6.3, Figures 3-5, Table 1] The empirical evaluation reports no confidence intervals, significance tests, or variance across repeated runs. This matters because Algorithm 2 is randomized (the initial σ is sampled, and pixel masks are random), and the parameters σ=1/5, ε=1/6, and m=2000 are chosen empirically with no held-out validation, as acknowledged in Section 6.6. The reported advantages of DeepCover over the second-best methods in Figures 3-5 and Table 1 could therefore be within noise. Please provide repeated-run statistics (e.g., means and standard deviations over several independent runs with different random seeds) and a significance test, or otherwise demonstrate that the differences are stable.
- [Section 5.2 and Figure 3] Algorithm 1 constructs an explanation by adding pixels until the classification matches, but the paper acknowledges that the result is not necessarily minimal under Definition 1. This non-minimality is not quantified, yet Figure 3 compares the sizes of DeepCover's explanations with those of other methods. The comparison therefore conflates the quality of the ranking with the greedy construction rule: a different stopping criterion (e.g., attempting to remove redundant pixels after the greedy phase) could change the reported sizes. Please report the amount of redundancy in P_exp (for example, the fraction of pixels that can be removed while preserving the classification) and discuss how this affects the size-based comparison.
minor comments (5)
- [Throughout] Tool names should be capitalized consistently (e.g., 'GradCAM', 'LIME', 'SHAP', 'RISE', 'Extremal'), including in the Abstract and captions.
- [Section 6.1, Figure 6] The test-suite size is denoted m in Algorithm 2 and Section 6.1, but Figure 6 labels it 'n'. Please unify the notation.
- [Section 6.4, Table 1 caption] The text says 'intersection of union'; the standard term is 'intersection over union' (IoU). Please correct.
- [Algorithm 2] Line 2 says 'σ← sample in the range (0, 1)' but does not specify the distribution. Please state whether the sample is uniform and how the random seed is handled.
- [Equation (2c)] The Zoltar formula as typeset is ambiguous in the denominator. Add explicit parentheses to clarify the precedence of the terms.
Circularity Check
No significant circularity: DeepCover's SFL ranking and explanation construction are self-contained, and the Chimera and Trojan benchmarks provide external, independently planted ground truths.
full rationale
The paper's derivation chain is self-contained and does not reduce to its own inputs. DeepCover defines an explanation as a minimal subset of pixels sufficient for the same classification (Definition 1), ranks pixels using standard external SFL formulas (Ochiai, Tarantula, Zoltar, Wong-II in Eq. 2), and constructs an explanation by adding top-ranked pixels until the DNN returns the original label (Algorithm 1). Sufficiency is enforced by the stopping condition, and minimality is only approximated, as the paper explicitly acknowledges in Section 5.2. The evaluation compares against external tools using independent metrics: explanation size, addition/deletion curves, weakly supervised object localization IoU, the Chimera benchmark with a red panda patch planted by the authors, and the Trojan trigger from prior external work [17]. The Chimera ground truth rests on an assumption that the embedded patch is the true explanation, but this is an unverified empirical assumption about the benchmark, not a circular reduction: the patch is constructed independently of DeepCover's ranking, and the IoU comparison is computed against that externally planted region. The self-citations in the paper ([13], [15], [16]) support background claims about SFL measures and single-bug optimality; they are not used to justify DeepCover's central output or to forbid alternatives. No equation or fitted parameter is renamed as a prediction, and no load-bearing claim is justified solely by a self-citation chain. Accordingly, the paper merits a circularity score of 0.
Assumptions & free parameters
free parameters (3)
- sigma (initial mask fraction) =
1/5
- epsilon (mask fraction step) =
1/6
- m (test suite size) =
2000
assumptions (4)
- domain assumption The DNN can be treated as a black box accessible only through input-output queries.
- ad hoc to paper The greedy addition of pixels in descending SFL rank order approximates a minimal sufficient explanation.
- ad hoc to paper Balancing passing and failing mutants in the test suite yields informative SFL spectra.
- ad hoc to paper The Chimera patch annotations are exact ground truth for explanations.
Cite this review
Pith. "Pith review of Explaining Image Classifiers using Statistical Fault Localization." pith.science (2026). https://pith.science/paper/Q2WJOCTG
@misc{pith2026190802374,
  author       = {Pith},
  title        = {Pith review of: Explaining Image Classifiers using Statistical Fault Localization},
  year         = {2026},
  howpublished = {\url{https://pith.science/paper/Q2WJOCTG}},
  note         = {Machine review of arXiv:1908.02374}
}
read the original abstract
The black-box nature of deep neural networks (DNNs) makes it impossible to understand why a particular output is produced, creating demand for "Explainable AI". In this paper, we show that statistical fault localization (SFL) techniques from software engineering deliver high quality explanations of the outputs of DNNs, where we define an explanation as a minimal subset of features sufficient for making the same decision as for the original input. We present an algorithm and a tool called DeepCover, which synthesizes a ranking of the features of the inputs using SFL and constructs explanations for the decisions of the DNN based on this ranking. We compare explanations produced by DeepCover with those of the state-of-the-art tools GradCAM, LIME, SHAP, RISE and Extremal and show that explanations generated by DeepCover are consistently better across a broad set of experiments. On a benchmark set with known ground truth, DeepCover achieves 76.7% accuracy, which is 6% better than the second best Extremal.
Figures


Figures from the paper (2 more)

Reference graph
Works this paper leans on
-
[1]
In: Advances in Neural Information Processing Systems
Adebayo, J., Gilmer, J., Muelly, M., Goodfellow, I., Hardt, M., Kim, B.: Sanity checks for saliency maps. In: Advances in Neural Information Processing Systems. pp. 9505–9515 (2018)
2018
-
[2]
In: Uncertainty in Artificial Intelligence (UAI)
Chajewska, U., Halpern, J.Y.: Defining explanation in probabilistic systems. In: Uncertainty in Artificial Intelligence (UAI). pp. 62–71. Morgan Kaufmann (1997)
work page 1997
-
[3]
In: International Conference on Machine Learning (ICML)
Chen, J., Song, L., Wainwright, M., Jordan, M.: Learning to explain: An information- theoretic perspective on model interpretation. In: International Conference on Machine Learning (ICML). vol. 80, pp. 882–891. PMLR (2018)
work page 2018
-
[4]
In: Security and Privacy (S&P)
Datta, A., Sen, S., Zick, Y.: Algorithmic transparency via quantitative input influence: Theory and experiments with learning systems. In: Security and Privacy (S&P). pp. 598–617. IEEE (2016)
work page 2016
-
[5]
Eiter, T., Lukasiewicz, T.: Complexity results for explanations in the structural- model approach. Artif. Intell. 154(1-2), 145–198 (2004)
work page 2004
-
[6]
In: International Conference on Computer Vision (ICCV)
Fong, R., Patrick, M., Vedaldi, A.: Understanding deep networks via extremal perturbations and smooth masks. In: International Conference on Computer Vision (ICCV). pp. 2950–2958. IEEE (2019)
work page 2019
- [7]
-
[8]
Gonzalez-Sanchez, A.: Automatic error detection techniques based on dynamic invariants. M.S. Thesis, Delft University of Technology, The Netherlands (2007)
work page 2007
Show all 36 references
-
[9]
https://www.darpa.mil/program/explainable-artificial-intelligence (2017), Defense Advanced Research Projects Agency
Gunning, D.: Explainable artificial intelligence (XAI) – program information. https://www.darpa.mil/program/explainable-artificial-intelligence (2017), Defense Advanced Research Projects Agency
2017
-
[10]
Part I: Causes
Halpern, J.Y., Pearl, J.: Causes and explanations: a structural-model approach. Part I: Causes. British Journal for the Philosophy of Science 56(4) (2005)
2005
-
[11]
Part II: Explanations
Halpern, J.Y., Pearl, J.: Causes and explanations: a structural-model approach. Part II: Explanations. British Journal for the Philosophy of Science 56(4) (2005)
2005
-
[12]
Free Press (1965)
Hempel, C.G.: Aspects of Scientific Explanation. Free Press (1965)
1965
-
[13]
Computer Science Review 37, 100270 (2020)
Huang, X., Kroening, D., Ruan, W., Sharp, J., Sun, Y., Thamo, E., Wu, M., Yi, X.: A survey of safety and trustworthiness of deep neural networks: Verification, testing, adversarial attack and defence, and interpretability. Computer Science Review 37, 100270 (2020)
2020
-
[14]
In: Proceedings of ASE
Jones, J.A., Harrold, M.J.: Empirical evaluation of the Tarantula automatic fault- localization technique. In: Proceedings of ASE. pp. 273–282. ACM (2005)
2005
-
[15]
In: Fundamental Approaches to Software Engineering (FASE)
Landsberg, D., Chockler, H., Kroening, D., Lewis, M.: Evaluation of measures for statistical fault localisation and an optimising scheme. In: Fundamental Approaches to Software Engineering (FASE). LNCS, vol. 9033, pp. 115–129. Springer (2015)
2015
-
[16]
In: Fundamental Approaches to Software Engineering (FASE)
Landsberg, D., Sun, Y., Kroening, D.: Optimising spectrum based fault localisation for single fault programs using specifications. In: Fundamental Approaches to Software Engineering (FASE). LNCS, vol. 10802, pp. 246–263. Springer (2018)
2018
-
[17]
In: Network and Distributed System Security Symposium (NDSS)
Liu, Y., Ma, S., Aafer, Y., Lee, W., Zhai, J., Wang, W., Zhang, X.: Trojaning attack on neural networks. In: Network and Distributed System Security Symposium (NDSS). The Internet Society (2018)
2018
-
[18]
In: Advances in Neural Information Processing Systems
Lundberg, S.M., Lee, S.I.: A unified approach to interpreting model predictions. In: Advances in Neural Information Processing Systems. pp. 4765–4774 (2017)
2017
-
[19]
ACM TOSEM 20(3), 11 (2011)
Naish, L., Lee, H.J., Ramamohanarao, K.: A model for spectra-based software diagnosis. ACM TOSEM 20(3), 11 (2011)
2011
-
[20]
In: Proceedings of the International Conference on Software Engineering (ICSE) (2020) 16 Youcheng Sun, Hana Chockler, Xiaowei Huang, and Daniel Kroening
Noller, Y., P˘ as˘ areanu, C.S., B¨ ohme, M., Sun, Y., Nguyen, H.L., Grunske, L.: HyDiff: Hybrid differential software analysis. In: Proceedings of the International Conference on Software Engineering (ICSE) (2020) 16 Youcheng Sun, Hana Chockler, Xiaowei Huang, and Daniel Kroening
2020
-
[21]
Bulletin of Japanese Society of Scientific Fisheries 22, 526– 530 (1957)
Ochiai, A.: Zoogeographic studies on the soleoid fishes found in Japan and its neighbouring regions. Bulletin of Japanese Society of Scientific Fisheries 22, 526– 530 (1957)
1957
-
[22]
In: International Conference on Machine Learning
Odena, A., Olsson, C., Andersen, D., Goodfellow, I.: Tensorfuzz: Debugging neural networks with coverage-guided fuzzing. In: International Conference on Machine Learning. pp. 4901–4911 (2019)
2019
-
[23]
Distill (2018)
Olah, C., Satyanarayan, A., Johnson, I., Carter, S., Schubert, L., Ye, K., Mordvint- sev, A.: The building blocks of interpretability. Distill (2018)
2018
-
[24]
Morgan Kaufmann (1988)
Pearl, J.: Probabilistic Reasoning in Intelligent Systems. Morgan Kaufmann (1988)
1988
-
[25]
In: British Machine Vision Conference (BMVC)
Petsiuk, V., Das, A., Saenko, K.: RISE: randomized input sampling for explanation of black-box models. In: British Machine Vision Conference (BMVC). BMVA Press (2018)
2018
-
[26]
Nature 568(7753), 477 (2019)
Rahwan, I., Cebrian, M., Obradovich, N., Bongard, J., Bonnefon, J.F., Breazeal, C., Crandall, J.W., Christakis, N.A., Couzin, I.D., Jackson, M.O., et al.: Machine behaviour. Nature 568(7753), 477 (2019)
2019
-
[27]
Why should I trust you?
Ribeiro, M.T., Singh, S., Guestrin, C.: “Why should I trust you?” Explaining the predictions of any classifier. In: Knowledge Discovery and Data Mining (KDD). pp. 1135–1144. ACM (2016)
2016
-
[28]
University of Minnesota Press (1989)
Salmon, W.C.: Four Decades of Scientific Explanation. University of Minnesota Press (1989)
1989
-
[29]
In: International Conference on Computer Vision (ICCV)
Selvaraju, R.R., Cogswell, M., Das, A., Vedantam, R., Parikh, D., Batra, D.: Grad- CAM: Visual explanations from deep networks via gradient-based localization. In: International Conference on Computer Vision (ICCV). pp. 618–626. IEEE (2017)
2017
-
[30]
In: International Conference on Machine Learning (ICML)
Shrikumar, A., Greenside, P., Kundaje, A.: Learning important features through propagating activation differences. In: International Conference on Machine Learning (ICML). vol. 70, pp. 3145–3153. PMLR (2017)
2017
-
[31]
In: Proceedings of the 33rd ACM/IEEE International Conference on Automated Software Engineering, ASE
Sun, Y., Wu, M., Ruan, W., Huang, X., Kwiatkowska, M., Kroening, D.: Con- colic testing for deep neural networks. In: Proceedings of the 33rd ACM/IEEE International Conference on Automated Software Engineering, ASE. pp. 109–119 (2018)
2018
-
[32]
In: International Conference on Robotics and Automation (ICRA)
Sun, Y., Zhou, Y., Maskell, S., Sharp, J., Huang, X.: Reliability validation of learning enabled vehicle tracking. In: International Conference on Robotics and Automation (ICRA). IEEE (2020)
2020
-
[33]
IEEE TSE 42(8), 707–740 (2016)
Wong, W.E., Gao, R., Li, Y., Abreu, R., Wotawa, F.: A survey on software fault localization. IEEE TSE 42(8), 707–740 (2016)
2016
-
[34]
In: Computer Software and Applications Conference (COMPSAC)
Wong, W.E., Qi, Y., Zhao, L., Cai, K.: Effective fault localization using code coverage. In: Computer Software and Applications Conference (COMPSAC). pp. 449–456 (2007)
2007
-
[35]
Psychonomic Bulletin & Review 24(5), 1488–1500 (2017)
Zemla, J.C., Sloman, S., Bechlivanidis, C., Lagnado, D.A.: Evaluating everyday explanations. Psychonomic Bulletin & Review 24(5), 1488–1500 (2017)
2017
-
[36]
The Verge (2016), https://www.theverge.com/2016/2/29/11134344/ google-self-driving-car-crash-report
Ziegler, C.: A Google self-driving car caused a crash for the first time. The Verge (2016), https://www.theverge.com/2016/2/29/11134344/ google-self-driving-car-crash-report
2016
Reviewed August 14, 2026 · model on record in the stance chip above.
Discussion (0). Continue with ORCID to comment.