GTLS: A GPU-accelerated method for periodic transit detection
Pith reviewed 2026-07-02 00:33 UTC · model grok-4.3
The pith
A GPU implementation of Transit Least Squares reduces search time for periodic transits by more than twenty times while keeping detection rates statistically identical to the CPU version.
A machine-rendered reading of the paper's core claim, the machinery that carries it, and where it could break.
Core claim
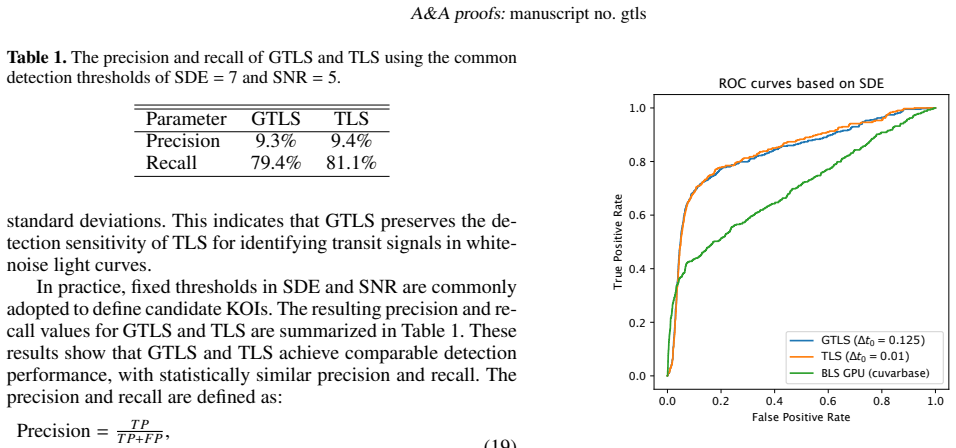
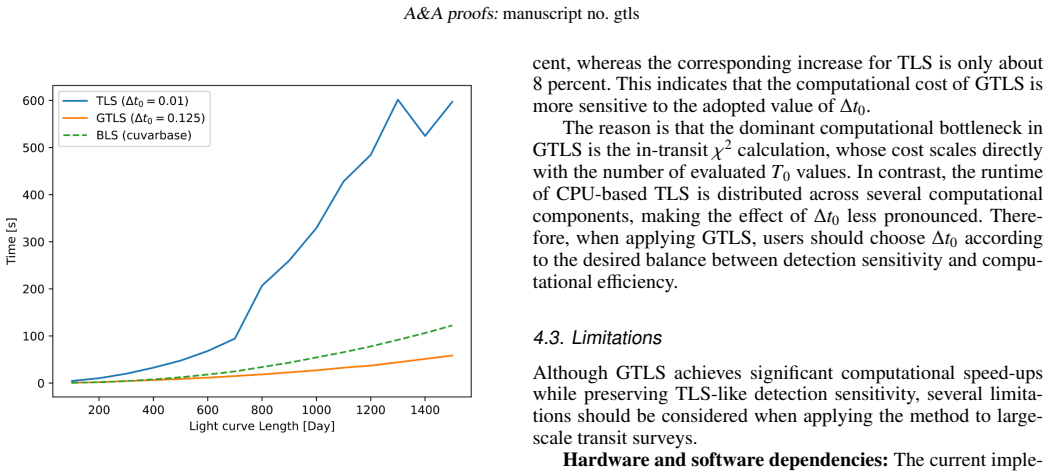
GTLS parallelizes the dominant TLS operations on GPUs and delivers a 3000-day light-curve search in 138 seconds on a single RTX 4090, with precision 9.3 percent and recall 79.4 percent that match the CPU TLS values of 9.4 percent and 81.1 percent to within statistical noise.
What carries the argument
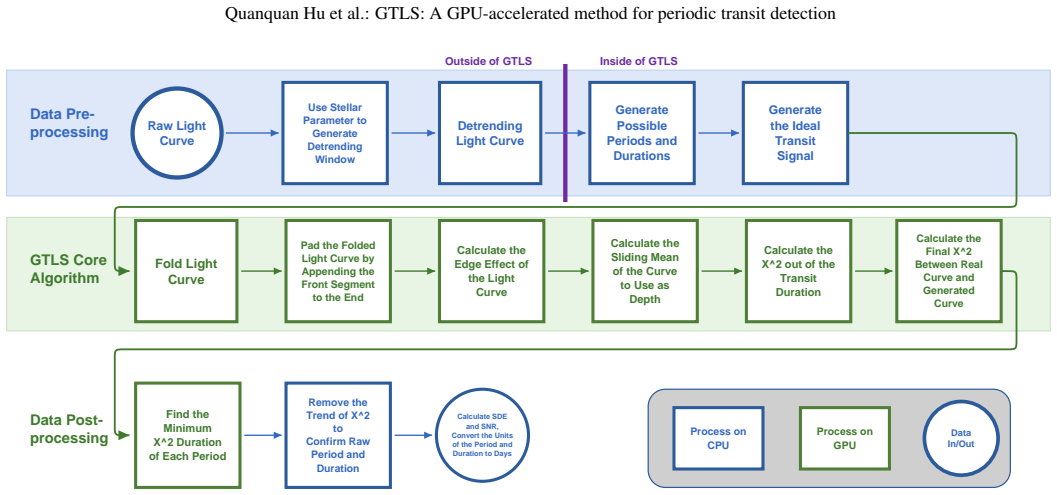
Parallel GPU kernels that perform phase folding, moving-window depth estimation, and chi-squared evaluation to replicate the TLS search exactly.
If this is right
- TLS-style searches become practical for the full data volumes expected from TESS, PLATO, and future missions.
- Two-GPU runs cut the same 3000-day search to roughly 79 seconds.
- Detection statistics remain consistent enough that existing TLS recovery pipelines can adopt GTLS without re-tuning thresholds.
Where Pith is reading between the lines
- The same kernel structure could be adapted to other GPU vendors or to multi-node clusters for even larger surveys.
- Analogous parallelization might accelerate other periodic-signal searches that rely on phase folding and least-squares scoring.
- Processing times short enough for near-real-time analysis could open new observing strategies for upcoming wide-field telescopes.
Load-bearing premise
The GPU kernels produce floating-point results that are numerically identical to the CPU reference for every light curve examined.
What would settle it
Running both GTLS and TLS on the same collection of real Kepler light curves and finding a statistically significant difference in the number or properties of recovered planets.
Figures
read the original abstract
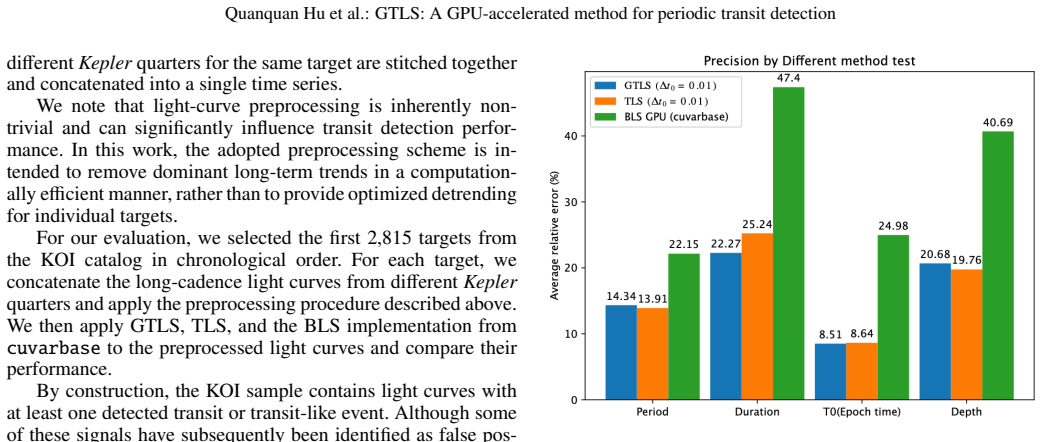
Computational efficiency is a critical requirement for transit searches in modern large-scale photometric surveys. We present Graphics Processing Units Transit Least Squares (GTLS), a GPU-accelerated implementation of the Transit Least Squares algorithm designed to reduce the computational cost of periodic transit detection while preserving TLS-like sensitivity to transit-shaped signals. GTLS parallelizes the dominant steps of the TLS search, including phase folding, transit-duration evaluation, moving-window depth estimation, and chi-squared calculation. Using Kepler-like long-cadence light curves and synthetic Kepler-like time series, we benchmark GTLS against the reference CPU implementation of TLS and the GPU-based BLS implementation in cuvarbase. On an AMD Ryzen 9 7950X CPU and an NVIDIA RTX 4090 GPU, GTLS processes a 3000-day synthetic light curve in approximately 138 seconds, compared with 3289 seconds for TLS. With two RTX 4090 GPUs, the runtime is reduced to approximately 79 seconds. In recovery tests, GTLS achieves detection performance statistically consistent with TLS, with a precision of 9.3 percent and recall of 79.4 percent, compared with 9.4 percent and 81.1 percent for TLS. These results demonstrate that GTLS enables efficient TLS-style searches for large photometric data sets from Kepler, TESS, PLATO, ET, and future missions. The source code is publicly available.
Editorial analysis
A structured set of objections, weighed in public.
Referee Report
Summary. The paper presents GTLS, a GPU-accelerated implementation of the Transit Least Squares (TLS) algorithm for periodic transit detection. It parallelizes phase folding, transit-duration evaluation, moving-window depth estimation, and chi-squared calculation, claiming a runtime reduction from 3289 s (TLS on CPU) to 138 s (GTLS on single RTX 4090) or 79 s (two GPUs) for a 3000-day synthetic Kepler-like light curve, while achieving statistically consistent detection performance (precision 9.3% and recall 79.4% for GTLS vs. 9.4% and 81.1% for TLS) on synthetic data. The source code is stated to be publicly available.
Significance. If numerical equivalence to TLS holds, GTLS would enable practical application of the sensitive TLS method to the large data volumes expected from PLATO, ET, and similar future surveys, where CPU-based TLS is currently prohibitive. The public availability of the source code is a strength that supports reproducibility of the reported wall-clock times and recovery statistics.
major comments (2)
- [Recovery tests] Recovery tests (as summarized in the abstract): aggregate precision and recall are reported as close but not identical (9.3%/79.4% vs 9.4%/81.1%), yet no per-light-curve comparison of best-fit periods, depths, or chi-squared values between GTLS and TLS is described. This leaves open the possibility that small differences arise from unquantified floating-point accumulation in the parallelized phase-folding or moving-window kernels rather than statistical variation alone.
- [Methods / Implementation] The manuscript provides no details on numerical precision handling, memory layout, or treatment of edge cases in the period grid within the GPU kernels. These omissions are load-bearing for the central claim of functional equivalence to TLS, as real data with gaps or non-Gaussian noise could amplify any discrepancies beyond what synthetic-injection statistics reveal.
minor comments (2)
- The abstract and text should explicitly state the number of synthetic light curves used in the recovery tests and the exact criteria for a 'detection' to allow direct auditing of the precision/recall numbers.
- Clarify whether the reported runtimes include data transfer overhead between host and device or are kernel-only timings.
Simulated Author's Rebuttal
We thank the referee for the constructive review and the recommendation for minor revision. We address each major comment below, proposing targeted revisions to strengthen the manuscript's claims of numerical equivalence while preserving the focus on performance.
read point-by-point responses
-
Referee: [Recovery tests] Recovery tests (as summarized in the abstract): aggregate precision and recall are reported as close but not identical (9.3%/79.4% vs 9.4%/81.1%), yet no per-light-curve comparison of best-fit periods, depths, or chi-squared values between GTLS and TLS is described. This leaves open the possibility that small differences arise from unquantified floating-point accumulation in the parallelized phase-folding or moving-window kernels rather than statistical variation alone.
Authors: We agree that aggregate statistics alone leave room for ambiguity regarding the source of the small observed differences. In the revised manuscript we will add a new paragraph and supplementary figure that reports the per-light-curve distributions of absolute differences in recovered period, transit depth, and minimum chi-squared between GTLS and TLS across the full set of synthetic injections. These distributions will be used to demonstrate that the discrepancies fall within the range expected from Monte-Carlo noise realizations rather than systematic kernel-level divergence. We retain the original aggregate precision/recall numbers but qualify them with this per-curve evidence. revision: yes
-
Referee: [Methods / Implementation] The manuscript provides no details on numerical precision handling, memory layout, or treatment of edge cases in the period grid within the GPU kernels. These omissions are load-bearing for the central claim of functional equivalence to TLS, as real data with gaps or non-Gaussian noise could amplify any discrepancies beyond what synthetic-injection statistics reveal.
Authors: We acknowledge that the current Methods section is insufficiently explicit on these implementation choices. The revised manuscript will contain a new subsection (2.3) that specifies: (i) use of IEEE-754 single-precision (float32) arithmetic throughout the GPU kernels with explicit accumulation of the chi-squared statistic in double precision to limit rounding error; (ii) memory layout employing coalesced global-memory accesses and shared-memory tiling for the phase-folding and moving-window steps; and (iii) identical period-grid construction and gap-handling logic to the reference TLS implementation, with explicit padding of light-curve edges to prevent boundary artifacts. These additions will be accompanied by a short verification that the GPU kernels reproduce the CPU reference results to within machine epsilon on a set of edge-case light curves containing large gaps. revision: yes
Circularity Check
No circularity; purely empirical implementation and benchmarks
full rationale
The paper presents a GPU port of the existing TLS algorithm together with runtime measurements and recovery statistics on synthetic light curves. No mathematical derivation, fitted model, or prediction step is claimed; all reported numbers (138 s vs 3289 s, precision 9.3 % vs 9.4 %, recall 79.4 % vs 81.1 %) are direct empirical outputs. No self-citations, ansatzes, or uniqueness theorems are invoked to support any derivation. The work is therefore self-contained against external benchmarks and receives the default non-circularity finding.
Axiom & Free-Parameter Ledger
axioms (1)
- domain assumption GPU kernels for phase folding, transit-duration evaluation, moving-window depth estimation, and chi-squared calculation produce results numerically equivalent to the reference CPU TLS code.
Reference graph
Works this paper leans on
-
[1]
L., Chen, X., Ciardi, D., et al
Akeson, R. L., Chen, X., Ciardi, D., et al. 2013, Publications of the Astronomical Society of the Pacific, 125, 989
2013
-
[2]
P ., et al
Ansdell, M., Ioannou, Y ., Osborn, H. P ., et al. 2018, ApJ, 869, L7
2018
-
[3]
J., Koch, D., Basri, G., et al
Borucki, W. J., Koch, D., Basri, G., et al. 2010, Science, 327, 977
2010
-
[4]
2023, A&A, 672, A144
Canocchi, G., Malavolta, L., Pagano, I., et al. 2023, A&A, 672, A144
2023
-
[5]
2022b, eprint arXiv:2206.06693 [arXiv:2206.06693]
Ge, J., Zhang, H., Zang, W., et al. 2022b, eprint arXiv:2206.06693 [arXiv:2206.06693]
-
[6]
2024b, Space Telescopes and Instrumentation 2024: Optical, Infrared, and Millimeter Wave, 45
Ge, J., Zhang, H., Zhang, Y ., et al. 2024b, Space Telescopes and Instrumentation 2024: Optical, Infrared, and Millimeter Wave, 45
2024
-
[7]
L., Chaplin, W
Gilliland, R. L., Chaplin, W. J., Jenkins, J. M., Ramsey, L. W., & Smith, J. C. 2015, The Astronomical Journal, 150, 133
2015
-
[8]
2011, The Astrophysical Journal, 732, 74
Guillochon, J., Ramirez-Ruiz, E., & Lin, D. 2011, The Astrophysical Journal, 732, 74
2011
-
[9]
J., Mulders, G
Hippke, M., David, T. J., Mulders, G. D., & Heller, R. 2019, AJ, 158, 143
2019
-
[10]
& Heller, R
Hippke, M. & Heller, R. 2019, A&A, 623, A39 Hoffman, J. 2017, cuvarbase
2019
-
[11]
B., Sobeck, C., Haas, M., et al
Howell, S. B., Sobeck, C., Haas, M., et al. 2014, PASP , 126, 398 Kovács, G., Zucker, S., & Mazeh, T. 2002, A&A, 391, 369
2014
-
[12]
2015, Publications of the Astronomical Society of the Pacific, 127, 1161
Kreidberg, L. 2015, Publications of the Astronomical Society of the Pacific, 127, 1161
2015
-
[13]
2023, Research Notes of the AAS, 7, 28 Ofir, A
Kunimoto, M., Tey, E., Fong, W., et al. 2023, Research Notes of the AAS, 7, 28 Ofir, A. 2014, A&A, 561, A138
2023
-
[14]
2017, in NIPS
Okuta, R., Unno, Y ., Nishino, D., Hido, S., & Loomis, C. 2017, in NIPS
2017
-
[15]
2021, MNRAS, 502, 2845
Rao, S., Mahabal, A., Rao, N., & Raghavendra, C. 2021, MNRAS, 502, 2845
2021
-
[16]
2025, Experimental Astronomy, 59
Rauer, H., Aerts, C., Cabrera, J., et al. 2025, Experimental Astronomy, 59
2025
-
[17]
2014, Exp
Rauer, H., Catala, C., Aerts, C., et al. 2014, Exp. Astron., 38, 249
2014
-
[18]
R., Winn, J
Ricker, G. R., Winn, J. N., V anderspek, R., et al. 2014, J. Astron. Telescopes Instrum. Syst., 1, 014003
2014
-
[19]
Shallue, C. J. & V anderburg, A. 2018, AJ, 155, 94
2018
-
[20]
1966, Applied Regression Analysis (John Wiley & Sons, Inc.)
Smith, D. . 1966, Applied Regression Analysis (John Wiley & Sons, Inc.)
1966
-
[21]
2024, Monthly Notices of the Royal Astronomical Society, 528, 4053 Article number, page 11
Wang, K., Ge, J., Willis, K., Wang, K., & Zhao, Y . 2024, Monthly Notices of the Royal Astronomical Society, 528, 4053 Article number, page 11
2024
discussion (0)
Sign in with ORCID, Apple, or X to comment. Anyone can read and Pith papers without signing in.