REVIEW 4 major objections 4 minor 38 references
Intrinsic pH of water/vapor interface revealed by ion-induced water alignment
T0 review · 4 major / 4 minor · reviewed 2026-08-14 · deepseek-v4-flash
Pith's one-line read Measuring ion alignment puts the surface pH of pure water at 6.34, not 7.
desk verdict The real advance is the measured hydronium partitioning coefficient K = 11.2 Å; the headline ΔpH and ΔG are model-dependent conversions from an assumed layer thickness, and the abstract overstates them. read the letter →
The pith
A machine-rendered reading of the paper's core claim, the machinery that carries it, and where it could break.
The reading
What carries the argument
The load-bearing device is the spectral separation of the effective second-order susceptibility χ_eff^(2)(ω_IR) into a bonded interface layer term χ_BIL^(2) and an electrical double layer term χ_EDL^(2), where the EDL term is expressed as the product of the bulk third-order susceptibility χ^(3) of water and a field integral Ψ = ∫ E_0(z') $e^{{iΔk_z z'}}$ dz'. Because χ^(3) of bulk water is known, fitting the measured EDL spectra with the Gouy-Chapman electric field E_0(z) determines the surface charge density σ. A partitioning model then assigns surface densities of hydronium and halide ions proportional to their bulk concentrations, with halide coefficients fixed by separate measurements on HX–NaX mixtures, leaving K(H3O+) as the fitted slope of the hydronium surface density versus bulk proton concentration.
What would settle it
An independent measurement of the hydronium depth profile at the water/vapor interface, for example by grazing-incidence X-ray reflectivity or resonant interface-specific spectroscopy with depth resolution, would determine the effective layer thickness L directly. If L falls outside the assumed 1.97–3.1 Å range, the quoted ΔpH = -0.66 and ΔG = -3.74 kJ/mol would shift proportionally while the measured K = 11.2 Å would remain unchanged.
Extended reading notes
Core claim
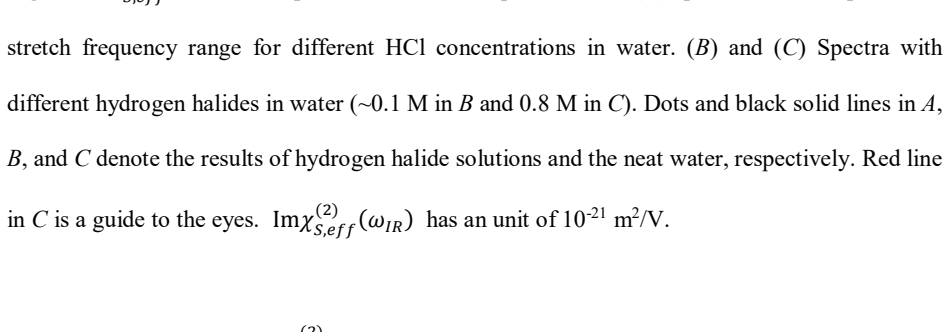
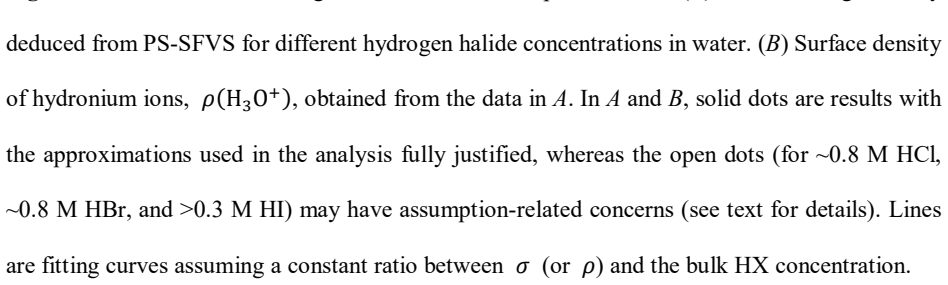
The central claim is that hydronium ions (H3O+) at the intrinsic water/vapor interface follow a constant partitioning coefficient K(H3O+) = 11.2 (±1.0) Å, independent of the halide counterion, for bulk ion concentrations up to about 0.3 M. This corresponds to an adsorption free energy ΔG = -3.74 (±0.56) kJ/mol and a surface pH reduction ΔpH = -0.66 (±0.10) relative to the bulk value. The deduction is made by phase-sensitive sum-frequency vibrational spectroscopy: the spectra are separated into a bonded interface layer (BIL) contribution and an electrical double layer (EDL) contribution, and the EDL signal, which arises from water molecules aligned by the dc field of adsorbed ions, is fitted with Gouy-Chapman theory using the known third-order susceptibility of bulk water. The paper argues that the invariance of the hydronium partitioning across HCl, HBr, and HI reveals an intrinsic property of the hydronium ion, not a specific ion-ion interaction, and that the same partitioning applies down to very low concentrations, so the surface pH of pure water is 6.34 (±0.10) at bulk pH 7.
Load-bearing premise
The conversion of the measured surface excess (K = 11.2 Å) into the headline pH reduction and adsorption free energy assumes that hydronium ions sit in a surface layer only 1.97–3.1 Å thick, a range borrowed from theoretical reports and not measured here; any change in that thickness shifts ΔpH and ΔG proportionally.
Editorial extensions
If this is right
- Pure water's surface pH becomes a fixed reference value, 6.34 at bulk pH 7, giving atmospheric and environmental models a concrete number to use for aerosol surfaces.
- The hydronium adsorption free energy being counterion-independent means that mixed acid solutions should follow a common proton-adsorption curve up to roughly 0.3 M, simplifying predictions for multi-component systems.
- Molecular dynamics simulations of protons at water interfaces can use the measured K = 11.2 Å and ΔG = -3.74 kJ/mol as direct validation targets for interaction potentials.
- The demonstrated procedure for separating BIL and EDL contributions to SFG spectra provides a quantitative route to surface charge densities at other charged aqueous interfaces.
- Surface tension analyses that imply much stronger proton adsorption (ΔG near -7.5 kJ/mol) would need to reconcile with the weaker affinity measured here.
Reading between the lines
- The counterion-independence of hydronium adsorption suggests the affinity originates from the proton's ability to donate hydrogen bonds to interfacial water, a mechanism that would also operate at other hydrophobic or amphiphilic interfaces, though the paper does not test that.
- The headline ΔpH is more model-dependent than the raw K value: if a future measurement of the ion depth profile finds an effective layer thickness outside the assumed 1.97–3.1 Å range, the surface pH shifts proportionally while the measured surface excess remains valid.
- The same EDL analysis could be extended to hydroxide by working at very high pH, but the paper reports an undetectably small signal below ~1 M NaOH, indicating that a more sensitive probe or stronger χ^(3) would be needed for the basic side of the pH scale.
- Because the paper extrapolates the constant partitioning down to pure water, the idea of an 'acidic water surface' is given a precise quantitative form that future experiments on very dilute acid or salt solutions could directly test.
Signed reviews
Editorial analysis
A structured set of objections, weighed in public.
Referee Report
Summary. This manuscript presents phase-sensitive sum-frequency vibrational spectroscopy (PS-SFVS) measurements of the water/vapor interface for HCl, HBr, and HI solutions. Using the neat-water spectrum as the reference and assuming that the bonded interface layer (BIL) contribution is invariant under added acid, the authors isolate the electrical double layer (EDL) spectrum and fit it with Gouy–Chapman theory plus a previously measured bulk chi^(3) spectrum to obtain absolute surface charge densities sigma. From sigma as a function of acid and salt concentration, they determine halide partition coefficients K(Cl-), K(Br-), K(I-) and a hydronium partition coefficient K(H3O+) = 11.2 ± 1.0 Å, reported as independent of the counterion. Dividing K by an assumed surface-layer thickness L between 1.97 and 3.1 Å, they report a volume-based partition coefficient K_V ≈ 3.6–5.7, a surface pH reduction ΔpH = -0.66 ± 0.10 relative to bulk, and an adsorption free energy ΔG = -3.74 ± 0.56 kJ/mol, concluding that the intrinsic pH of pure water at bulk pH 7 is 6.34 ± 0.10.
Significance. The paper addresses a long-standing question in aqueous interfacial chemistry: the quantitative surface affinity of hydronium ions. The central experimental result, a counterion-independent surface excess partition coefficient K(H3O+) = 11.2 ± 1.0 Å, would be an important quantitative constraint for molecular dynamics models and atmospheric chemistry if it survives scrutiny. The strengths are the phase-sensitive measurement, the restriction of the quantitative analysis to low-concentration data, the internal cross-checks against modified Gouy–Chapman theory and PS-SHG, and the consistency of the hydronium densities inferred from three different acids. The procedure is not circular—the partition coefficients are fitted outputs—but the headline ΔpH and ΔG are converted from K using an assumed layer thickness L, so the absolute surface pH and free energy are less precisely determined than the quoted error bars suggest. The paper therefore merits publication only after the model dependence of the headline quantities is made explicit and quantified.
major comments (4)
- [Results and Discussion (BIL invariance, near Eq. (1))] The argument that the BIL contribution is unchanged by ions is tested only in the 3600–3750 cm⁻¹ region, where the authors explicitly note that chi_EDL is negligible because chi_bulk^(3) appears mainly below 3600 cm⁻¹. This same invariance is then used to subtract the neat-water spectrum over the entire OH stretch, including the 3000–3600 cm⁻¹ region where the EDL contribution is largest. If the BIL spectrum changes with ion concentration in that region, the extracted chi_EDL, and hence sigma, K(H3O+), ΔpH, and ΔG, would be biased. The cited AIMD result (ref 4) supports the claim, but the experimental evidence in this paper is limited to a frequency window that, by design, has almost no EDL content; this extrapolation needs explicit defense or a direct test.
- [Results and Discussion (conversion of K to ΔpH and ΔG)] The conversion of K(H3O+) = 11.2 Å into volume-based quantities uses an assumed effective layer thickness L between 1.97 Å and 3.1 Å, taken from theoretical reports (refs 4, 8, 36), as the text states. Over this L range, K_V = K/L runs from 3.61 to 5.68, giving ΔpH between about -0.56 and -0.75 and ΔG between about -3.2 and -4.3 kJ/mol. The quoted uncertainty ±0.10 in ΔpH propagates only the fit error of K, not the factor-of-1.6 ambiguity in L or the possibility that the hydronium density profile is not a uniform slab. Because the abstract and conclusion present ΔpH = -0.66 (±0.10) and ΔG = -3.74 (±0.56) kJ/mol without this model dependence, the headline values overstate the precision of the measurement. The authors should report the L-induced range or an effective total uncertainty, and state clearly in the abstract that the volume-based quantities depend on a theoretical layer thickness.
- [Experiment and Theory (Eq. (1), calibration against ref. 24)] The absolute scale of sigma, and therefore of every K value and of the final ΔG and ΔpH, is proportional to the assumed chi_bulk^(3)(ω_IR) spectrum from ref. 24, which shares an author with the present work. The paper quotes only statistical fit uncertainties and does not bound the systematic error of this calibration. Since the manuscript's central quantitative claims are absolute adsorption free energies and surface pH values, the authors should either propagate an estimated calibration uncertainty or provide an independent check of chi_bulk^(3) before the absolute numbers are used as benchmarks.
- [Results and Discussion (extrapolation to bulk pH 7)] The claim that ΔpH = -0.66 applies to pure water at bulk pH 7 involves an extrapolation from the measured acid concentration range (roughly 1 mM to 0.3 M in [H+]) down to 10⁻⁷ M hydronium concentration. The linear partitioning model may be a reasonable assumption, but it is not tested over the seven orders of magnitude in concentration implied by the extrapolation. The statement that the deduced quantities are 'applicable to aqueous interfaces with even lower ion concentrations' should be framed explicitly as an assumption rather than as a direct measurement.
minor comments (4)
- [Abstract/header] The manuscript header contains the typo 'ABTRACT' instead of 'ABSTRACT'; this should be corrected.
- [Results and Discussion (K(Cl-) determination)] The reported K(Cl-) = -0.54 (±0.62) Å is unphysical as a partitioning coefficient; since it is statistically consistent with zero, the authors should report it as zero within uncertainty rather than as a negative coefficient, and should state how this choice affects the error budget for ρ(H3O+) in HCl solutions.
- [Main text, ion-species discussion] The phrase 'much mirror role at acidic pH' appears to contain a typo and should likely read 'much minor role'; please correct the wording.
- [Fig. 3 and fitting ranges] The main text does not specify the exact concentration ranges and number of points used in the linear fits for σ and ρ(H3O+); this information should be stated explicitly so that the reader can judge the robustness of the reported slopes.
Circularity Check
No circularity: the measured surface excess K is fitted from EDL spectra, and ΔpH/ΔG are explicitly model-dependent conversions, not self-referential reductions.
full rationale
The derivation chain is: (i) measure Im χ_eff^(2) for HX solutions and the neat water reference; (ii) for concentrations where the BIL spectrum is invariant, subtract the neat-water BIL spectrum to isolate χ_EDL^(2); (iii) fit χ_EDL^(2) with the Gouy-Chapman E0(z) and the independently measured bulk χ_bulk^(3) to obtain σ; (iv) determine K(X-) from the slope of σ versus [X-] in HX–NaX mixtures at fixed [H+]; (v) subtract the halide contribution to obtain ρ(H3O+) = σ/|e| − ρ(X-) for pure HX solutions and fit K(H3O+) = 11.2 Å; (vi) convert K to K_V by dividing by an effective layer thickness L taken from theoretical reports (refs 4, 8, 36). Step (vi) is a model-dependent unit conversion explicitly disclosed in the text ('Because such information is not experimentally available, we follow the theoretical reports (4, 8, 36)...'), not a derivation of ΔpH or ΔG from themselves. The use of χ_bulk^(3) from ref. 24, a prior paper by the same corresponding author, is a calibration input, but it is a measured bulk property rather than the target surface result, and the paper cross-checks σ by independent PS-SHG measurements in SI section 5. No equation defines K(H3O+) in terms of ΔpH or ΔG, and no fitted parameter is renamed as the headline quantity; the headline follows from the fitted K via an explicit division by an external L. The reported error bars propagate only the K uncertainty and not the uncertainty in L, but that is a caveat about the headline's model dependence, not a circular derivation. Therefore no step reduces by construction to its own input.
Assumptions & free parameters
free parameters (5)
- K(H3O+) =
11.2 ±1.0 Å
- K(Cl-) =
-0.54 ±0.62 Å
- K(Br-) =
2.68 ±1.28 Å
- K(I-) =
4.62 ±0.98 Å
- Effective surface layer thickness L =
1.97 to 3.1 Å (assumed, not fitted)
assumptions (6)
- domain assumption Gouy-Chapman theory with point-charge ions gives the dc field E0(z) for a given surface charge sigma and ionic strength.
- domain assumption The third-order susceptibility of water in the EDL equals the bulk water chi_bulk^(3) measured previously.
- domain assumption The bonded interface layer (BIL) spectrum is unchanged by ions for the concentration ranges used, so chi_BIL^(2)(sigma) approximately equals chi_BIL0^(2).
- domain assumption Na+ is not adsorbed at the water/vapor interface in the HX-NaX mixtures.
- domain assumption OH- contribution is negligible at acidic pH.
- domain assumption Hydronium surface excess is confined to a layer of thickness L between 1.97 and 3.1 Å.
Cite this review
Pith. "Pith review of Intrinsic pH of water/vapor interface revealed by ion-induced water alignment." pith.science (2026). https://pith.science/paper/QSBKD4RS
@misc{pith2026190809433,
  author       = {Pith},
  title        = {Pith review of: Intrinsic pH of water/vapor interface revealed by ion-induced water alignment},
  year         = {2026},
  howpublished = {\url{https://pith.science/paper/QSBKD4RS}},
  note         = {Machine review of arXiv:1908.09433}
}
read the original abstract
Protons at the water/vapor interface are relevant for atmospheric and environmental processes, yet to characterize their surface affinity on the quantitative level is still challenging. Here we utilize phase-sensitive sum-frequency vibrational spectroscopy to quantify the surface density of protons (or their hydronium form) at the intrinsic water/vapor interface, through inspecting the surface-field-induced alignment of water molecules in the electrical double layer of ions. With hydrogen halides in water, the surface adsorption of protons is found to be independent of specific proton-halide anion interactions and to follow a constant adsorption free energy, G about -3.74 (+/-0.56) kJ/mol, corresponding to a reduction of the surface pH with respect to the bulk value by 0.66 (+/-0.10), for bulk ion concentrations up to 0.3 M. Our spectroscopic study is not only of importance in atmospheric chemistry, but also offers a microscopic-level basis to develop advanced quantum-mechanical models for molecular simulations.
Figures


Figures from the paper (1 more)
Reference graph
Works this paper leans on
-
[1]
(1987) The Chemistry of Acid Rain: Sources and Atmospheric Processes (American Chemical Society: Washington, DC)
work page 1987
-
[2]
Environmental Pollution 50(1-2):29-59
Irwin JG & Williams ML (1988) Acid rain: Chemistry and transport. Environmental Pollution 50(1-2):29-59
work page 1988
-
[3]
Chemical Reviews 106(4):1259-1281
Jungwirth P & Tobias DJ (2006) Specific ion effects at the air/water interface. Chemical Reviews 106(4):1259-1281
work page 2006
-
[4]
Pezzotti S & Gaigeot MP (2018) Spectroscopic BIL-SFG invariance hides the chaotropic effect of protons at the air-water interface. Atmosphere 9(10):396
work page 2018
-
[5]
Proceedings of the National Academy o f Sciences of the United States of America 104(18):7342-7347
Buch V, Milet A, Vacha R, Jungwirth P, & Devlin JP (2007) Water surface is acidic. Proceedings of the National Academy o f Sciences of the United States of America 104(18):7342-7347
work page 2007
-
[6]
Journal of Chemical Physics 119(12):6351-6353
Dang LX (2003) Solvation of the hydronium ion at the water liquid/vapor interface. Journal of Chemical Physics 119(12):6351-6353
work page 2003
-
[7]
Journal of Physical Chemistry A 111(38):9277-9285
Ishiyama T & Morita A (2007) Molecular dynamics analysis o f interfacial structures and sum frequency generation spectra of aqueous hydrogen halide solutions. Journal of Physical Chemistry A 111(38):9277-9285
work page 2007
-
[8]
Journal of the American Chemical Society 137(39):12610-12616
Tse YLS, Chen C, Lindberg GE, Kumar R, & Voth GA (2015) Propensity of hydrated excess protons and hydroxide anions for the air -water interface. Journal of the American Chemical Society 137(39):12610-12616
work page 2015
Show all 38 references
-
[9]
(2011) Increased propensity of I-aq(-) for the water surface in non-neutral solutions: Implications for the interfacial behavior of H3Oaq+ and OHaq
Ottosson N, et al. (2011) Increased propensity of I-aq(-) for the water surface in non-neutral solutions: Implications for the interfacial behavior of H3Oaq+ and OHaq. Journal of Physical Chemistry Letters 2(9):972-976
2011
-
[10]
Physical Chemistry Chemical Physics 15(33):13991-13998
Shapovalov VL, Mohwald H, Konovalov OV, & Knecht V (2013) Negligible water surface charge determined using Kelvin probe and total reflection X -ray fluorescence techniques. Physical Chemistry Chemical Physics 15(33):13991-13998
2013
-
[11]
Journal of Physical Chemistry B 109(16):7976-7980
Petersen PB & Saykally RJ (2005) Evidence for an enhanced hydronium concen tration at the liquid water surface. Journal of Physical Chemistry B 109(16):7976-7980
2005
-
[12]
Journal of the American Chemical Society 128(45):14519-14527
Tarbuck TL, Ota ST, & Richmond GL (2006) Spectroscopic studies of solvated hydrogen and hydroxide ions at aqueous surfaces. Journal of the American Chemical Society 128(45):14519-14527
2006
-
[13]
Chemical Reviews 106(4):1155-1175
Gopalakrishnan S, Liu DF, Allen HC, Kuo M, & Shultz MJ (2006) Vibrational spectroscopic studies of aqueous interfaces: Salts, acids, bases, and nanodrops. Chemical Reviews 106(4):1155-1175
2006
-
[14]
Journal of the American Chemical Society 130(39):13033-13039
Tian CS, Ji N, Waychunas GA, & Shen YR (2008) Interfacial structures of acidic and basic aqueous solutions. Journal of the American Chemical Society 130(39):13033-13039
2008
-
[15]
Journal of the American Chemical Society 137(43):13920-13926
Hua W, Verreault D, & Allen HC (2015) Relative Order of Sulfuric Acid, Bisulfate, Hydronium, and Cations at the Air -Water Interface. Journal of the American Chemical Society 137(43):13920-13926
2015
-
[16]
Journal of Chemical Physics 137(15):151101
Yamaguchi S, Kundu A, Sen P, & Tahara T (2012) Communication: Quantitative estimate of the water surface pH using heterodyne -detected electronic sum frequency generation. Journal of Chemical Physics 137(15):151101
2012
-
[17]
(2016) Protons and Hydroxide Ions in Aqueous Systems
Agmon N , et al. (2016) Protons and Hydroxide Ions in Aqueous Systems. Chemical Reviews 116(13):7642-7672
2016
-
[18]
Proceedings of the National Academy of Sciences of the United States of America 103(39):14278-14281
Pegram LM & Record MT (2006) Partitioning of atmospherically relevant ions between bulk water and the water/vapor interface. Proceedings of the National Academy of Sciences of the United States of America 103(39):14278-14281
2006
-
[19]
what d o vibrating plate methods, second harmonic and sum frequency measure? Journal of Physical Chemistry Letters 9(19):5685-5691
Dreier LB, Bemhard C, Gonella G, Backus EHG, & Bonn M (2018) Surface potential of a planar charged lipid -water interface. what d o vibrating plate methods, second harmonic and sum frequency measure? Journal of Physical Chemistry Letters 9(19):5685-5691
2018
-
[20]
Ong SW, Zhao XL, & Eisenthal KB (1992) Polarization of water molecules at a charged interface: second harmonic studies of the s ilica/water interface Chemical Physics Letters 191(3-4):327-335
1992
-
[21]
(2018) Saturation of charge-induced water alignment at model membrane surfaces
Dreier LB, et al. (2018) Saturation of charge-induced water alignment at model membrane surfaces. Science Advances 4(3):eaap7415
2018
-
[22]
Physical Chemistry Chemical Physics 20(7):5190-5199
Pezzotti S, Galimberti DR, Shen YR, & Gaigeot MP (201 8) Structural definition of the BIL and DL: a new universal methodology to rationalize non -linear chi((2))(omega) SFG signals at charged interfaces, including chi((3))(omega) contributions. Physical Chemistry Chemical Phys...
-
[23]
Journal of Physical Chemistry C 122(21):11407-11413
Joutsuka T & Morita A (2018) Electrolyte and temperature effects on third -order susceptibility in sum-frequency generation spectroscopy of aqueous salt solutions. Journal of Physical Chemistry C 122(21):11407-11413
2018
-
[24]
(2016) Unveiling microscopic structures of charged water interfaces by surface-specific vibrational spectroscopy
Wen Y-C, et al. (2016) Unveiling microscopic structures of charged water interfaces by surface-specific vibrational spectroscopy. Physical Review Letters 116:016101
2016
-
[25]
Journal of Physical Chemistry C 120(17):9165-9173
Gonella G, Lutgebaucks C, de Beer AGF, & Roke S (2016) Second harmonic and sum - frequency generation from aqueous interfaces is modu lated by interference. Journal of Physical Chemistry C 120(17):9165-9173
2016
-
[26]
Journal of Physical Chemistry C 120(28):15224-15229
Wen YC, Zha S, Tian CS, & Shen YR (2016) Surface pH and ion affinity at the alcohol - monolayer/water interface studied by sum -frequency spectroscopy. Journal of Physical Chemistry C 120(28):15224-15229
2016
-
[27]
(2019) Beyond the Gouy -Chapman Model with Heterodyne -Detected Second Harmonic Generation
Ohno PE , et al. (2019) Beyond the Gouy -Chapman Model with Heterodyne -Detected Second Harmonic Generation. Journal of Physical Chemistry Letters 10(10):2328-2334
2019
-
[28]
Nature Communications 8:1032
Ohno PE, Wang HF, & Geiger FM (2017) Second-order spectral lineshapes from charged interfaces. Nature Communications 8:1032
2017
-
[29]
Journal of the American Chemical Society 134(18):7842-7850
Mondal JA, Nihonyanagi S, Yamaguchi S, & Tahara T (2012) Three distinct water structures at a zwitterionic lipid/water interface revealed by heterodyne -detected vibrational sum frequency ge neration. Journal of the American Chemical Society 134(18):7842-7850
2012
-
[30]
Physical Review Letters 100(9):096102
Ji N, Ostroverkhov V, Tian CS, & Shen YR (2008) Characterization of vibrational resonances of water -vapor interfaces by phase -sensitive sum -frequency spectroscopy. Physical Review Letters 100(9):096102
2008
-
[31]
Bard AJ & Faulkner LR (1980) Electrochemical Methods: Fundamentals and Applications (Wiley, New York)
1980
-
[32]
(2011) Hydrogen bonding at the water surface revealed by isotopic dilution spectroscopy
Stiopkin IV , et al. (2011) Hydrogen bonding at the water surface revealed by isotopic dilution spectroscopy. Nature 474(7350):192-195
2011
-
[33]
(1) has negligible influences on interpretation of the EDL spectra in Fig
The phase factor exp( ikzz) in Eq. (1) has negligible influences on interpretation of the EDL spectra in Fig. 2 [phase of exp(ikzz) is < 7o for bulk ion concentrations > 3 mM]
-
[34]
Journal of Physical Chemistry Letters 2(15):1946-1949
Tian C, Byrnes SJ, Han H -L, & Shen YR (2011) Surface propen sities of atmospherically relevant ions in salt solutions revealed by phase -sensitive sum frequency vibrational spectroscopy. Journal of Physical Chemistry Letters 2(15):1946-1949
2011
-
[35]
The average separation between ions in this study is larger than the Bjerrum length in water, suggesting that correlation between ions caused by their electrostatic interactions is not important
-
[36]
Journal of Chemical Physics 133(15):154107
dos Santos AP & Levin Y (2010) Surface tensions and surface potentials of acid solutions. Journal of Chemical Physics 133(15):154107
2010
-
[37]
Angewandte Chemie-International Edition 56(50):15846-15851
Mamatkulov SI, Allolio C, Netz RR, & Bonthuis DJ (2017) Orientation-induced adsorption of hydrated protons at the air -water Interface. Angewandte Chemie-International Edition 56(50):15846-15851
2017
-
[38]
Physical Review Letters 79(3):435-438
Borukhov I, Andelman D, & Orland H ( 1997) Steric effects in electrolytes: A modified Poisson-Boltzmann equation. Physical Review Letters 79(3):435-438. Figure Captions: Fig. 1. Im߯ௌ, (ଶ) (߱ூோ) SFG spectra of the water/vapor interface. (A) Spectra in the complete OH- stretc...
1997
Reviewed August 14, 2026 · model on record in the stance chip above.
Discussion (0). Continue with ORCID to comment.