REVIEW 3 major objections 4 minor 57 references
The Quasi-Radial Field-line Tracing (QRaFT): an Adaptive Segmentation of the Open-Flux Solar Corona
T0 review · 3 major / 4 minor · reviewed 2026-08-07 · deepseek-v4-flash
Pith's one-line read QRaFT recovers field-aligned structures in coronagraph images, with numerical tests showing 4–7 degree alignment to the underlying MHD magnetic field.
desk verdict A useful, clearly-described open-source tracing method whose headline accuracy number is in-sample and post-filter; worth peer review but needs stricter validation. read the letter →
The pith
A machine-rendered reading of the paper's core claim, the machinery that carries it, and where it could break.
The reading
What carries the argument
The load-bearing object is the enhanced polar image $I_{\rm enh}(\varphi,\rho) = I''/I''_{\rm tr}$, the unsigned second-order azimuthal derivative of the smoothed, radially detrended image normalized by its large-scale azimuthal trend. In plane-polar coordinates a quasi-radial structure appears as an azimuthal intensity crest, and the unsigned second derivative produces sharp local maxima at the crest and its wings that adaptive thresholding can detect. The detector loops over percentile thresholds and inner radial boundaries, labels contiguous pixel clusters, and represents each cluster by a polynomial fit to its radial sequence of azimuthal centroids, yielding continuous traced features with local orientation angles $\xi$ and a misalignment angle $\theta$ relative to the outward model field.
What would settle it
Apply QRaFT to synthetic white-light images from a structurally different, independently built coronal MHD model; if the median misalignment against that model's magnetic field clearly exceeds 7 degrees, the claimed accuracy is a property of the test model rather than a general property of the tracing method.
Extended reading notes
Core claim
The central discovery is that the azimuthal structure of a radially detrended coronagraph image encodes the local orientation of the open coronal magnetic field. QRaFT deliberately sacrifices radial intensity gradients, which carry little field-geometry information, in favor of azimuthal gradients that mark narrow quasi-radial density structures. After remapping to polar coordinates, anisotropic smoothing, unsigned second-order azimuthal differencing, adaptive percentile thresholding, and a sliding inner radial boundary, the detected pixel clusters are interpolated into continuous features whose segment angles match the outward plane-of-sky magnetic field of the underlying thermodynamic MHD solution to within roughly 4–7 degrees. To the authors' knowledge, no other method traces open-field structures in routinely collected non-eclipse coronagraph images, and QRaFT is offered as a fill for that gap.
Load-bearing premise
The method's claimed accuracy rests on the premise that the simulated corona used to build the test images is geometrically similar enough to the real corona that the 4–7 degree alignment measured against the simulation's own magnetic field transfers to real coronagraph observations.
Editorial extensions
If this is right
- QRaFT output can be overlaid on model field-line maps as a direct visual and quantitative check of where a simulated corona's open-field geometry matches the observed white-light structure.
- Misalignment statistics such as the COR1 example can be interpreted as data-derived measures of model boundary quality, since a boundary magnetogram 14 days old produces larger apparent errors.
- The method's accuracy is highest in open-flux regions and degrades in closed-flux streamers, so practical use should focus on open-corona segmentation and treat closed-loop encounters as flagged outliers.
- As space-borne coronagraphs approach eclipse-image quality, QRaFT-style tracing could be run systematically for operational solar wind and CME forecasting.
Reading between the lines
- If the 4–7 degree alignment is confirmed with independent field measurements, misalignment maps could be used as a data-driven spatial score for coronal model skill, highlighting specific longitudes and heights where a model's field geometry is wrong.
- Comparing QRaFT features against an emissivity-weighted, line-of-sight-integrated model field, rather than the plane-of-sky field at each node, would probably shrink the apparent misalignment in real coronagraph data and could be tested immediately on the paper's synthetic pB images.
- Running QRaFT on a sequence of coronagraph images over a solar cycle could track the evolution of open-flux boundaries in white light and connect them to coronal-hole observations and solar wind stream structure.
- Because QRaFT intentionally discards closed-loop features, pairing it with an active-region loop tracer would produce a combined observational connectivity map of the whole corona.
Editorial analysis
A structured set of objections, weighed in public.
Referee Report
Summary. This paper introduces QRaFT, an image-processing pipeline that detects quasi-radial, field-aligned structures in white-light coronagraph images and uses their local orientation as a proxy for the plane-of-sky direction of the open coronal magnetic field. The method is described in detail: radial detrending, transformation to polar coordinates, anisotropic smoothing, unsigned second-order azimuthal differencing, adaptive percentile thresholding with a sliding inner boundary, cluster labeling, polynomial interpolation of feature nodes, computation of local orientation angles, and automatic feature validation filters. Validation is performed on synthetic images from a single thermodynamic MAS MHD simulation—both a central-plane density array and a FORWARD-computed pB image—where the ground-truth magnetic field is known, and the authors report a characteristic misalignment of about 4–7 degrees for surviving features. The paper also demonstrates the pipeline on a STEREO/COR1 image and on a 2017 total-solar-eclipse image, and it argues that QRaFT provides an empirical constraint for coronal and solar-wind models.
Significance. If the stated accuracy holds in an out-of-sample sense, QRaFT would fill a genuine gap: it is, to my knowledge, the first published method aimed specifically at tracing open-flux coronal structures in routinely collected non-eclipse coronagraph images. The strengths of the paper are substantial: the algorithm is specified in enough mathematical detail to be reimplemented; the source code is publicly available on GitHub; the synthetic test is a real consistency check, because the algorithm does not take the model magnetic field as input and no equation reduces to fitted values; and the authors are unusually candid about the limitations, including closed-loop contamination, the model-data mismatch in the COR1 comparison, and the deferral of systematic validation to a companion paper. The principal weakness is that the headline 4–7 degree claim is measured on the same model snapshot used to tune the processing parameters and only on features that survive the validation filters, so its transferability to real observations is not established.
major comments (3)
- [§3.1, Fig. 7, Table 2] The central quantitative claim—that QRaFT features are aligned within ~4–7 degrees of the model magnetic field—is computed from a single MAS snapshot, and the QRaFT processing keywords in Table 2 (PSI MAS column) are customized for that data source, as Section 2.2 states that these parameters must be optimized for image resolution, noise, and radial range. Moreover, the statistics in Fig. 7 are computed only for features that survive the validation filters of Eqs. (25)–(31), which reject short, curved, and faint features. Because those filters preferentially remove the least field-aligned and most loop-like detections, the quoted accuracy is a post-selection property of the pipeline, not an unconditional property of the tracing. The paper provides no train/test separation, no second model snapshot, and no independent model check. To support the abstract's claim, please provide out-of-sample validation (e.g., a different MAS time step or a different MHD model) and, ideally, report the misalignment statistics for all features before filtering as well as for the validated subset.
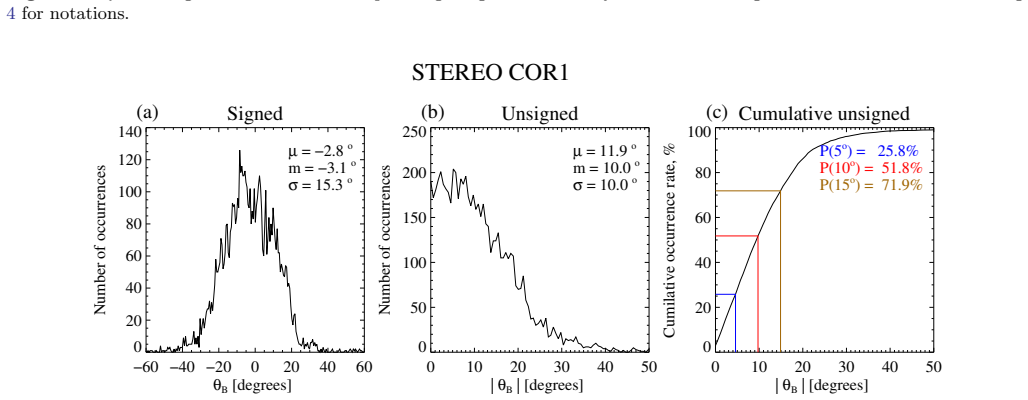
- [§3.2, Fig. 9] The COR1 comparison is presented as a performance demonstration, but the ground truth is the same MAS model whose boundary magnetograms predate the COR1 observation by up to 14 days (Section 3.1). The measured degradation in Fig. 9 (P(10°) = 51.8%) is therefore an inseparable mixture of QRaFT error and model-data mismatch, as the authors themselves acknowledge. This means the manuscript contains no quantitative validation of QRaFT against an independent source of real-image ground truth. If the paper is to support the claim that QRaFT transfers to real coronagraph images, the authors need either to compare against a more contemporaneous model run or to state explicitly, in the abstract and conclusions, that real-image validation is currently qualitative only.
- [§4, §3.1] The paper defers the 'more systematic performance and error analysis' to Rura et al. (2025), which is cited as under review. The present manuscript thus does not, on its own, contain the evidence needed to support the headline 4–7 degree accuracy claim beyond a single, in-sample, post-filter measurement. I recommend that the authors make the current manuscript self-contained for its main claim—for example, by including a multi-snapshot or multi-viewing-angle error analysis, or by explicitly rephrasing the claim as a preliminary finding pending the companion paper. This is a load-bearing issue because the abstract's numerical claim is the paper's primary takeaway.
minor comments (4)
- [§2.2] In the paragraph following Eq. (4), the sentence 'the detrended image Idetr(x, y) undergoes is transformed into plane polar coordinates' contains a grammatical error ('undergoes is transformed'); please remove 'is'.
- [§2.5, Eq. (25) vicinity] There is a typo in the text after Eq. (25): 'local magnetic filed orientation' should read 'local magnetic field orientation'.
- [Fig. 7 caption] The phrase 'The first raw of the panels' in the caption of Fig. 7 should be 'The first row of the panels'.
- [§3.3, Fig. 11] The section mentions that some visually identifiable quasi-radial structures are missed by QRaFT, but no quantitative detection-completeness measure is provided; a simple statement of the fraction of visual structures recovered would strengthen the demonstration.
Circularity Check
No significant circularity: QRaFT's feature tracing never consumes the model magnetic field, and the quoted alignment is a measured statistic rather than a fitted parameter or definitional identity.
full rationale
The derivation chain is algorithmically self-contained. The QRaFT pipeline (Sections 2.2-2.5) operates only on image intensity (radial detrending Eq. 3, polar transform Eq. 4, second-order azimuthal differencing Eq. 6, adaptive thresholding Eq. 9, cluster tracing Eqs. 10-15, and filtering Eqs. 25-31); the model magnetic field enters only at the validation stage through the misalignment metric of Eq. 24, not as an input to detection. The 4-7 degree claim is therefore a measured statistic on surviving features, not a quantity fitted from the field. The strongest concern is that the synthetic test in Section 3.1 uses the same MAS snapshot to create both the density/pB images and the ground-truth field, and the processing keywords in Table 2 are customized per data source, so the quoted alignment is in-sample and partly post-selection after the validation filters. That is a legitimate limitation for out-of-sample accuracy, but it is not circular: no equation reduces the output to the input, and the paper explicitly acknowledges the analogous model-data mismatch in the COR1 example (Section 3.2: 'the quantitative metrics provided in Fig. 9 should be interpreted as data-derived measures of the accuracy of the model run setup rather than performance benchmarks of the segmentation code'). Self-citations to Jones et al. (2016, 2017, 2020) and Uritsky (2022, 2024) provide context and code provenance rather than load-bearing uniqueness or ansatz arguments. No circular step meeting the quoted-reduction standard was found.
Assumptions & free parameters
free parameters (7)
- Coordinate transformation bins (dp, dr) =
dp = 1 deg, dr = 2 px for all image types (Table 2)
- Smoothing window sizes (sx, sp, sr) =
MAS: 12, 3, 15; COR1: 4, 3, 25; TSE: 2, 2, 10 (Table 2)
- Azimuthal differencing and detrending scales (ps, pd) =
ps = 2, pd = 5 phi-bins for all image types (Table 2)
- Threshold percentiles and counts (np, p1, p2) =
MAS: 20, 0.80, 0.99; COR1: 30, 0.60, 0.99; TSE: 20, 0.60, 0.99 (Table 2)
- Validation filter thresholds (w1, w2, l1, l2, vn, vi, vc) =
MAS/COR1: 2, 10, 10, 30, 10, 0.20, 0.005; TSE: 2, 10, 10, 60, 10, 0.02, 0.005 (Table 2)
- Polynomial interpolation order M =
Not stated in the paper
- Inner radial boundary r1 and radial range (r1, r2) =
r1 = 110 px (MAS, COR1), 190 px (TSE); r2 = 0 (unused), Table 2
assumptions (5)
- domain assumption Optical gradients in the corona are aligned with the local magnetic field because cross-field thermal conduction is strongly suppressed (perpendicular-to-parallel ratio ~1e-10 or smaller).
- domain assumption Open-field coronal regions are quasi-radial, so features with large deviation from radial direction can be discarded as closed loops.
- ad hoc to paper The unsigned second-order azimuthal derivative of the detrended polar image identifies the locations of quasi-radial structures.
- domain assumption The MAS thermodynamic MHD simulation with WTD heating and a photospheric boundary map produces synthetic white-light images whose density structure, projected and Thomson-scattered, is a valid proxy for the real corona in the open-flux regions.
- domain assumption The plane-of-sky projection of the model magnetic field is the correct reference direction for comparing features detected in line-of-sight integrated pB images.
Cite this review
Pith. "Pith review of The Quasi-Radial Field-line Tracing (QRaFT): an Adaptive Segmentation of the Open-Flux Solar Corona." pith.science (2026). https://pith.science/paper/RDYVLNKR
@misc{pith2026250614894,
  author       = {Pith},
  title        = {Pith review of: The Quasi-Radial Field-line Tracing (QRaFT): an Adaptive Segmentation of the Open-Flux Solar Corona},
  year         = {2026},
  howpublished = {\url{https://pith.science/paper/RDYVLNKR}},
  note         = {Machine review of arXiv:2506.14894}
}
abstract
Optical observations of solar corona provide key information on its magnetic geometry. The large-scale open field of the corona plays an important role in shaping the ambient solar wind and constraining the propagation dynamics of the embedded structures, such as interplanetary coronal mass ejections. Rigorous analysis of the open-flux coronal regions based on coronagraph images can be quite challenging because of the depleted plasma density resulting in low signal-to-noise ratios. In this paper, we present an in-depth description of a new image segmentation methodology, the Quasi-Radial Field-line Tracing (QRaFT), enabling a detection of field-aligned optical coronal features approximating the orientation of the steady-state open magnetic field. The methodology is tested using synthetic coronagraph images generated by a three-dimensional magnetohydrodynamic model. The results of the numerical tests indicate that the extracted optical features are aligned within $\sim 4-7$ degrees with the local magnetic field in the underlying numerical solution. We also demonstrate the performance of the method on real-life coronal images obtained from a space-borne coronagraph and a ground-based camera. We argue that QRaFT outputs contain valuable empirical information about the global steady-state morphology of the corona which could help improving the accuracy of coronal and solar wind models and space weather forecasts.
Figures


Figures from the paper (8 more)




Reference graph
Works this paper leans on
-
[1]
Altschuler, M. D., & Newkirk, Jr., G. 1969, SoPh, 9, 131, doi: 10.1007/BF00145734
-
[2]
2021, ApJ, 919, 98, doi: 10.3847/1538-4357/ac10ca
Alzate, N., Morgan, H., Viall, N., & Vourlidas, A. 2021, ApJ, 919, 98, doi: 10.3847/1538-4357/ac10ca
-
[3]
Arge, C. N., Hildner, E., Pizzo, V. J., & Harvey, J. W. 2002, Journal of Geophysical Research (Space Physics), 107, 1319, doi: 10.1029/2001JA000503
-
[4]
Henney, C. J. 2024, ApJ, 964, 115, doi: 10.3847/1538-4357/ad20e2
-
[5]
Arge, C. N., Luhmann, J. G., Odstrcil, D., Schrijver, C. J., & Li, Y. 2004, Journal of Atmospheric and Solar-Terrestrial Physics, 66, 1295, doi: 10.1016/j.jastp.2004.03.018
-
[6]
Arge, C. N., & Pizzo, V. J. 2000, J. Geophys. Res., 105, 10465, doi: 10.1029/1999JA000262
-
[7]
Aschwanden, M. J. 2010, SoPh, 262, 399, doi: 10.1007/s11207-010-9531-6
-
[8]
J., De Pontieu, B., & Katrukha, E
Aschwanden, M. J., De Pontieu, B., & Katrukha, E. A. 2013, Entropy, 15, 3007, doi: 10.3390/e15083007FILE:/proj/ads/abstracts/
work page doi:10.3390/e15083007file:/proj/ads/abstracts/ 2013
Show all 57 references
-
[9]
2008, SoPh, 248, 359, doi: 10.1007/s11207-007-9064-9
Inhester, B. 2008, SoPh, 248, 359, doi: 10.1007/s11207-007-9064-9
2008 doi
-
[10]
T., Bale, S
Badman, S. T., Bale, S. D., Rouillard, A. P., et al. 2021, A&A, 650, A18, doi: 10.1051/0004-6361/202039407
2021 doi
-
[11]
Beedle, J. M. H., Rura, C. E., Simpson, D. G., et al. 2022, Frontiers in Astronomy and Space Sciences, 8, 253, doi: 10.3389/fspas.2021.786308
2022
-
[12]
2020, ApJ, 904, 178, doi: 10.3847/1538-4357/abc482 —
Bemporad, A. 2020, ApJ, 904, 178, doi: 10.3847/1538-4357/abc482 —. 2023, ApJ, 946, 14, doi: 10.3847/1538-4357/acb8b8
2020 doi
-
[13]
2020, ApJ, 895, 123, doi: 10.3847/1538-4357/ab8ae6
Boe, B., Habbal, S., & Druckm¨ uller, M. 2020, ApJ, 895, 123, doi: 10.3847/1538-4357/ab8ae6
2020 doi
-
[14]
A., & Velli, M
Downs, C., Lionello, R., Miki´ c, Z., Linker, J. A., & Velli, M . 2016, ApJ, 832, 180, doi: 10.3847/0004-637X/832/2/180
2016 doi
-
[15]
2009, Pattern Recognition, 42, 2481, doi: 10.1016/j.patcog.2009.03.010
Durak, N., Nasraoui, O., & Schmelz, J. 2009, Pattern Recognition, 42, 2481, doi: 10.1016/j.patcog.2009.03.010
2009 doi
-
[16]
2016, Frontiers in Astronomy and Space Sciences, 3, 8, doi: 10.3389/fspas.2016.00008
Gibson, S., Kucera, T., White, S., et al. 2016, Frontiers in Astronomy and Space Sciences, 3, 8, doi: 10.3389/fspas.2016.00008
2016
-
[17]
A., Moses, J
Howard, R. A., Moses, J. D., Vourlidas, A., et al. 2008, SSRv, 136, 67, doi: 10.1007/s11214-008-9341-4
2008 doi
-
[18]
I., Davila, J
Jones, S. I., Davila, J. M., & Uritsky, V. 2016, ApJ, 820, 113, doi: 10.3847/0004-637X/820/2/113
2016 doi
-
[19]
I., Uritsky, V., & Davila, J
Jones, S. I., Uritsky, V., & Davila, J. M. 2017, ApJ, 844, 93, doi: 10.3847/1538-4357/aa7b7a
2017 doi
-
[20]
I., Uritsky, V
Jones, S. I., Uritsky, V. M., Davila, J. M., & Troyan, V. N. 2020, ApJ, 896, 57, doi: 10.3847/1538-4357/ab8cb9
2020 doi
-
[21]
I., Wang, T
Jones, S. I., Wang, T. J., Arge, C. N., et al. 2022, ApJ, 928, 131, doi: 10.3847/1538-4357/ac5751
2022 doi
-
[22]
L., Kucera, T
Kaiser, M. L., Kucera, T. A., Davila, J. M., et al. 2008, SSRv, 136, 5, doi: 10.1007/s11214-007-9277-0
2008 doi
-
[23]
Klimchuk, J. A. 2006, SoPh, 234, 41, doi: 10.1007/s11207-006-0055-z —. 2015, Philosophical Transactions of the Royal Society of London Series A, 373, 20140256, doi: 10.1098/rsta.2014.0256
2006
-
[24]
A., Knizhnik, K
Klimchuk, J. A., Knizhnik, K. J., & Uritsky, V. M. 2023, ApJ, 942, 10, doi: 10.3847/1538-4357/ac9f41
2023 doi
-
[25]
Garland, S. H. 2024, ApJL, 977, L29, doi: 10.3847/2041-8213/ad94dd
2024 doi
-
[26]
A., Caplan, R
Linker, J. A., Caplan, R. M., Downs, C., et al. 2017, ApJ, 848, 70, doi: 10.3847/1538-4357/aa8a70
2017 doi
-
[27]
A., Heinemann, S
Linker, J. A., Heinemann, S. G., Temmer, M., et al. 2021, ApJ, 918, 21, doi: 10.3847/1538-4357/ac090a
2021 doi
-
[28]
A., & Miki´ c, Z
Lionello, R., Linker, J. A., & Miki´ c, Z. 2009, ApJ, 690, 902, doi: 10.1088/0004-637X/690/1/902
2009 doi
-
[29]
2014, ApJ, 784, 120, doi: 10.1088/0004-637X/784/2/120
Lionello, R., Velli, M., Downs, C., et al. 2014, ApJ, 784, 120, doi: 10.1088/0004-637X/784/2/120
2014 doi
-
[30]
Wheatland, M. S. 2014, ApJ, 783, 102, doi: 10.1088/0004-637X/783/2/102
2014 doi
-
[31]
L., MacNeice, P
Mays, M. L., MacNeice, P. J., Taktakishvili, A., et al. 2020, NASA/NOAA MOU Annex Final Report: Evaluating Model Advancements for Predicting CME Arrival Time. https://ccmc.gsfc.nasa.gov/static/files/CCMC SWPC annex final report.p
2020
-
[32]
Henney, C. J. 2016, Journal of Geophysical Research (Space Physics), 121, 2866, doi: 10.1002/2015JA022200 Miki´ c, Z., Linker, J. A., Schnack, D. D., Lionello, R., &
2016 doi
-
[33]
1999, Physics of Plasmas, 6, 2217, doi: 10.1063/1.873474 Miki´ c, Z., Downs, C., Linker, J
Tarditi, A. 1999, Physics of Plasmas, 6, 2217, doi: 10.1063/1.873474 Miki´ c, Z., Downs, C., Linker, J. A., et al. 2018, Nature Astronomy, 2, 913, doi: 10.1038/s41550-018-0562-5 Moraes Filho, V. P., Uritsky, V. M., Thompson, B. J.,
1999 doi
-
[34]
E., & DeForest, C
Gibson, S. E., & DeForest, C. E. 2024, ApJ, 975, 294, doi: 10.3847/1538-4357/ad7a77
2024 doi
-
[35]
2022, A&A, 663, A96, doi: 10.1051/0004-6361/202243439
Navarro, A., Khomenko, E., Modestov, M., & Vitas, N. 2022, A&A, 663, A96, doi: 10.1051/0004-6361/202243439
2022 doi
-
[36]
2023, Frontiers in Astronomy and Space Sciences, 10, 1226992, doi: 10.3389/fspas.2023.1226992
Odstrcil, D. 2023, Frontiers in Astronomy and Space Sciences, 10, 1226992, doi: 10.3389/fspas.2023.1226992
2023
-
[37]
J., & Arge, C
Odstrcil, D., Pizzo, V. J., & Arge, C. N. 2005, Journal of Geophysical Research (Space Physics), 110, A02106, doi: 10.1029/2004JA010745 18
2005 doi
-
[38]
Odstrcil, D., Riley, P., & Zhao, X. P. 2004, Journal of Geophysical Research (Space Physics), 109, A02116, doi: 10.1029/2003JA010135
2004 doi
-
[39]
N., Staub, J., et al
Posner, A., Arge, C. N., Staub, J., et al. 2021, Space Weather, 19, e02777, doi: 10.1029/2021SW002777
2021 doi
-
[40]
G., Vourlidas, A., et al
Provornikova, E., Merkin, V. G., Vourlidas, A., et al. 2024, ApJ, 977, 106, doi: 10.3847/1538-4357/ad83b1
2024 doi
-
[41]
I., Zaitseva, S
Pudovkin, M. I., Zaitseva, S. A., & Benevolenska, E. E. 1979, J. Geophys. Res., 84, 6649, doi: 10.1029/JA084iA11p06649
1979 doi
-
[42]
A., Mikic, Z., et al
Riley, P., Linker, J. A., Mikic, Z., et al. 2019, ApJ, 884, 18, doi: 10.3847/1538-4357/ab3a98
2019 doi
-
[43]
E., Uritsky, V
Rura, C. E., Uritsky, V. M., Jones, S. I., et al. 2025, ApJ (under review)
2025
-
[44]
Schatten, K. H. 1971, Cosmic Electrodynamics, 2, 232
1971
-
[45]
H., Schou, J., Bush, R
Scherrer, P. H., Schou, J., Bush, R. I., et al. 2012, SoPh, 275, 207, doi: 10.1007/s11207-011-9834-2
2012 doi
-
[46]
K., Inhester, B., & Sch¨ ussler, M
Solanki, S. K., Inhester, B., & Sch¨ ussler, M. 2006, Reports on Progress in Physics, 69, 563, doi: 10.1088/0034-4885/69/3/R02
2006 doi
-
[47]
Uritsky, V. M. 2022, QRaFT package: v2.0, v2.0, Zenodo, doi: 10.5281/zenodo.7410948 —. 2024, QRaFT package: v3.0. https://github.com/uritsky/QRaFT
2022 doi
-
[48]
M., Davila, J
Uritsky, V. M., Davila, J. M., Ofman, L., & Coyner, A. J. 2013, ApJ, 769, 62, doi: 10.1088/0004-637X/769/1/62
2013 doi
-
[49]
M., & Klimchuk, J
Uritsky, V. M., & Klimchuk, J. A. 2024, ApJ, 961, 222, doi: 10.3847/1538-4357/ad0c53
2024 doi
-
[50]
M., Thompson, B
Uritsky, V. M., Thompson, B. J., & DeVore, C. R. 2022, ApJ, 935, 47, doi: 10.3847/1538-4357/ac74b4 van Hoven, G., & Mok, Y. 1984, ApJ, 282, 267, doi: 10.1086/162199
2022 doi
-
[51]
N., Pattichis, M., Hock-Mysliwiec, R
Wallace, S., Arge, C. N., Pattichis, M., Hock-Mysliwiec, R. A., & Henney, C. J. 2019, SoPh, 294, 19, doi: 10.1007/s11207-019-1402-1
2019 doi
-
[52]
N., Viall, N., & Pihlstr¨ om, Y
Wallace, S., Arge, C. N., Viall, N., & Pihlstr¨ om, Y. 2020, ApJ, 898, 78, doi: 10.3847/1538-4357/ab98a0
2020 doi
-
[53]
M., & Sheeley, Jr., N
Wang, Y. M., & Sheeley, Jr., N. R. 1990, ApJ, 355, 726, doi: 10.1086/168805 —. 1992, ApJ, 392, 310, doi: 10.1086/171430
1990 doi
-
[54]
M., Ulrich, R
Wang, Y. M., Ulrich, R. K., & Harvey, J. W. 2022, ApJ, 926, 113, doi: 10.3847/1538-4357/ac4491
2022 doi
-
[55]
2020, Astronomy and Computing, 30, 100341, doi: 10.1016/j.ascom.2019.100341
Ye, J., Shen, C., Lin, J., & Mei, Z. 2020, Astronomy and Computing, 30, 100341, doi: 10.1016/j.ascom.2019.100341
2020
-
[56]
R., Amari, T., Contopoulos, I., et al
Yeates, A. R., Amari, T., Contopoulos, I., et al. 2018, SSRv, 214, 99, doi: 10.1007/s11214-018-0534-1
2018 doi
-
[57]
H., & Richardson, I
Zurbuchen, T. H., & Richardson, I. G. 2006, SSRv, 123, 31, doi: 10.1007/s11214-006-9010-4 19 APPENDIX Table 1. Main subroutines of the QRaFT package Name Purpose Equations (4) (5) (6) QRaFT Top-level subroutine implementing all processing steps 1 - 31 read const string Reads a...
2006 doi
Reviewed August 7, 2026 · model on record in the stance chip above.
Discussion (0). Continue with ORCID to comment.