REVIEW 2 major objections 5 minor 94 references
First separate top and anti-top differential spectra at 13 TeV, measured out to 500 GeV, match QCD and tighten a four-quark new-physics bound to ±0.12 TeV⁻².
Reviewed by Pith at T0; open to challenge. T0 means a machine referee read the full paper against a public rubric. the ladder, T0–T4 →
T0 review · deepseek-v4-flash
2026-08-03 11:49 UTC pith:RVWFXIOY
load-bearing objection Solid first separate tq/tbarq differential measurement at 13 TeV; EFT constraint is plausible but under-systematised. the 2 major comments →
Measurement of differential t-channel single top (anti)quark production cross-sections at 13 TeV with the ATLAS detector
The pith
A machine-rendered reading of the paper's core claim, the machinery that carries it, and where it could break.
Core claim
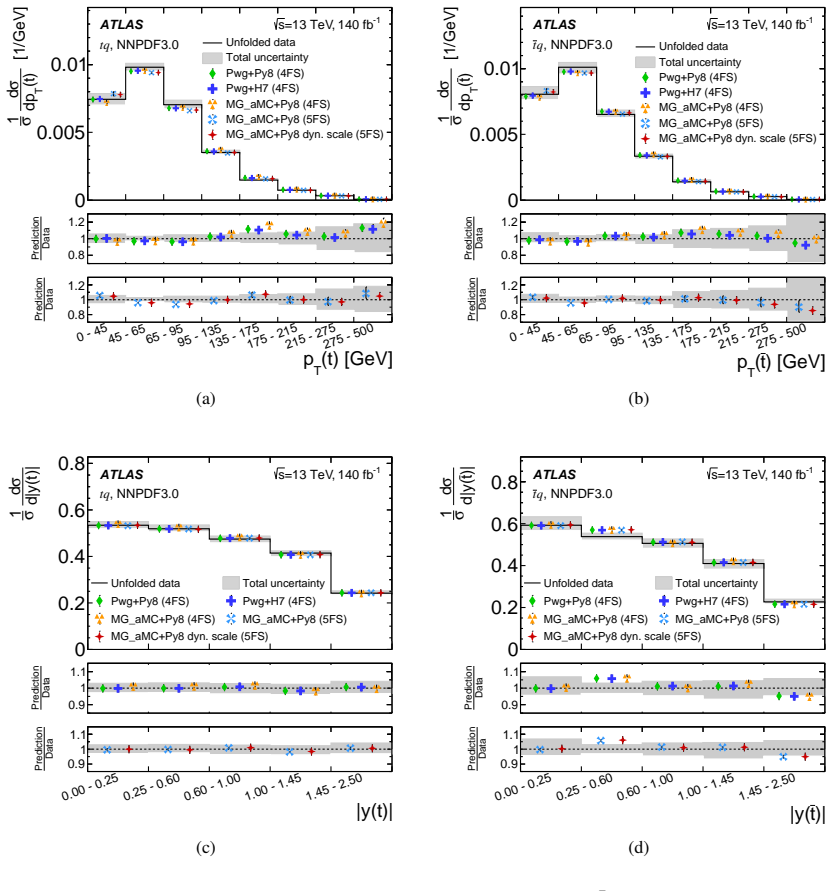
The central result is the first separate differential measurement of tq and t̄q production at 13 TeV. Events with one isolated lepton, large missing transverse momentum, and exactly two jets (one b-tagged) are selected, backgrounds are suppressed by a neural network, and the pT and |y| distributions are unfolded to parton level with iterative Bayesian unfolding, using migration matrices and efficiencies from the nominal four-flavour-scheme Powheg+Pythia8 signal simulation, including a shadow bin to 2000 GeV. The absolute and normalised cross sections and their ratio agree with NLO predictions from several generator/shower combinations and with NNLO fixed-order calculations. For the EFT inter
What carries the argument
The carrying mechanism is the unfolding chain that converts detector-level spectra into parton-level cross sections: an iterative Bayesian unfolding implemented with the RooUnfold package, inverting the relation N_data = M·ε·σ·L + background without direct matrix inversion, where M_jk (the migration matrix) gives the probability that an event produced in parton-level bin k is reconstructed in bin j and ε_k is the selection efficiency; both are computed from the nominal Powheg+Pythia8 four-flavour-scheme signal sample. The EFT interpretation reuses this same machinery: the expected fractional change of each bin under a new-physics operator is parameterised as Δσ̃(C) = 1 + a1·C + a2·C² with Λ
Load-bearing premise
The load-bearing premise is that the simulated signal sample — which provides the bin-to-bin migration and selection-efficiency corrections used for both the data and the new-physics templates — describes the true kinematics of high-pT events closely enough, with agreement validated only by sub-2% closure tests, so that if the real signal kinematics differ from the simulation the measured spectra and the ±0.12 TeV⁻² interval would shift.
What would settle it
Recompute the unfolded pT spectra and the EFT fit using Wilson-coefficient-dependent unfolding — e.g., unfolding each of the five EFT samples with its own migration matrix and efficiency, or adding an acceptance nuisance parameter that varies with C/Λ² — and compare the resulting 95% CL interval with −0.12 < C < 0.12 TeV⁻²; a shift larger than the quoted uncertainty shows the nominal, coefficient-independent corrections are the limiting step. As a second check, generate high-pT pseudo-data with an alternative parton shower and unfold with the nominal corrections to test the sub-2% closure abov
If this is right
- The separate tq and t̄q pT spectra now extend to 500 GeV, roughly doubling the kinematic reach of previous 13 TeV differential measurements, and the normalised |y| shapes reach 3–6% precision (versus 7–15% at 8 TeV).
- Because the tq/t̄q ratio cancels most systematic uncertainties, the measured ratio as a function of pT and |y| is a more discriminating test of PDF sets than the individual spectra — the data visibly disfavour the ABMP16 prediction for the |y| ratio while the other predictions agree.
- If the EFT interpretation's acceptance treatment is correct, the interval −0.12 < C_Qq^{3,1}/Λ² < 0.12 TeV⁻² improves the bound from the inclusive single-top cross-section measurement, with the high-pT bins (175–500 GeV) carrying most of the sensitivity and the quadratic term in the parameterisation growing rapidly in those bins.
- The agreement of NNLO predictions with the measured pT shapes, where LO fails as expected, provides a benchmark for using single-top events to constrain proton PDFs, specifically the u/d ratio and, in future, the b-quark density.
Where Pith is reading between the lines
- My inference: the paper's EFT method — unfolding every Wilson-coefficient sample with the nominal migration matrix and efficiency — is a workable compromise only if the operator's shape distortion is modest at the fitted values; a straightforward stress test is to repeat the fit with a coefficient-dependent response matrix, or to profile over the acceptance uncertainty, and check whether the ±0.12
- My inference: since the tq/t̄q ratio is nearly free of detector and rate systematics (most cancel in the ratio), a global PDF fit that includes these five-bin normalised |y| shapes would sharpen the u/d determination at intermediate x — an extension the paper flags as a motivation but does not itself carry out.
- My inference: the measured pT extension to 500 GeV is exactly the region where four-quark operators grow fastest, so combining this single-top spectrum with the top-pair pT spectrum in a joint SMEFT fit could separate C_Qq^{3,1} from the operators O_phiQ³ and O_tW, which the paper deliberately sets to zero — a next step made possible by the published per-bin parameterisations.
- My inference: the shadow-bin technique (an upper edge at 2000 GeV whose content is not measured but absorbs migration) is a reusable prescription for other inclusive measurements reaching the edge of their kinematic range; it keeps the highest measured bin unbiased at the cost of not reporting cross sections above 500 GeV.
Editorial analysis
A structured set of objections, weighed in public.
Referee Report
Summary. The paper reports ATLAS measurements of differential t-channel single top quark and top antiquark production at 13 TeV using the full Run 2 data set (140 fb^-1). Absolute and normalized cross sections are measured as functions of pT and |y| for tq and tbarq separately, together with their ratio. The unfolding uses iterative Bayesian unfolding with corrections from the nominal Powheg+Pythia8 4FS signal sample. The results are compared with NLO MC generators, different PDF sets, and NNLO MCFM predictions. The paper also presents an EFT interpretation constraining the Wilson coefficient C_Qq^{3,1}/Lambda^2, claiming a 95% CL interval of [-0.12, 0.12] TeV^-2 and noting that this is the first separate differential measurement of tq and tbarq at 13 TeV, with pT coverage extended to 500 GeV.
Significance. If the measurement is correct, it provides a valuable precision result: the first separate differential tq/tbarq cross sections at 13 TeV, an extended pT range, a new charge-ratio measurement, and a competitive EFT constraint. The paper is careful in its unfolding validation (non-closure below 2%), provides detailed systematic uncertainty tables, and gives chi^2 probabilities for many theory predictions. The EFT interpretation is the least secure part: the response function is derived from a single MadGraph 5FS model with no systematic assigned for generator, scale, or PDF choices in the EFT template, despite the large acceptance effect and the large signal-modelling uncertainties in high-pT bins. This gap should be addressed before the EFT constraint is considered final.
major comments (2)
- [§9.1, Eq. (1)] The EFT response parameters a1 and a2 are determined from MadGraph5_aMC@NLO 5FS samples unfolded with the nominal Powheg 4FS migration matrix and efficiency, and the least-squares fit includes only MC statistical uncertainties. No systematic uncertainty is assigned for the generator choice (5FS vs 4FS), for renormalization/factorization scale or PDF variations in the EFT generation, or for the assumption that the C-dependent acceptance (Figure 14) is correctly modeled. The high-pT bins carry 12–24% signal-modelling uncertainties (Tables 6–11) that are not propagated into the EFT template. Because the acceptance effect is large, this could shift the quoted 95% CL interval [-0.12, 0.12] TeV^-2 by a substantial fraction of its width. Please add a systematic uncertainty on the EFT response (or validate it with an alternative generator/4FS EFT sample) and quantify the impact on the interval.
- [§7, §9.1] The non-closure test in Section 7 alters signal shapes according to the difference between expected and observed distributions, not according to the large EFT-induced distortions. Since the EFT samples are unfolded with the nominal C=0 migration matrix and efficiency, a dedicated closure test for EFT-like templates (e.g., unfolding the C!=0 MadGraph samples with the nominal response and comparing with truth) is needed to rule out a bias in the extracted a1, a2 parameterization. The current validation is insufficient to support the claim that the EFT acceptance effect is correctly accounted for.
minor comments (5)
- [§9.1] The sentence 'The correlation of the total uncertainty in the measurement result between bins is not considered for the least-squares fit' is confusing, since the a1, a2 fit is to EFT MC predictions, not to data. Please clarify that the data covariance is used only in the final EFTfitter step, not in the response-function fit.
- [Tables 4, 5] Several chi^2 probabilities are reported as exactly 1.0 (e.g., ratio pT rows). Consider giving more significant digits or adding a note explaining that large systematic correlations lead to high p-values.
- [Tables 20, 21 captions] Typo: 'fuction' should be 'function' in both captions.
- [Figure 15 caption] The dashed line description is ambiguous: 'the measurement result over the theoretical prediction calculated with MCFM at NNLO' should specify exactly which ratio is plotted (e.g., unfolded data divided by MCFM NNLO per bin).
- [Section 3] Typo: 'pertubation' should be 'perturbation'; please check for similar typos throughout the text.
Circularity Check
No significant circularity: data enter only as observables; EFT response is fitted to MC, not to data; self-citation is methodological.
full rationale
The differential measurement is obtained from data counts via the unfolding equation in Section 6, N_data_j = sum_k M_jk * eps_k * L * DeltaX_k * d(sigma)_k/dX + B_j, with M and eps derived from the nominal Powheg 4FS sample. The data enter as observed yields, not as the MC prediction, and the closure test against perturbed signal shapes is below 2% (Section 7), so agreement with Powheg or MCFM is not forced by construction. The EFT interpretation fits a1 and a2 in Eq. (1) to EFT MC samples only, using the measured unfolded spectra once in EFTfitter; no parameter fitted to the data is later renamed a prediction. The acceptance effect is explicitly modeled (Figure 14) and is therefore an assumption, not a tautology. The heavy reliance on Ref. [9] for event selection, the neural network, and the uncertainty scheme is methodological reuse by the same collaboration; the differential cross-sections and the EFT interval are new results not entailed by the inclusive measurement of [9]. The skeptic's concern about missing 4FS/5FS, scale, or generator systematics in the EFT response is a legitimate robustness limitation, but it is not circular reasoning: the response is an independent MC-derived template that could disagree with the data, and the paper does not define its prediction as the data.
Axiom & Free-Parameter Ledger
free parameters (4)
- Background normalization scale factors (per process, per lepton charge) =
Post-fit yields in Table 3 (e.g., tq 29740±590, tbarq 15550±300)
- EFT response coefficients a1, a2 (per pT bin for tq and tbarq) =
Table 22, e.g. a1=-2.452, a2=1.694 in the 275–500 GeV tq bin
- Unfolding iteration count =
4
- Event-selection thresholds =
Lepton pT>28 GeV, jet pT>30 GeV, NN output Dnn>0.93, m(lb)<160 GeV
axioms (5)
- standard math D'Agostini iterative Bayesian unfolding with four iterations converges to the true distribution.
- domain assumption The nominal Powheg+Pythia8 4FS sample correctly describes the parton-level signal kinematics after unfolding.
- domain assumption SMEFT truncation at dimension six with only O_Qq^{3,1} active; O_phiQ^3 and O_tW are set to zero.
- domain assumption Backgrounds from ttbar, Wt, s-channel, W/Z+jets, diboson, and multijet are correctly modelled or normalised by the profile fit.
- domain assumption ATLAS detector simulation and calibration (JES, JER, b-tagging, lepton efficiencies) provide unbiased corrections.
read the original abstract
The production of single top quarks and top antiquarks via the $t$-channel exchange of a virtual $W$ boson is measured in proton-proton collisions at a centre-of-mass energy of 13 TeV at the Large Hadron Collider. The full Run 2 data sample recorded with the ATLAS detector in the years 2015-2018 is used, corresponding to an integrated luminosity of 140 fb$^{-1}$. The absolute and normalised production cross-sections are measured differentially as a function of the transverse momentum and absolute rapidity of the top quark and top antiquark. In addition, the ratio of top quark to top antiquark production cross-sections is measured. The measured distributions are compared with next-to-leading-order quantum chromodynamics predictions obtained with different combinations of matrix-element generators, parton-shower programs and proton parton distribution functions, as well as to next-to-next-to-leading-order calculations. Overall, good agreement is observed between the measurements and the theoretical predictions. For most measured distributions, the sensitivity to differences between the predictions is limited by the systematic uncertainties in the measurement. The measured differential distributions are also interpreted in an effective field theory approach to constrain the Wilson-Coefficient $C_{Qq}^{3,1}$ associated with a four-quark operator. The interpretation accounts for the effect of the selection efficiency, which is altered significantly by non-zero contributions from $C_{Qq}^{3,1}$.
Figures




Reference graph
Works this paper leans on
-
[1]
D0 Collaboration,Observation of Single Top-Quark Production, Phys. Rev. Lett.103(2009) 092001, arXiv:0903.0850
Pith/arXiv arXiv 2009
-
[2]
CDF Collaboration,Observation of Electroweak Single Top-Quark Production, Phys. Rev. Lett.103(2009) 092002, arXiv:0903.0885
Pith/arXiv arXiv 2009
-
[3]
A. Giammanco and R. Schwienhorst,Single top-quark production at the Tevatron and the LHC, Rev. Mod. Phys.90(2018) 035001, arXiv:1710.10699
Pith/arXiv arXiv 2018
-
[4]
ATLAS Collaboration,Measurement of𝑡-channel single-top-quark production in𝑝𝑝collisions at√𝑠=5.02TeV with the ATLAS detector, Phys. Lett. B854(2024) 138726, arXiv:2310.01518 [hep-ex]
arXiv 2024
-
[5]
ATLAS Collaboration,Comprehensive measurements of𝑡-channel single top-quark production cross sections at√𝑠=7TeV with the ATLAS detector, Phys. Rev. D90(2014) 112006, arXiv:1406.7844 [hep-ex]
Pith/arXiv arXiv 2014
-
[6]
CMS Collaboration, Measurement of the single-top-quark𝑡-channel cross section in𝑝𝑝collisions at√𝑠=7TeV, JHEP12(2012) 035, arXiv:1209.4533 [hep-ex]
Pith/arXiv arXiv 2012
-
[7]
ATLAS Collaboration,Fiducial, total and differential cross-section measurements of𝑡-channel single top-quark production in𝑝𝑝collisions at8TeV using data collected by the ATLAS detector, Eur. Phys. J. C77(2017) 531, arXiv:1702.02859 [hep-ex]
Pith/arXiv arXiv 2017
-
[8]
CMS Collaboration,Measurement of the𝑡-channel single-top-quark production cross section and of the|𝑉𝑡𝑏|CKM matrix element in𝑝𝑝collisions at√𝑠=8TeV, JHEP06(2014) 090, arXiv:1403.7366 [hep-ex]
Pith/arXiv arXiv 2014
-
[9]
ATLAS Collaboration,Measurement of𝑡-channel production of single top quarks and antiquarks in 𝑝𝑝collisions at13TeV using the full ATLAS Run 2 data sample, JHEP05(2024) 305, arXiv:2403.02126 [hep-ex], Erratum: JHEP06(2025) 024
Pith/arXiv arXiv 2024
-
[10]
CMS Collaboration,Measurement of the single top quark and antiquark production cross sections in the𝑡channel and their ratio in proton–proton collisions at√𝑠=13TeV, Phys. Lett. B800(2020) 135042, arXiv:1812.10514 [hep-ex]
Pith/arXiv arXiv 2020
-
[11]
CMS Collaboration,Measurement of differential cross sections and charge ratios for𝑡-channel single top quark production in proton–proton collisions at√𝑠=13TeV, Eur. Phys. J. C80(2020) 370, arXiv:1907.08330 [hep-ex]
Pith/arXiv arXiv 2020
-
[12]
D’Agostini,A multidimensional unfolding method based on Bayes’ theorem, Nucl
G. D’Agostini,A multidimensional unfolding method based on Bayes’ theorem, Nucl. Instrum. Meth. A362(1995) 487
1995
-
[13]
J. Campbell and T. Neumann,Precision Phenomenology with MCFM, JHEP12(2019) 034, arXiv:1909.09117 [hep-ph]
Pith/arXiv arXiv 2019
-
[14]
E. R. Nocera, M. Ubiali and C. Voisey,Single top production in PDF fits, JHEP2020(2020) 67, arXiv:1912.09543
Pith/arXiv arXiv 2020
-
[15]
N. P. Hartland et al., A Monte Carlo global analysis of the Standard Model Effective Field Theory: the top quark sector, JHEP2019(2019) 100, arXiv:1901.05965
Pith/arXiv arXiv 2019
-
[16]
Degrande et al.,Automated one-loop computations in the standard model effective field theory, Phys
C. Degrande et al.,Automated one-loop computations in the standard model effective field theory, Phys. Rev. D103(2021) 096024, arXiv:2008.11743 [hep-ph]. 42
Pith/arXiv arXiv 2021
-
[17]
M. de Beurs, E. Laenen, M. Vreeswijk and E. Vryonidou, Effective operators in𝑡-channel single top production and decay, Eur. Phys. J. C78(2018) 919, arXiv:1807.03576 [hep-ph]
Pith/arXiv arXiv 2018
-
[18]
ATLAS Collaboration,The ATLAS Experiment at the CERN Large Hadron Collider, JINST3(2008) S08003
2008
-
[19]
Avoni et al.,The new LUCID-2 detector for luminosity measurement and monitoring in ATLAS, JINST13(2018) P07017
G. Avoni et al.,The new LUCID-2 detector for luminosity measurement and monitoring in ATLAS, JINST13(2018) P07017
2018
-
[20]
ATLAS Collaboration,Performance of the ATLAS trigger system in 2015, Eur. Phys. J. C77(2017) 317, arXiv:1611.09661 [hep-ex]
Pith/arXiv arXiv 2015
-
[21]
ATLAS Collaboration,Software and computing for Run 3 of the ATLAS experiment at the LHC, Eur. Phys. J. C85(2025) 234, arXiv:2404.06335 [hep-ex], Erratum: Eur. Phys. J. C85(2025) 907
Pith/arXiv arXiv 2025
-
[22]
ATLAS Collaboration,ATLAS data quality operations and performance for 2015–2018 data-taking, JINST15(2020) P04003, arXiv:1911.04632 [physics.ins-det]
Pith/arXiv arXiv 2015
-
[23]
ATLAS Collaboration, Luminosity determination in𝑝𝑝collisions at√𝑠=13TeV using the ATLAS detector at the LHC, Eur. Phys. J. C83(2023) 982, arXiv:2212.09379 [hep-ex]
Pith/arXiv arXiv 2023
-
[24]
ATLAS Collaboration,Performance of electron and photon triggers in ATLAS during LHC Run 2, Eur. Phys. J. C80(2020) 47, arXiv:1909.00761 [hep-ex]
Pith/arXiv arXiv 2020
-
[25]
ATLAS Collaboration,Performance of the ATLAS muon triggers in Run 2, JINST15(2020) P09015, arXiv:2004.13447 [physics.ins-det]
Pith/arXiv arXiv 2020
-
[26]
Agostinelli et al.,Geant4– a simulation toolkit, Nucl
S. Agostinelli et al.,Geant4– a simulation toolkit, Nucl. Instrum. Meth. A506(2003) 250
2003
-
[27]
ATLAS Collaboration,The ATLAS Simulation Infrastructure, Eur. Phys. J. C70(2010) 823, arXiv:1005.4568 [physics.ins-det]
Pith/arXiv arXiv 2010
-
[28]
ATLAS Collaboration, The simulation principle and performance of the ATLAS fast calorimeter simulation FastCaloSim, ATL-PHYS-PUB-2010-013, 2010,url:https://cds.cern.ch/record/1300517
arXiv 2010
-
[29]
Lukas,Fast Simulation for ATLAS: Atlfast-II and ISF, J
W. Lukas,Fast Simulation for ATLAS: Atlfast-II and ISF, J. Phys.: Conf. Ser.396(2012) 022031
2012
-
[30]
P. Nason,A new method for combining NLO QCD with shower Monte Carlo algorithms, JHEP11(2004) 040, arXiv:hep-ph/0409146
Pith/arXiv arXiv 2004
-
[31]
S. Frixione, G. Ridolfi and P. Nason, A positive-weight next-to-leading-order Monte Carlo for heavy flavour hadroproduction, JHEP09(2007) 126, arXiv:0707.3088 [hep-ph]
Pith/arXiv arXiv 2007
-
[32]
S. Frixione, P. Nason and C. Oleari, Matching NLO QCD computations with parton shower simulations: the POWHEG method, JHEP11(2007) 070, arXiv:0709.2092 [hep-ph]
Pith/arXiv arXiv 2007
-
[33]
S. Alioli, P. Nason, C. Oleari and E. Re, NLO single-top production matched with shower in POWHEG:𝑠- and𝑡-channel contributions, JHEP09(2009) 111, arXiv:0907.4076 [hep-ph], Erratum: JHEP02(2010) 011
Pith/arXiv arXiv 2009
-
[34]
S. Alioli, P. Nason, C. Oleari and E. Re,A general framework for implementing NLO calculations in shower Monte Carlo programs: the POWHEG BOX, JHEP06(2010) 043, arXiv:1002.2581 [hep-ph]. 43
Pith/arXiv arXiv 2010
-
[35]
Re,Single-top𝑊𝑡-channel production matched with parton showers using the POWHEG method, Eur
E. Re,Single-top𝑊𝑡-channel production matched with parton showers using the POWHEG method, Eur. Phys. J. C71(2011) 1547, arXiv:1009.2450 [hep-ph]
Pith/arXiv arXiv 2011
-
[36]
R. Frederix, E. Re and P. Torrielli, Single-top𝑡-channel hadroproduction in the four-flavour scheme with POWHEG and aMC@NLO, JHEP09(2012) 130, arXiv:1207.5391 [hep-ph]
Pith/arXiv arXiv 2012
-
[37]
NNPDF Collaboration, R. D. Ball et al.,Parton distributions for the LHC run II, JHEP04(2015) 040, arXiv:1410.8849 [hep-ph]
Pith/arXiv arXiv 2015
-
[38]
T. Sjöstrand, S. Mrenna and P. Skands,A brief introduction to PYTHIA 8.1, Comput. Phys. Commun.178(2008) 852, arXiv:0710.3820 [hep-ph]
Pith/arXiv arXiv 2008
-
[39]
ATLAS Collaboration,ATLAS Pythia 8 tunes to7TeV data, ATL-PHYS-PUB-2014-021, 2014, url:https://cds.cern.ch/record/1966419
arXiv 2014
-
[40]
NNPDF Collaboration, R. D. Ball et al.,Parton distributions with LHC data, Nucl. Phys. B867(2013) 244, arXiv:1207.1303 [hep-ph]
Pith/arXiv arXiv 2013
-
[41]
S. Frixione, E. Laenen, P. Motylinski, C. White and B. R. Webber, Single-top hadroproduction in association with a𝑊boson, JHEP07(2008) 029, arXiv:0805.3067 [hep-ph]
Pith/arXiv arXiv 2008
-
[42]
ATLAS Collaboration,Studies on top-quark Monte Carlo modelling for Top2016, ATL-PHYS-PUB-2016-020, 2016,url:https://cds.cern.ch/record/2216168
arXiv 2016
-
[43]
D. J. Lange,The EvtGen particle decay simulation package, Nucl. Instrum. Meth. A462(2001) 152
2001
-
[44]
E. Bothmann et al.,Event generation with Sherpa 2.2, SciPost Phys.7(2019) 034, arXiv:1905.09127 [hep-ph]
Pith/arXiv arXiv 2019
-
[45]
S. Schumann and F. Krauss, A parton shower algorithm based on Catani–Seymour dipole factorisation, JHEP03(2008) 038, arXiv:0709.1027 [hep-ph]
Pith/arXiv arXiv 2008
-
[46]
J.-C. Winter, F. Krauss and G. Soff,A modified cluster-hadronisation model, Eur. Phys. J. C36(2004) 381, arXiv:hep-ph/0311085
Pith/arXiv arXiv 2004
-
[47]
C. Anastasiou, L. Dixon, K. Melnikov and F. Petriello,High-precision QCD at hadron colliders: Electroweak gauge boson rapidity distributions at next-to-next-to leading order, Phys. Rev. D69(2004) 094008, arXiv:hep-ph/0312266
Pith/arXiv arXiv 2004
-
[48]
R. Gavin, Y. Li, F. Petriello and S. Quackenbush, FEWZ 2.0: A code for hadronic𝑍production at next-to-next-to-leading order, Comput. Phys. Commun.182(2011) 2388, arXiv:1011.3540 [hep-ph]
Pith/arXiv arXiv 2011
-
[49]
S. Quackenbush, R. Gavin, Y. Li and F. Petriello,W physics at the LHC with FEWZ 2.1, Comput. Phys. Commun.184(2013) 209, arXiv:1201.5896
Pith/arXiv arXiv 2013
-
[50]
J. Campbell, T. Neumann and Z. Sullivan,Single-top-quark production in the𝑡-channel at NNLO, JHEP02(2021) 040, arXiv:2012.01574 [hep-ph]
Pith/arXiv arXiv 2021
-
[51]
J. Campbell, T. Neumann and Z. Sullivan, Testing parton distribution functions with t-channel single-top-quark production, Phys. Rev. D104(2021) 094042, arXiv:2109.10448 [hep-ph]. 44
Pith/arXiv arXiv 2021
-
[52]
ATLAS and CMS Collaborations, Reference Single Top-Quark Cross-Sections for ATLAS and CMS Analyses, ATL-PHYS-PUB-2025-035, 2025,url:https://cds.cern.ch/record/2942746
arXiv 2025
-
[53]
J. Alwall et al.,The automated computation of tree-level and next-to-leading order differential cross sections, and their matching to parton shower simulations, JHEP07(2014) 079, arXiv:1405.0301 [hep-ph]
Pith/arXiv arXiv 2014
-
[54]
Bähr et al.,Herwig++ physics and manual, Eur
M. Bähr et al.,Herwig++ physics and manual, Eur. Phys. J. C58(2008) 639, arXiv:0803.0883 [hep-ph]
Pith/arXiv arXiv 2008
-
[55]
Bellm et al.,Herwig 7.0/Herwig++ 3.0 release note, Eur
J. Bellm et al.,Herwig 7.0/Herwig++ 3.0 release note, Eur. Phys. J. C76(2016) 196, arXiv:1512.01178 [hep-ph]
Pith/arXiv arXiv 2016
-
[56]
S. Alekhin, J. Blümlein, S. Moch and R. Plačakyt˙e, Parton distribution functions,𝛼𝑠, and heavy-quark masses for LHC Run II, Phys. Rev. D96(2017) 014011, arXiv:1701.05838 [hep-ph]
Pith/arXiv arXiv 2017
-
[57]
Hou et al.,Progress in the CTEQ-TEA NNLO global QCD analysis, (2019), arXiv:1908.11394 [hep-ph]
T.-J. Hou et al.,Progress in the CTEQ-TEA NNLO global QCD analysis, (2019), arXiv:1908.11394 [hep-ph]
Pith/arXiv arXiv 2019
-
[58]
S. Bailey, T. Cridge, L. A. Harland-Lang, A. D. Martin and R. S. Thorne, Parton distributions from LHC, HERA, Tevatron and fixed target data: MSHT20 PDFs, Eur. Phys. J. C81(2021) 341, arXiv:2012.04684 [hep-ph]
Pith/arXiv arXiv 2021
-
[59]
R. D. Ball et al.,Parton distributions from high-precision collider data, Eur. Phys. J. C77(2017) 663, arXiv:1706.00428 [hep-ph]
Pith/arXiv arXiv 2017
-
[60]
NNPDF Collaboration, R. D. Ball et al.,The path to proton structure at 1% accuracy, Eur. Phys. J. C82(2022) 428, arXiv:2109.02653 [hep-ph]
Pith/arXiv arXiv 2022
-
[61]
H1 and ZEUS Collaborations,Combination of measurements of inclusive deep inelastic𝑒±𝑝 scattering cross sections and QCD analysis of HERA data, Eur. Phys. J. C75(2015) 580, arXiv:1506.06042 [hep-ex]
Pith/arXiv arXiv 2015
-
[62]
ATLAS Collaboration,Precision measurement and interpretation of inclusive𝑊+,𝑊− and𝑍/𝛾 ∗ production cross sections with the ATLAS detector, Eur. Phys. J. C77(2017) 367, arXiv:1612.03016 [hep-ex]
Pith/arXiv arXiv 2017
-
[63]
ATLAS Collaboration,Determination of the parton distribution functions of the proton using diverse ATLAS data from𝑝𝑝collisions at√𝑠=7,8and13TeV, Eur. Phys. J. C82(2022) 438, arXiv:2112.11266 [hep-ex]
Pith/arXiv arXiv 2022
-
[64]
Buckley et al.,LHAPDF6: parton density access in the LHC precision era, Eur
A. Buckley et al.,LHAPDF6: parton density access in the LHC precision era, Eur. Phys. J. C75(2015) 132, arXiv:1412.7420
Pith/arXiv arXiv 2015
-
[65]
ATLAS Collaboration,Electron and photon performance measurements with the ATLAS detector using the 2015–2017 LHC proton–proton collision data, JINST14(2019) P12006, arXiv:1908.00005 [hep-ex]
Pith/arXiv arXiv 2015
-
[66]
ATLAS Collaboration,Muon reconstruction and identification efficiency in ATLAS using the full Run 2𝑝𝑝collision data set at√𝑠=13TeV, Eur. Phys. J. C81(2021) 578, arXiv:2012.00578 [hep-ex]
Pith/arXiv arXiv 2021
-
[67]
ATLAS Collaboration, Jet reconstruction and performance using particle flow with the ATLAS Detector, Eur. Phys. J. C77(2017) 466, arXiv:1703.10485 [hep-ex]. 45
Pith/arXiv arXiv 2017
-
[68]
M. Cacciari, G. P. Salam and G. Soyez,The anti-𝑘𝑡 jet clustering algorithm, JHEP04(2008) 063, arXiv:0802.1189 [hep-ph]
Pith/arXiv arXiv 2008
-
[69]
M. Cacciari, G. P. Salam and G. Soyez,FastJet user manual, Eur. Phys. J. C72(2012) 1896, arXiv:1111.6097 [hep-ph]
Pith/arXiv arXiv 2012
-
[70]
ATLAS Collaboration,Jet energy scale and resolution measured in proton–proton collisions at√𝑠=13TeV with the ATLAS detector, Eur. Phys. J. C81(2021) 689, arXiv:2007.02645 [hep-ex]
Pith/arXiv arXiv 2021
-
[71]
ATLAS Collaboration,Performance of pile-up mitigation techniques for jets in𝑝𝑝collisions at√𝑠=8TeV using the ATLAS detector, Eur. Phys. J. C76(2016) 581, arXiv:1510.03823 [hep-ex]
Pith/arXiv arXiv 2016
-
[72]
ATLAS Collaboration, Identification and rejection of pile-up jets at high pseudorapidity with the ATLAS detector, Eur. Phys. J. C77(2017) 580, arXiv:1705.02211 [hep-ex], Erratum: Eur. Phys. J. C77(2017) 712
Pith/arXiv arXiv 2017
-
[73]
ATLAS Collaboration,ATLAS flavour-tagging algorithms for the LHC Run 2𝑝𝑝 collision dataset, Eur. Phys. J. C83(2023) 681, arXiv:2211.16345 [physics.data-an]
Pith/arXiv arXiv 2023
-
[74]
ATLAS Collaboration,Performance of missing transverse momentum reconstruction with the ATLAS detector using proton–proton collisions at√𝑠=13TeV, Eur. Phys. J. C78(2018) 903, arXiv:1802.08168 [hep-ex]
Pith/arXiv arXiv 2018
-
[75]
Particle Data Group,Review of Particle Physics, PTEP2022(2022) 083C01
2022
-
[76]
T. Chwalek,Measurement of𝑊-Boson Helicity-Fractions in Top-Quark Decays with the CDF II Experiment and Prospects for an Early𝑡𝑡Cross-Section Measurement with the CMS Experiment, Ph.D. Thesis, Karlsruhe U., IEKP-KA-2010-05, FERMILAB-THESIS-2010-74, CERN-THESIS-2010-255, 2010,url:https://cds.cern.ch/record/1416031
arXiv 2010
-
[77]
M. Feindt,A Neural Bayesian Estimator for Conditional Probability Densities, IEKP-KA/04-05, 2004, arXiv:physics/0402093 [physics.data-an]
Pith/arXiv arXiv 2004
-
[78]
Feindt and U
M. Feindt and U. Kerzel,The NeuroBayes neural network package, Nucl. Instrum. Meth. A559(2006) 190
2006
-
[79]
ATLAS Collaboration,Estimation of non-prompt and fake lepton backgrounds in final states with top quarks produced in proton–proton collisions at√𝑠=8TeV with the ATLAS Detector, ATLAS-CONF-2014-058, 2014,url:https://cds.cern.ch/record/1951336
arXiv 2014
-
[80]
ATLAS Collaboration,Search for flavour-changing neutral-current interactions of a top quark and a gluon in𝑝𝑝collisions at√𝑠=13TeV with the ATLAS detector, Eur. Phys. J. C82(2022) 334, arXiv:2112.01302 [hep-ex]
Pith/arXiv arXiv 2022
discussion (0)
Sign in with ORCID, Apple, or X to comment. Anyone can read and Pith papers without signing in.