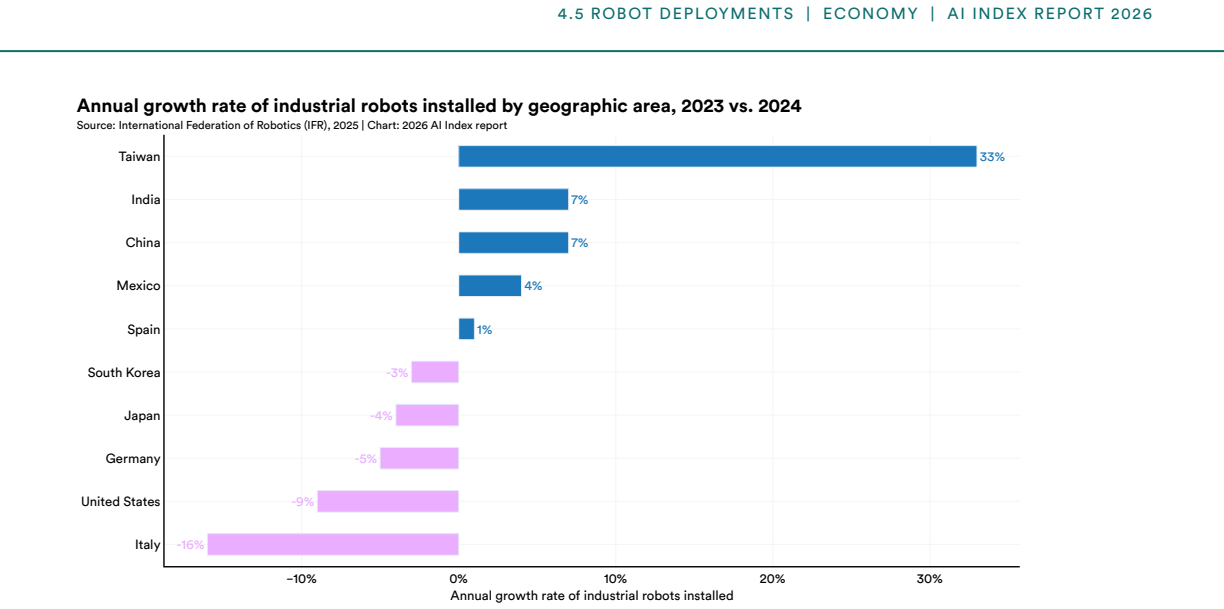
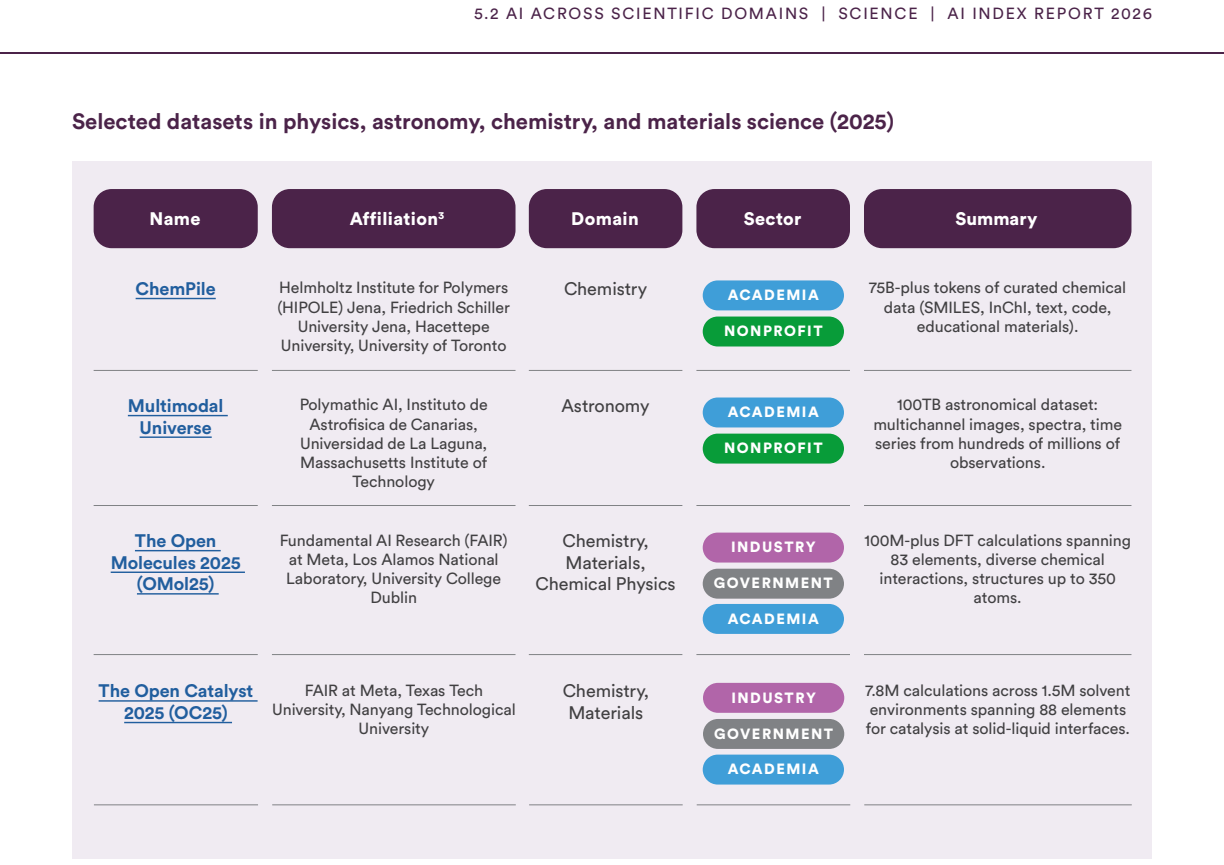
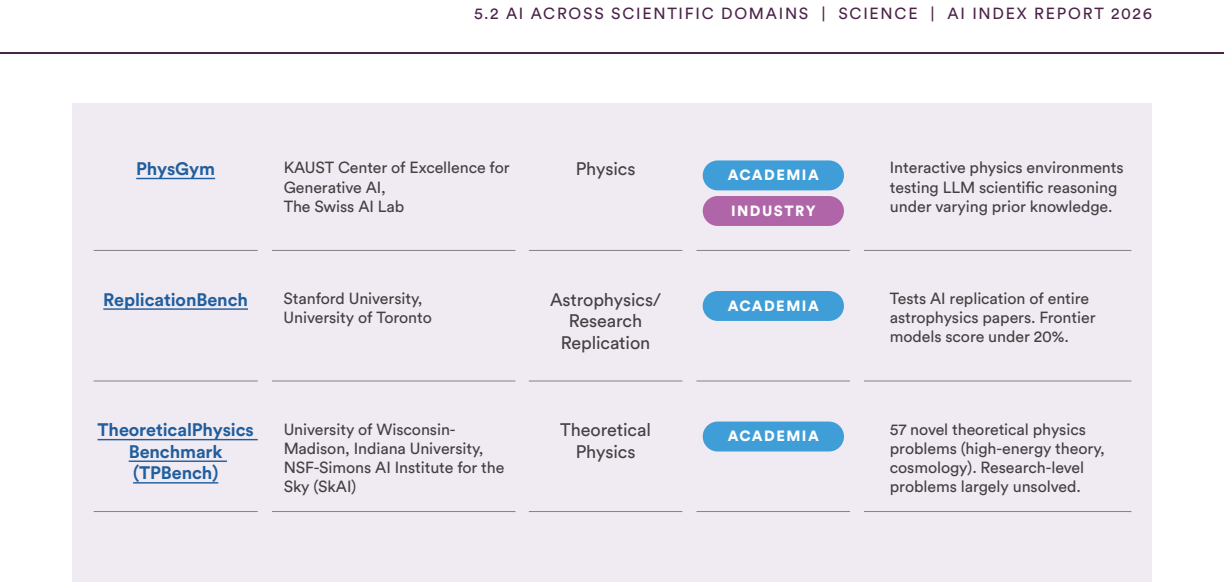
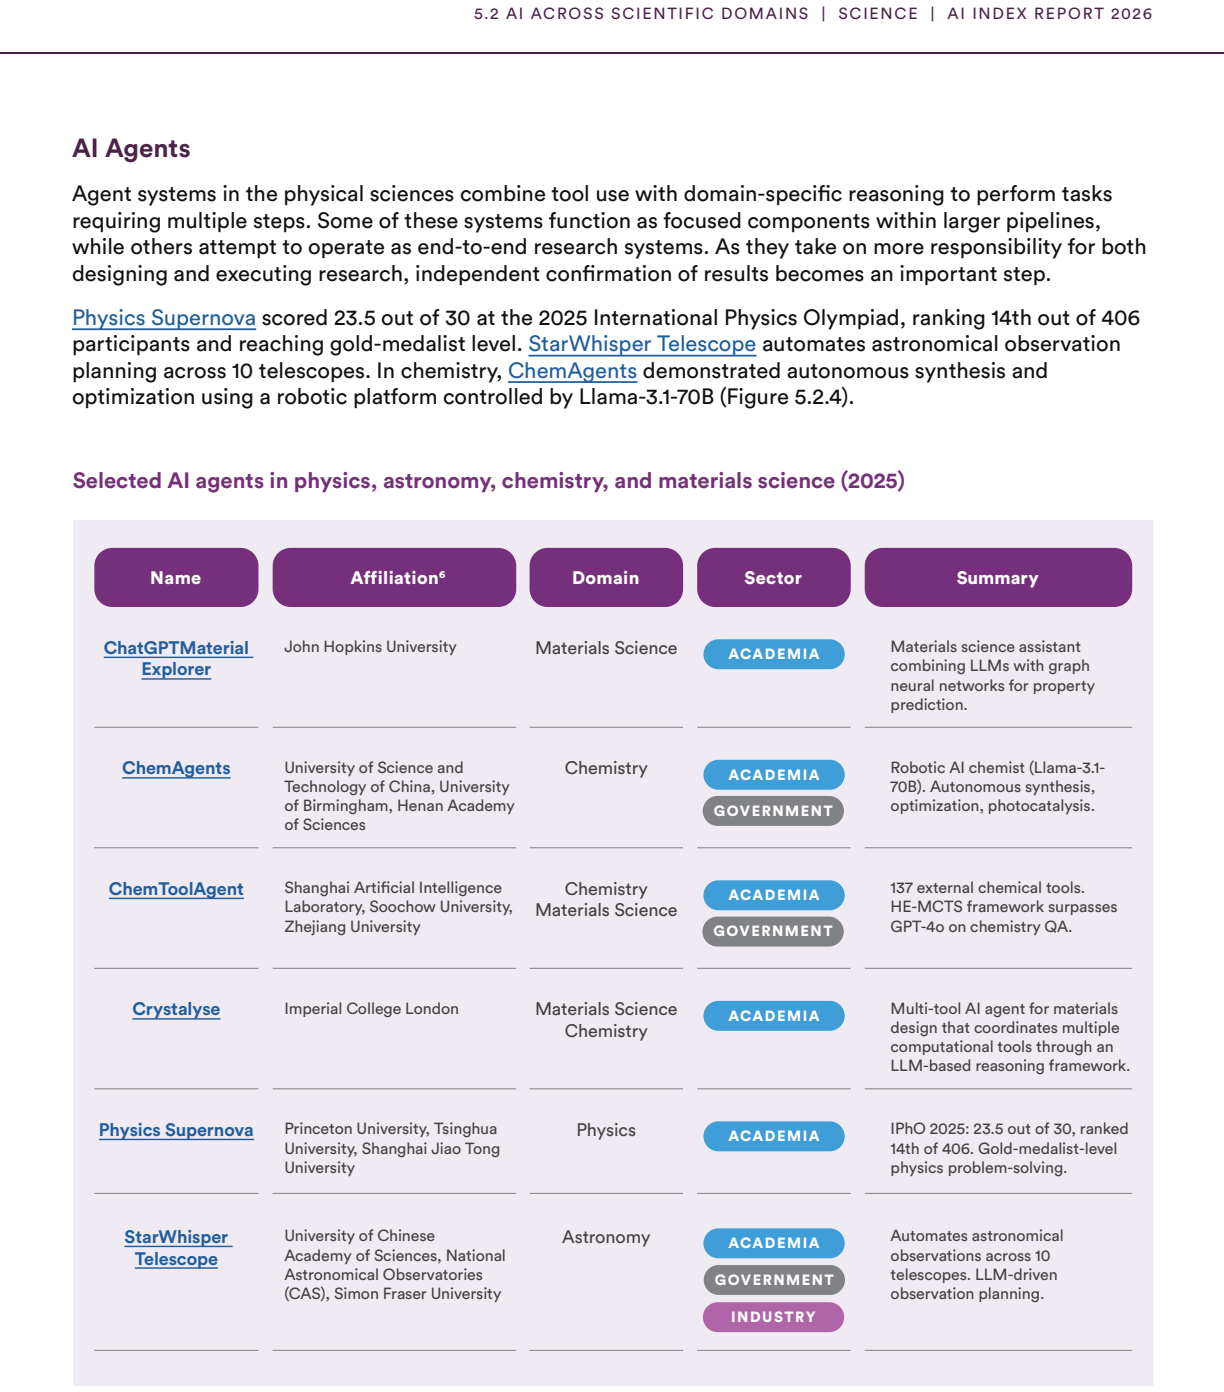
Pith. sign in

REVIEW 3 major objections 6 minor 3 references

AI is advancing and being adopted faster than governance, evaluation, education, and impact-measurement systems can adapt.

Reviewed by Pith at T0; open to challenge. T0 means a machine referee read the full paper against a public rubric. the ladder, T0–T4 →

T0 review · grok-4.5

2026-07-12 21:28 UTC pith:RYKFR7WB

load-bearing objection Ninth AI Index is the field’s main independent scoreboard: new science/medicine chapters and 2025–26 estimates, with the usual disclosure and leaderboard caveats already flagged in-text. the 3 major comments →

arxiv 2606.15708 v3 pith:RYKFR7WB submitted 2026-04-14 cs.AI

Artificial Intelligence Index Report 2026

classification cs.AI
keywords AI Indexgenerative AIAI benchmarksAI governanceAI adoptionAI sovereigntyAI in scienceAI in medicine
verification ladder T0 review T1 audit T2 compute T3 formal T4 reserved

The pith

A machine-rendered reading of the paper's core claim, the machinery that carries it, and where it could break.

This ninth annual AI Index argues that the defining pattern of 2025–2026 is not a plateau in capability but a widening gap between what AI systems can do and how prepared institutions are to measure, govern, educate for, and absorb them. Industry now produces most frontier models; organizational and consumer adoption have reached historic speed; and U.S. and Chinese top models have effectively closed the performance gap. At the same time, benchmarks are saturating or becoming hard to trust, responsible-AI reporting lags capability reporting, documented incidents are rising, and formal education and policy frameworks remain uneven. New estimates of generative AI’s consumer value, early labor-market signals, an AI-sovereignty frame, and standalone science and medicine chapters are used to show where the technology is already reshaping work, research, and care—and where the evidence base is still thin.

Core claim

The report’s central claim is that AI capability and mass adoption are scaling faster than the surrounding systems—governance frameworks, evaluation methods, education, safety and responsibility reporting, and the data infrastructure needed to track impact—can keep up, and that this mismatch, not a slowdown in the technology itself, runs through every major domain it surveys.

What carries the argument

Year-over-year synthesis of independently curated global indicators (notable models, compute and data-center capacity, open-source activity, publications and patents, talent flows, technical benchmarks, economic and labor series, policy actions, and public opinion), organized around the capability–preparedness gap as the through-line.

Load-bearing premise

The cross-country and closed-versus-open leadership stories rest on curated third-party model lists, public leaderboards, and company-disclosed scores that the report itself flags as incomplete, saturating, and not always independently confirmed.

What would settle it

A sustained multi-year period in which independent audits show frontier evaluation and safety reporting becoming more complete and stable, while capability gains slow or reverse on hard real-world agent and physical-task suites, would undermine the claim that capability is systematically outrunning the surrounding measurement and governance systems.

Watch this falsifier — get emailed when new claim-graph text bears on it.

If this is right

  • Benchmark scores will keep losing discriminative power as frontier models cluster and tests saturate within months rather than years.
  • Competitive advantage will shift from raw model rank toward cost, reliability, domain-specific performance, and infrastructure control.
  • Labor effects will appear first where measured productivity gains are clearest (for example software and support), including pressure on some entry-level roles.
  • National AI strategies will keep centering sovereignty—compute, talent, open-source participation, and domestic capacity—even while model production stays concentrated.
  • Science and clinical care will see rapid tool uptake while rigorous, real-world evidence and evaluation standards lag behind pilots and note-generation systems.

Where Pith is reading between the lines

These are editorial extensions of the paper, not claims the author makes directly.

  • If the gap is structural, annual independent measurement becomes a scarce public good rather than a retrospective scorecard.
  • Closing the U.S.–China model gap without parallel convergence on transparency and incident reporting would widen geopolitical risk asymmetries.
  • Consumer surplus from free or low-price generative tools may grow faster than firm-level productivity accounting can capture, complicating tax and competition policy.
  • Agent and robotics benchmarks that still fail one-in-three (or more) times will become the practical gate for claims about workplace and household autonomy.

Editorial analysis

A structured set of objections, weighed in public.

Desk editor's note, referee report, simulated authors' rebuttal, and a circularity audit.

Referee Report

3 major / 6 minor

Summary. The AI Index Report 2026 is the ninth annual Stanford HAI compilation of independently curated indicators on AI research and development, technical performance, responsible AI, economy, science, medicine, education, policy/governance, and public opinion. Its organizing thesis is that AI capability and adoption are advancing faster than governance frameworks, evaluation methods, education systems, and impact-measurement infrastructure can adapt. Supporting strands include industry concentration of notable models (>90%), closed U.S.–China frontier gaps on Arena-style rankings, rising incidents and uneven safety reporting, generative-AI adoption and consumer-value estimates, labor-market and productivity findings, new science/medicine chapters, education policy lags, and an AI-sovereignty framing of national strategies.

Significance. If the multi-strand synthesis holds, the report is a high-value public-goods reference for policymakers, researchers, executives, and journalists: it aggregates Epoch, OpenAlex/CSO, PATSTAT, GitHub/Hugging Face, Cloudscene, Zeki, IEA, clinical-evidence reviews, and related series with explicit caveats, and it introduces first-time standalone science and medicine chapters plus generative-AI value and sovereignty framing. Strengths include transparent methodology notes (compute estimation, human-baseline scaling, patent home bias, virtual attendance, invalid-item rates), multi-source triangulation of the gap thesis, and open data/tools. The contribution is measurement and synthesis rather than a novel theorem; its significance is institutional and empirical.

major comments (3)
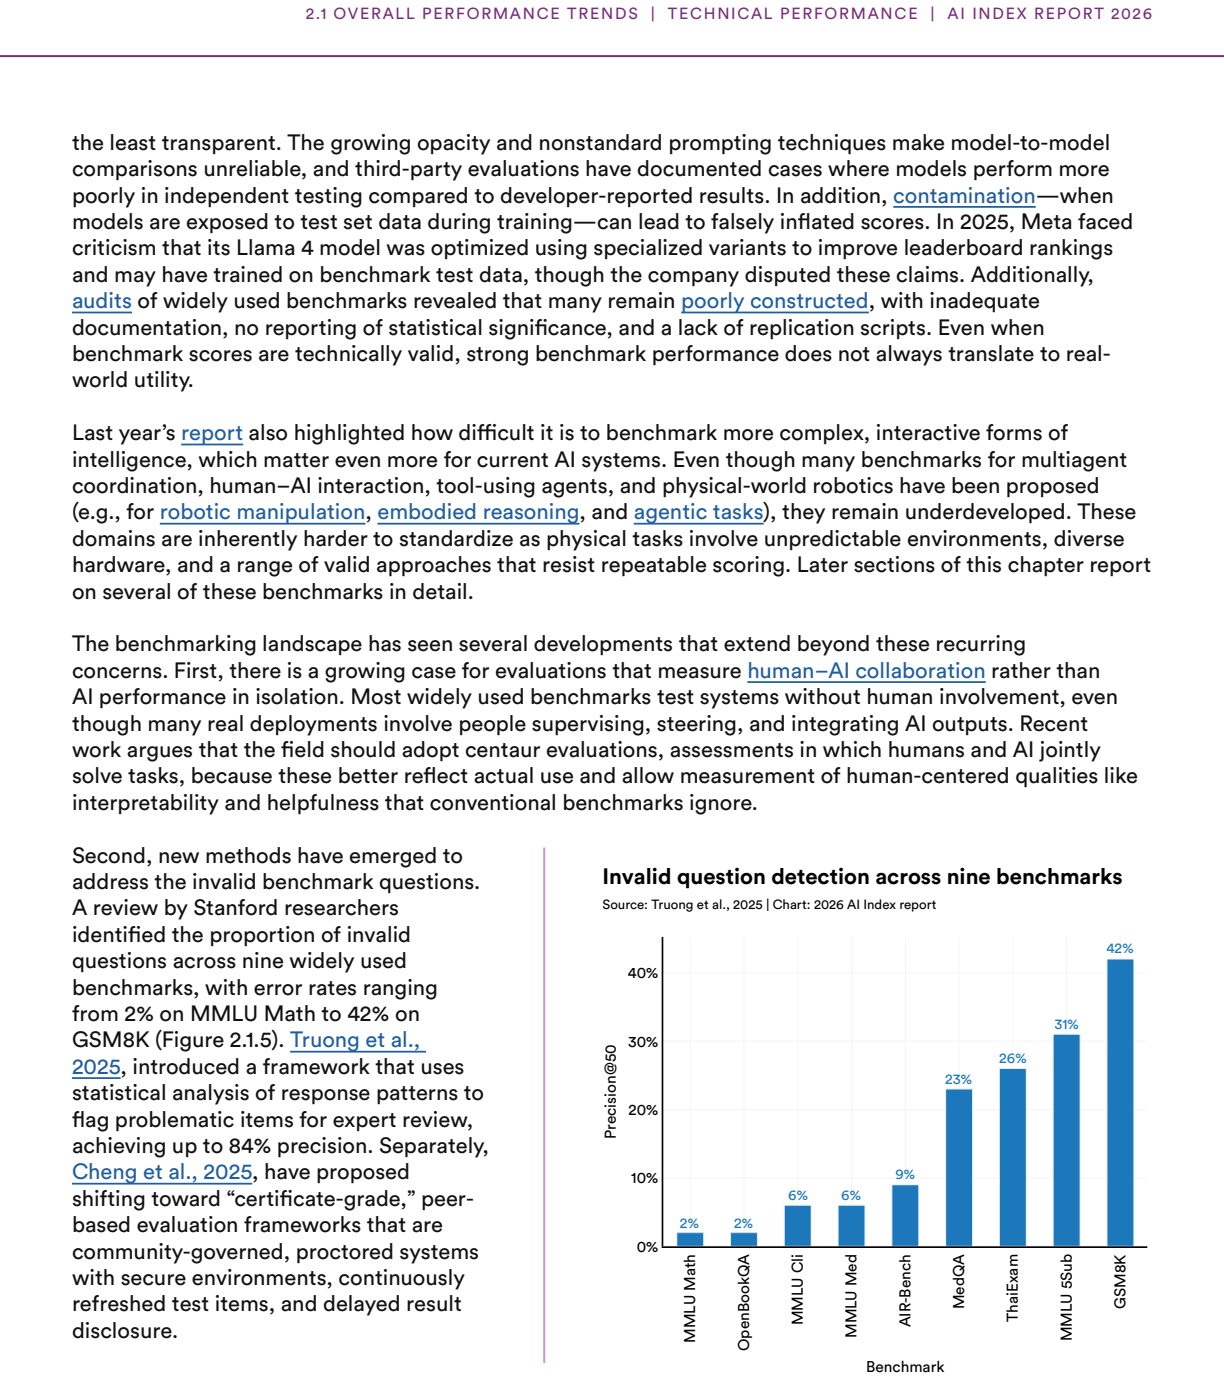
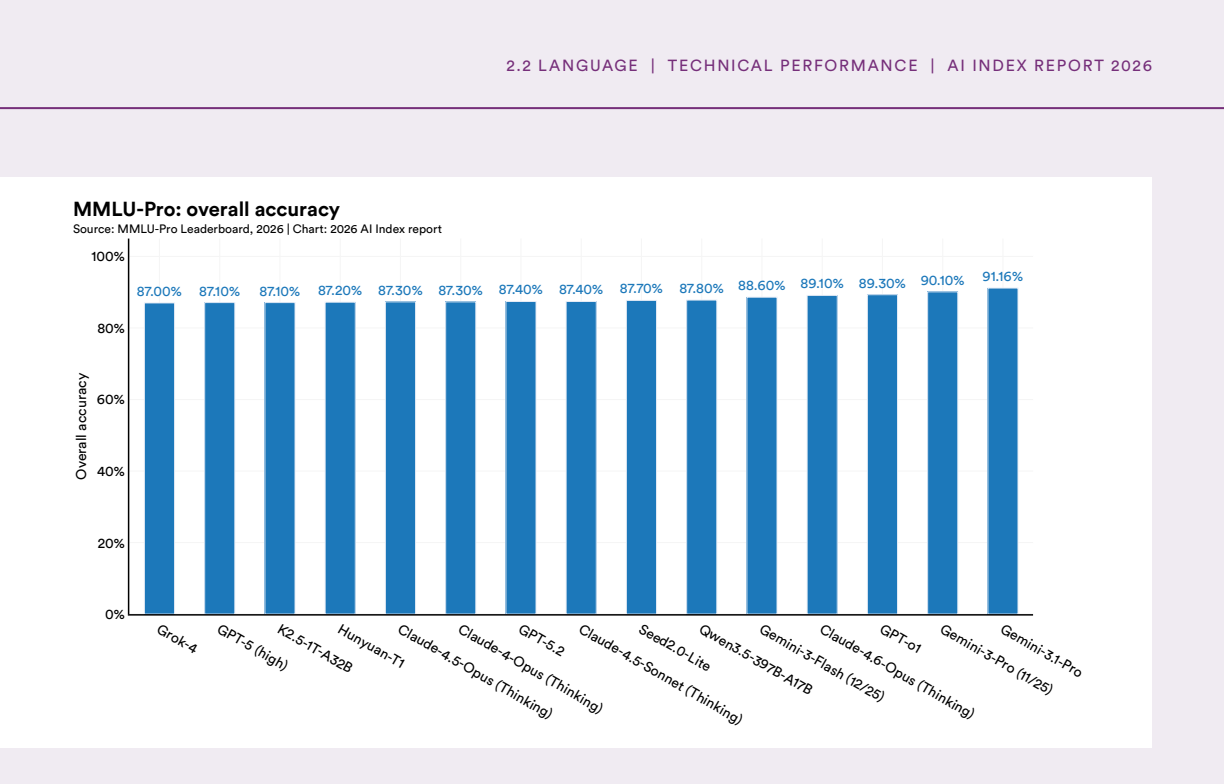
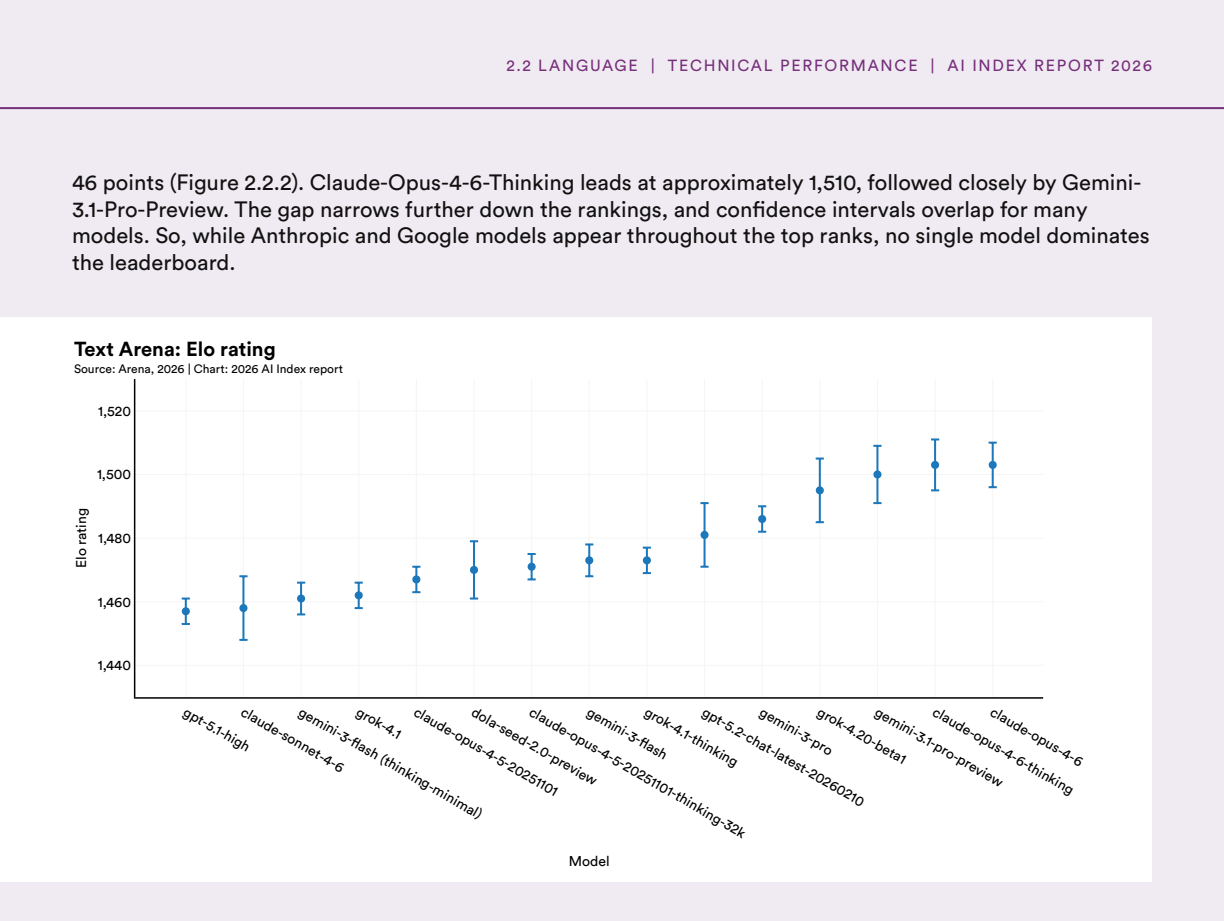
  1. Ch. 2 Benchmarking AI and overall-trends methodology: the Index states it assumes company-reported benchmark scores are accurate while also documenting saturation, contamination risk, invalid-item rates (e.g., up to 42% on GSM8K), and Arena platform-adaptation concerns. For closed-vs-open and U.S.–China leadership claims (Figs. 2.1.2–2.1.4), either restrict primary claims to independent/third-party evaluations or add a systematic side-by-side of developer-reported vs independent scores so leadership conclusions do not rest on the accuracy assumption.
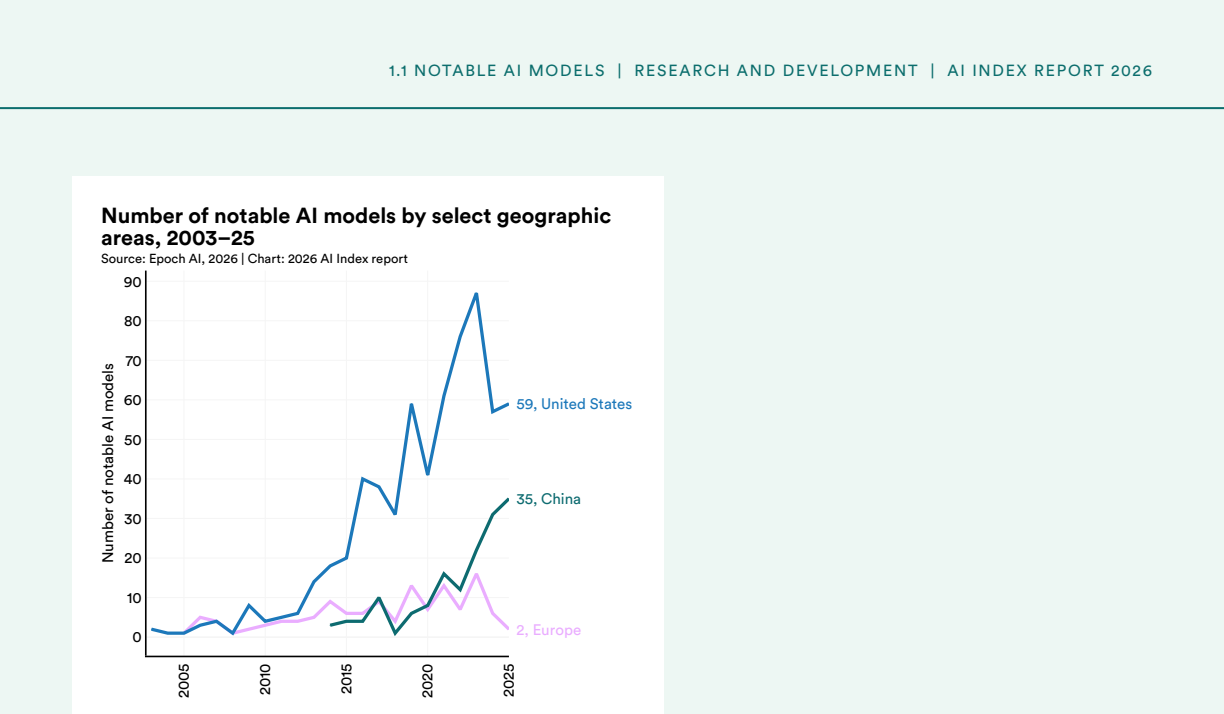
  2. Ch. 1 §1.1 Notable AI Models: Epoch’s manual “notable” curation underpins industry-share (>90%), national tallies (U.S. 59 vs China 35), and transparency claims. The text correctly calls it non-census, but year-over-year and cross-country leadership language still reads as population inference. State inclusion criteria more fully (or appendix) and report sensitivity of headline shares to alternate thresholds or automatic filters.
  3. Ch. 6 Medicine (Top Takeaway 12; evidence-base discussion): the claim that rigorous clinical evidence remains limited (review of >500 studies; ~half exam-style; only ~5% real clinical data) is load-bearing for the medicine chapter’s caution. Specify the review’s inclusion criteria, search window, and how “real clinical data” and “exam-style” were coded so the 5% figure is auditable and not over-generalized beyond the sampled literature.
minor comments (6)
  1. Human-baseline-relative scaling in Fig. 2.1.1: define the exact baseline sources and year for each task in the caption or appendix so 100% is reproducible.
  2. §1.2 Data Center Power Capacity: the ~2.5× multiplier from chip TDP to facility power should be sourced or sensitivity-tested in a footnote.
  3. OpenAlex “unknown” affiliation spike (~39% in 2024, Fig. 1.6.6): discuss whether the China/Europe/U.S. share shifts are robust to excluding unknowns or to imputation.
  4. GitHub China undercount (Gitee/GitCode excluded; self-reported location): keep the caveat adjacent to any rest-of-world vs U.S. engagement comparison in §1.5.
  5. Normalize figure numbering and fix minor label typos in charts (e.g., truncated legend strings) for camera-ready consistency.
  6. AI-sovereignty “analytical framework” (Takeaway 14 / Ch. 8): a short explicit definition box would help readers separate Index framing from primary legal texts.

Circularity Check

0 steps flagged

No circular derivation: the Index aggregates external series and third-party leaderboards; it does not fit free parameters or self-define predictions.

full rationale

The AI Index Report 2026 is an empirical synthesis, not a first-principles derivation. Its organizing claim—that capability and adoption outpace governance, evaluation, education, and impact-measurement systems—is assembled from independent external strands (Epoch AI notable-model curation, Arena Elo, OpenAlex/PATSTAT, GitHub/Hugging Face, Cloudscene, Zeki talent data, IEA energy figures, clinical and education surveys, incident tallies, policy timelines). Human-baseline scaling of benchmarks (Ch. 2) and the “notable model” designation (Ch. 1 §1.1) are disclosed methodological choices, not parameters fitted to force a target ratio or prediction. Company-reported scores are explicitly assumed accurate and flagged as limited by saturation, contamination, and disclosure opacity; those caveats do not make the gap thesis tautological. Self-reference to prior Index editions is continuity of series, not a load-bearing uniqueness theorem or ansatz. No equation reduces a claimed prediction to its own fitted input by construction. Score 0 is therefore the correct, non-manufactured finding.

Axiom & Free-Parameter Ledger

5 free parameters · 4 axioms · 2 invented entities

As a measurement report, load-bearing structure is definitional and data-source assumptions rather than physical axioms. The central gap narrative rests on (1) Epoch-style notability and compute estimation, (2) treating developer-reported and Arena scores as comparable capability signals, (3) human-baseline scaling for cross-benchmark charts, and (4) partner datasets for talent, investment, and adoption. No new particles or forces; free parameters are thresholds, multipliers, and classification rules.

free parameters (5)
  • Epoch AI notable-model inclusion criteria
    Manual curation (SOTA, historical significance, citations) defines the industry-share and country-count series; not a census (Ch. 1 §1.1).
  • Human-baseline scaling for multi-benchmark chart
    Best model each year expressed as % of human baseline enables Fig. 2.1.1 comparisons; choice of baseline and task set is Index-defined (Ch. 2).
  • AI data-center power multiplier (~2.5× chip TDP)
    Converts chip thermal design power into facility power capacity estimates (Ch. 1 §1.2).
  • GitHub engagement threshold (≥10 stars)
    Filters project counts used for geographic open-source activity (Ch. 1 §1.5).
  • CSO Classifier v3.3 AI-topic assignment
    Automated ontology labels determine publication volume and topic shares in OpenAlex (Ch. 1 §1.6).
axioms (4)
  • domain assumption Company-reported benchmark numbers can be treated as accurate for Index tables unless independently contradicted.
    Stated in Ch. 2 Benchmarking AI; underpins SWE-bench, MMLU-Pro, GPQA, etc. trend claims.
  • domain assumption A model’s national affiliation is given by author institutional countries (with double-counting allowed).
    Ch. 1 national-affiliation methodology for models and publications.
  • domain assumption Forward patent citations and publication citations are usable proxies for influence despite home bias and venue lags.
    Ch. 1 §§1.6–1.7; authors note limitations (Higham et al., home bias).
  • standard math Standard descriptive statistics and year-over-year comparisons on curated series support qualitative leadership and gap claims.
    Throughout; no novel statistical estimator is the product.
invented entities (2)
  • AI Index human-baseline-relative performance scale no independent evidence
    purpose: Normalize heterogeneous benchmarks onto one chart vs human performance.
    Index-constructed metric; useful for communication but not an external physical quantity.
  • AI sovereignty analytical framework (as Index framing) no independent evidence
    purpose: Organize national strategy, compute, and open-source participation trends in policy chapter.
    Policy lens highlighted as new in abstract/intro; descriptive rather than a validated causal model.

pith-pipeline@v1.1.0-grok45 · 62782 in / 3320 out tokens · 38848 ms · 2026-07-12T21:28:41.129673+00:00 · methodology

0 comments
read the original abstract

Welcome to the ninth edition of the AI Index report. As AI continues to advance rapidly, the question becomes whether the systems built around it can keep up. Governance frameworks, evaluation methods, education systems, and the data infrastructure needed to track AI's impact are struggling to match the pace of the technology itself. That gap between what AI can do and how prepared we are to manage it runs through every chapter of this year's report. New in this edition, the report tracks how AI is being tested more ambitiously across reasoning, safety, and real-world task execution, and why those measurements are increasingly difficult to rely on. It also features new estimates of generative AI's economic value alongside emerging evidence of its labor market effects, an analytical framework on AI sovereignty, and a science chapter developed in collaboration with Schmidt Sciences. For the first time, the report features standalone chapters on AI in science and AI in medicine, reflecting AI's growing impact across these two domains.

Figures

Figures reproduced from arXiv: 2606.15708 by Carla Brodley, Dan Weld, Elham Tabassi, Erik Brynjolfsson, Jack Clark, James Landay, James Manyika, Juan Carlos Niebles, Juan Pava, Lapo Santarlasci, Loredana Fattorini, Nestor Maslej, Raymond Perrault, Russ Altman, Russell Wald, Sha Sajadieh, Terah Lyons, Toby Walsh, Vanessa Parli, Vipin Kumar, Virginia Dignum, Yoav Shoham, Yolanda Gil.
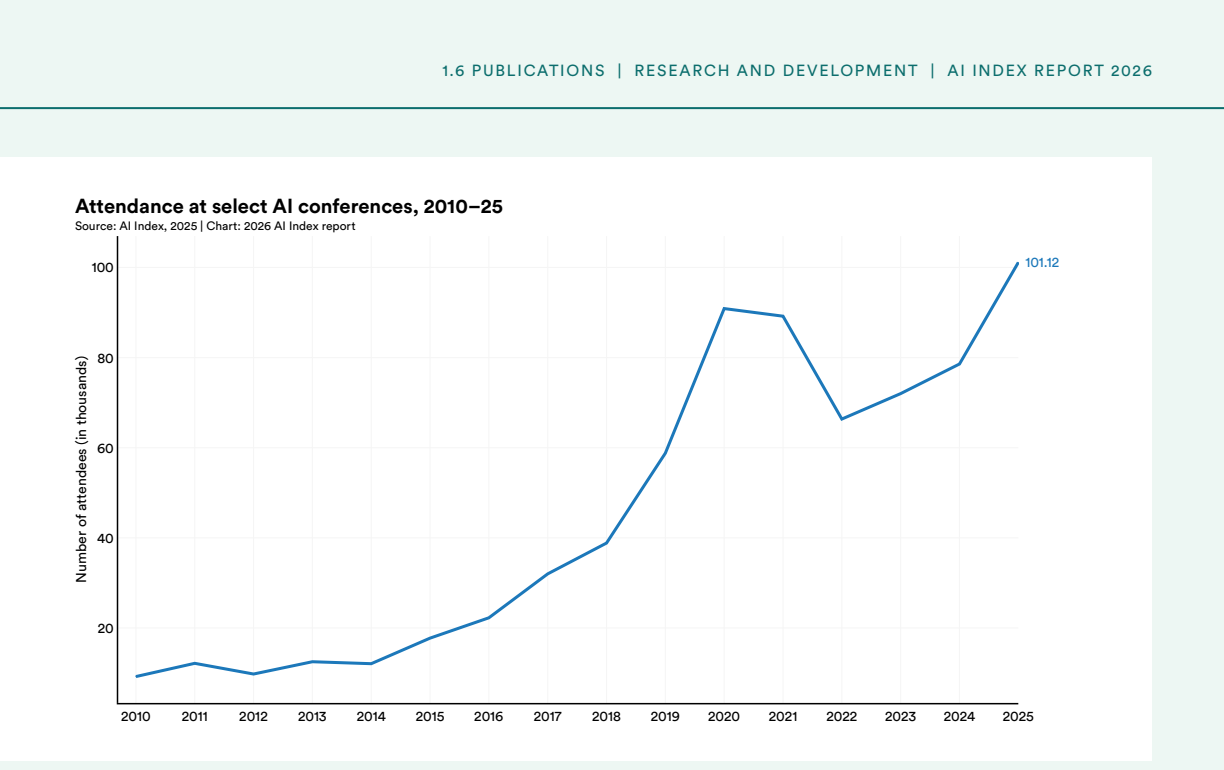
Figure 1.1
Figure 1.1. Figure 1.1: 13 1 New and historic models are continually added to the Epoch AI database, so the total year-by-year counts of models included in this year’s AI Index might not exactly match those published in last year’s report. The data is based on a snapshot taken on April 22, 2026. 2 A machine learning model is associated with a specific country if at least one author of the paper introducing it is affiliated with… view at source ↗
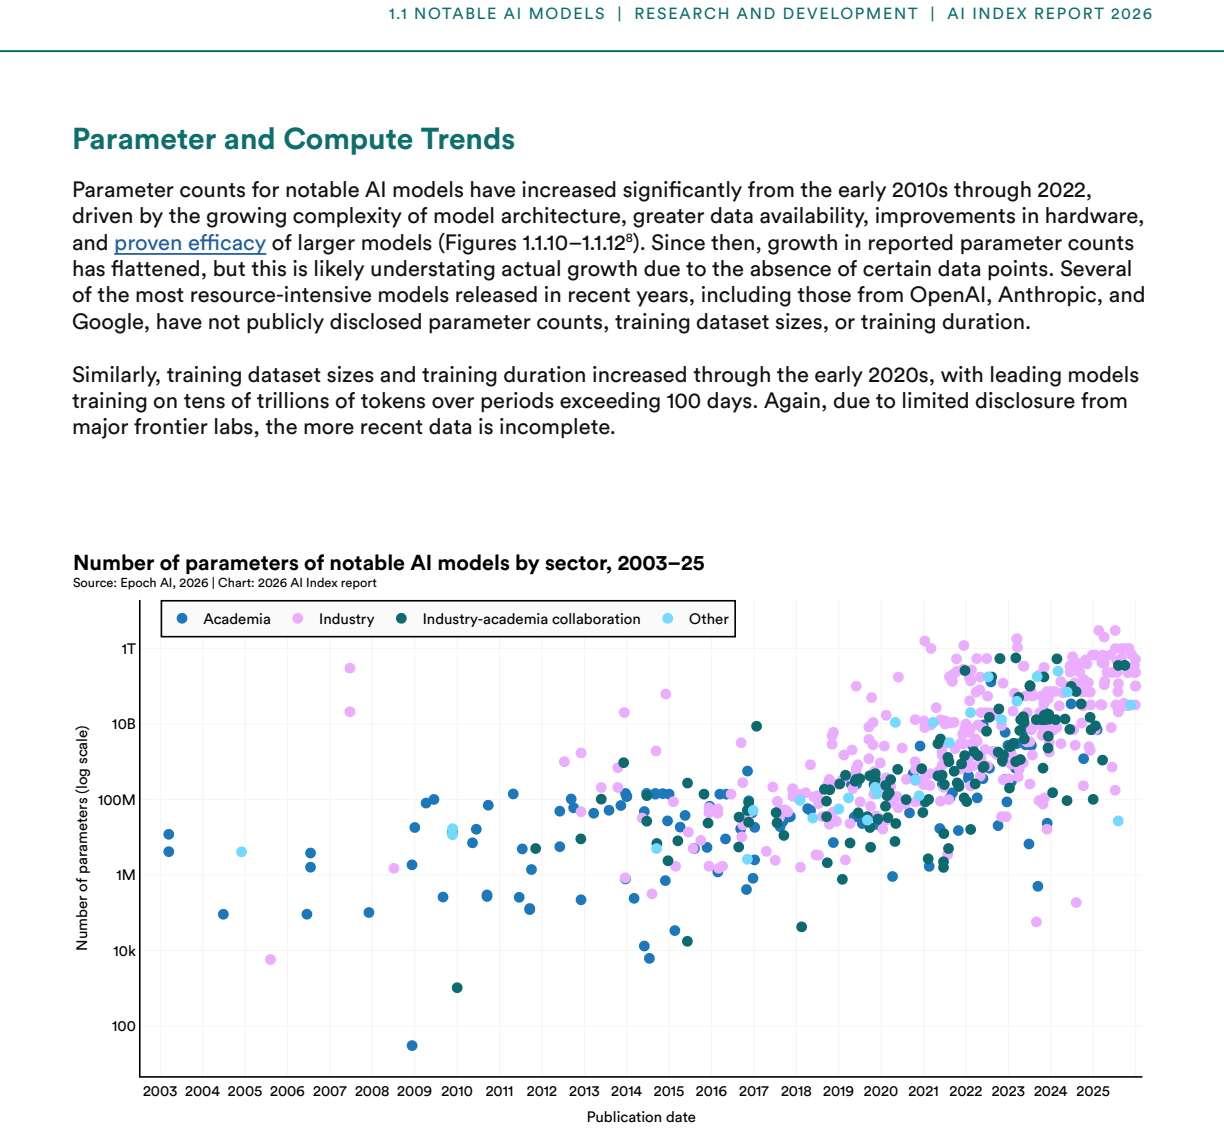
Figure 1.1
Figure 1.1. Figure 1.1: 2 [PITH_FULL_IMAGE:figures/full_fig_p018_1_1.png] view at source ↗
Figure 1.1
Figure 1.1. Figure 1.1: 4 [PITH_FULL_IMAGE:figures/full_fig_p019_1_1.png] view at source ↗
Figure 1.1
Figure 1.1. Figure 1.1: 5 [PITH_FULL_IMAGE:figures/full_fig_p020_1_1.png] view at source ↗
Figure 1.1
Figure 1.1. Figure 1.1: 7 Model Release Release patterns for notable AI models have continued to shift toward controlled access ( [PITH_FULL_IMAGE:figures/full_fig_p021_1_1.png] view at source ↗
Figure 1.1
Figure 1.1. Figure 1.1: 87 7 Not all models in the Epoch database are categorized by access type, so the totals in Figures 1.1.8 and 1.1.9 may not fully align with those reported elsewhere in the chapter. 14 29 22 34 31 30 12 11 9 13 12 13 24 25 38 54 76 80 81 29 22 29 34 9 17 33 29 49 55 37 68 50 78 91 119 98 102 2014 2015 2016 2017 2018 2019 2020 2021 2022 2023 2024 2025 0 20 40 60 80 100 120 140 Open source Open (restricted … view at source ↗
Figure 1.1
Figure 1.1. Figure 1.1: 10 [PITH_FULL_IMAGE:figures/full_fig_p023_1_1.png] view at source ↗
Figure 1.1
Figure 1.1. Figure 1.1: 11 [PITH_FULL_IMAGE:figures/full_fig_p024_1_1.png] view at source ↗
Figure 1.1
Figure 1.1. Figure 1.1: 139 9 Estimating training compute is an important aspect of AI model analysis, yet it often requires indirect measurement. When direct reporting is unavailable, Epoch estimates compute by using hardware specifications and usage patterns or by counting arithmetic operations based on model architecture and training data. In cases where neither approach is feasible, benchmark performance can serve as a prox… view at source ↗
Figure 1.1
Figure 1.1. Figure 1.1: 15 Source: Qin et al., 2025 [PITH_FULL_IMAGE:figures/full_fig_p026_1_1.png] view at source ↗
Figure 1.1
Figure 1.1. Figure 1.1: 16 Prevalence of Synthetic Content Since the launch of ChatGPT in November 2022, there have been predictions that the internet would soon become overrun by AI-generated content. Recent research from Graphite suggests that beginning in January 2025, over 50% of newly published online content was generated by AI ( [PITH_FULL_IMAGE:figures/full_fig_p027_1_1.png] view at source ↗
Figure 1.1
Figure 1.1. Figure 1.1: 17 [PITH_FULL_IMAGE:figures/full_fig_p028_1_1.png] view at source ↗
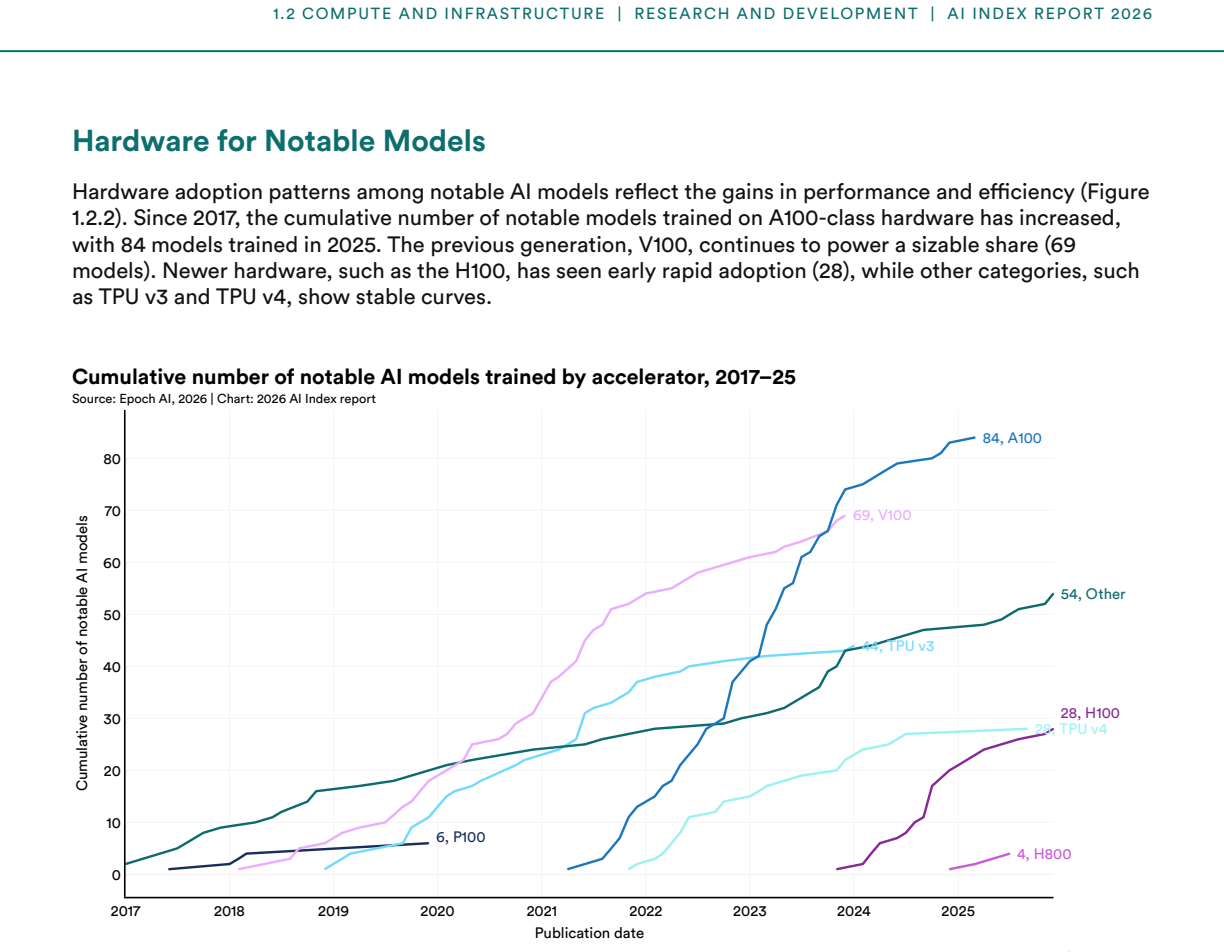
Figure 1.2
Figure 1.2. Figure 1.2: 1 [PITH_FULL_IMAGE:figures/full_fig_p029_1_2.png] view at source ↗
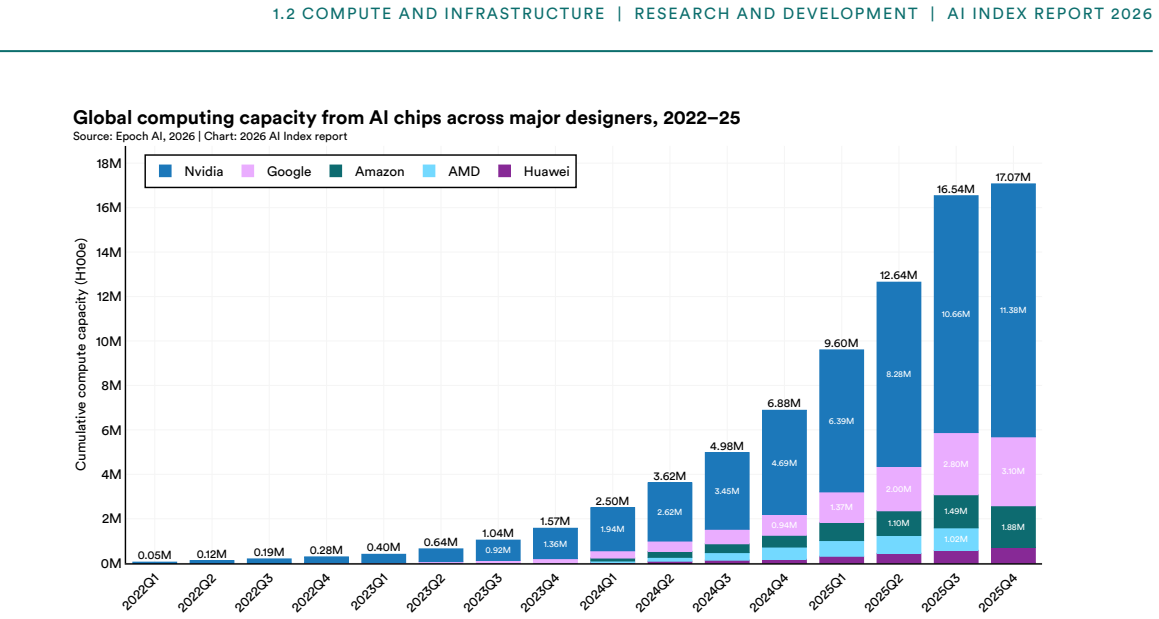
Figure 1.2
Figure 1.2. Figure 1.2: 2 The supply of AI computing capacity from major chip designers has continued to increase ( [PITH_FULL_IMAGE:figures/full_fig_p030_1_2.png] view at source ↗
Figure 1.2
Figure 1.2. Figure 1.2: 3 [PITH_FULL_IMAGE:figures/full_fig_p031_1_2.png] view at source ↗
Figure 1.3
Figure 1.3. Figure 1.3: 1 [PITH_FULL_IMAGE:figures/full_fig_p033_1_3.png] view at source ↗
Figure 1.4
Figure 1.4. Figure 1.4: 1 [PITH_FULL_IMAGE:figures/full_fig_p035_1_4.png] view at source ↗
Figure 1.4
Figure 1.4. Figure 1.4: 3 [PITH_FULL_IMAGE:figures/full_fig_p036_1_4.png] view at source ↗
Figure 1.4
Figure 1.4. Figure 1.4: 513 13 This figure shows the top 15 models by energy consumption for 2024 and 2025. The full set of models is available through the source dashboard [PITH_FULL_IMAGE:figures/full_fig_p037_1_4.png] view at source ↗
Figure 1.4
Figure 1.4. Figure 1.4: 614 14 This figure shows the top 15 models by energy consumption for 2024 and 2025. The full set of models is available through the source dashboard. At the level of a single query, the numbers seem more modest. A short GPT-4o query consumes approximately 0.42 Wh, which is 40% more than a Google search at 0.3 Wh ( [PITH_FULL_IMAGE:figures/full_fig_p038_1_4.png] view at source ↗
Figure 1.4
Figure 1.4. Figure 1.4: 7 [PITH_FULL_IMAGE:figures/full_fig_p039_1_4.png] view at source ↗
Figure 1.4
Figure 1.4. Figure 1.4: 9 [PITH_FULL_IMAGE:figures/full_fig_p040_1_4.png] view at source ↗
Figure 1.4
Figure 1.4. Figure 1.4: 12 [PITH_FULL_IMAGE:figures/full_fig_p041_1_4.png] view at source ↗
Figure 1.5
Figure 1.5. Figure 1.5: 1 [PITH_FULL_IMAGE:figures/full_fig_p042_1_5.png] view at source ↗
Figure 1.5
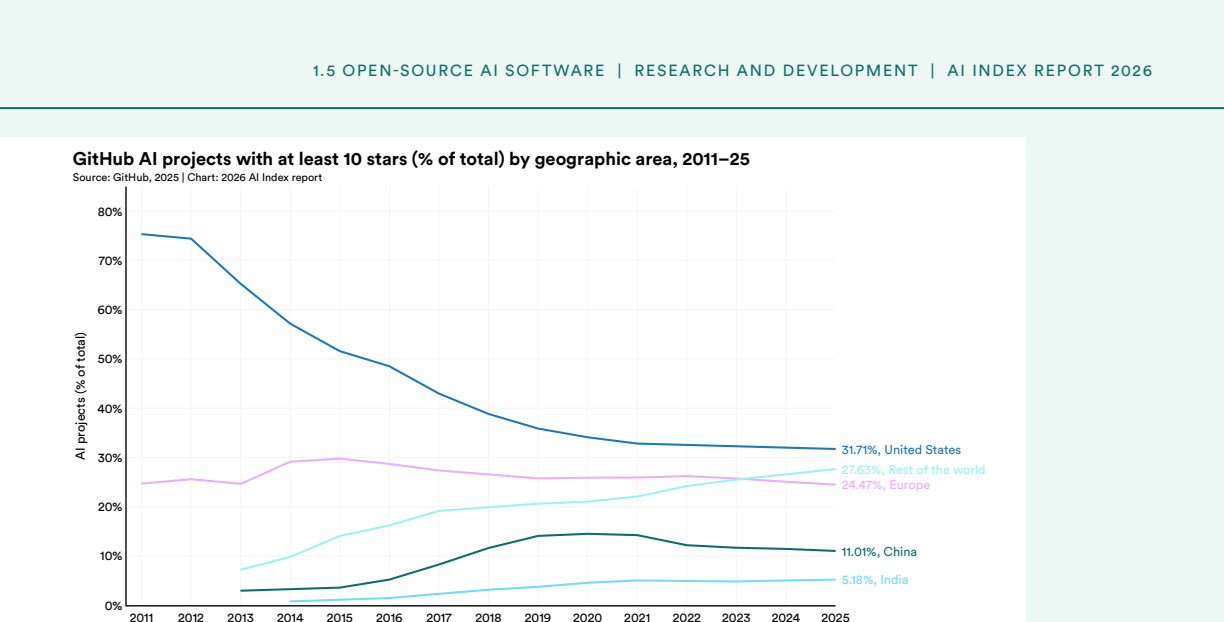
Figure 1.5. Figure 1.5: 2 The geographic distribution of more visible open-source AI projects has shifted over time ( [PITH_FULL_IMAGE:figures/full_fig_p043_1_5.png] view at source ↗
Figure 1.5
Figure 1.5. Figure 1.5: 317 Beyond project counts, GitHub stars provide another signal of developer interest and engagement in open￾source communities ( [PITH_FULL_IMAGE:figures/full_fig_p044_1_5.png] view at source ↗
Figure 1.5
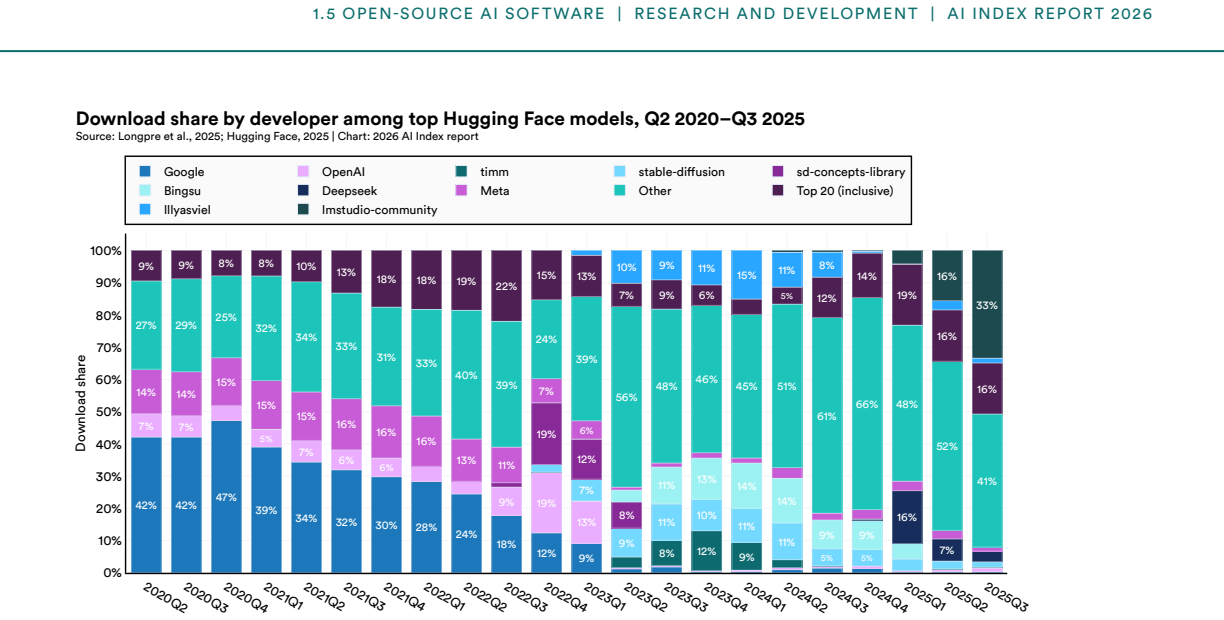
Figure 1.5. Figure 1.5: 5 Model and Dataset Ecosystem To complement the GitHub view, this section uses metadata from Hugging Face, a widely used community platform and open repository for AI models and datasets. The analysis focuses on assets created or uploaded between 2022 and 2025 to understand recent activity and adoption trends (Figures 1.5.6 and 1.5.7). Upload activity has continued to rise over the last few years, with a… view at source ↗
Figure 1.5
Figure 1.5. Figure 1.5: 620 [PITH_FULL_IMAGE:figures/full_fig_p046_1_5.png] view at source ↗
Figure 1.5
Figure 1.5. Figure 1.5: 822 [PITH_FULL_IMAGE:figures/full_fig_p047_1_5.png] view at source ↗
Figure 1.6
Figure 1.6. Figure 1.6: 1 [PITH_FULL_IMAGE:figures/full_fig_p048_1_6.png] view at source ↗
Figure 1.6
Figure 1.6. Figure 1.6: 2 Publication venue patterns capture where AI research is formally published, while conference attendance offers a complementary view of research community engagement. Across the 16 major conferences tracked by the AI Index—AAAI, AAMAS, CVPR, EMNLP, FAccT, ICAPS, ICCV, ICLR, ICML, ICRA, IJCAI, IROS, KR, NeurIPS, UAI, and IUI—total attendance increased in 2024 from the previous year ( [PITH_FULL_IMAGE:fi… view at source ↗
Figure 1.6
Figure 1.6. Figure 1.6: 3 [PITH_FULL_IMAGE:figures/full_fig_p050_1_6.png] view at source ↗
Figure 1.6
Figure 1.6. Figure 1.6: 527 By National Affiliation28 In 2024, China accounted for 17.8% of AI publications in 2024, compared to 11.1% from Europe and 7.6% from India ( [PITH_FULL_IMAGE:figures/full_fig_p051_1_6.png] view at source ↗
Figure 1.6
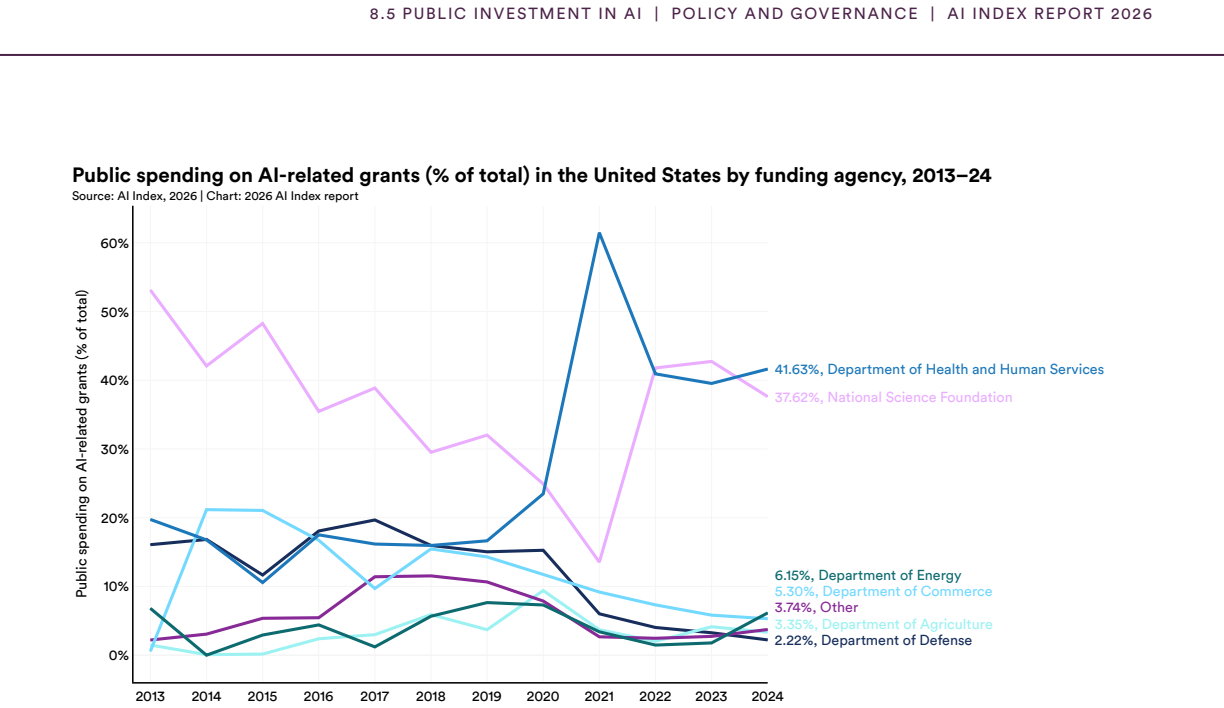
Figure 1.6. Figure 1.6: 630 30 For the sake of brevity, the AI Index visualized results for a select group of countries. However, complete results for all countries will be available on the AI Index’s Global Vibrancy Tool by the end of 2026. For immediate access to country-specific research and development data, please contact the AI Index team. 1.6 PUBLICATIONS | RESEARCH AND DEVELOPMENT | AI INDEX REPORT 2026 2013 2014 2015 2… view at source ↗
Figure 1.6
Figure 1.6. Figure 1.6: 831 31 For [PITH_FULL_IMAGE:figures/full_fig_p053_1_6.png] view at source ↗
Figure 1.6
Figure 1.6. Figure 1.6: 1032 The AI Index identified the 100 most-cited AI publications from 2021 to 2024 using citation data from OpenAlex.33 Due to citation lag, this set can shift as citations accumulate over time.34 The publication volume data above captures the scale of research activity, while the top 100 offers a more selective view on which work is gaining the most recognition and influence. 32 The AI Index categorized … view at source ↗
Figure 1.6
Figure 1.6. Figure 1.6: 11 By Sector and Organization The sector composition of the top 100 remained consistent, with academia producing the most top-cited publications year over year ( [PITH_FULL_IMAGE:figures/full_fig_p055_1_6.png] view at source ↗
Figure 1.6
Figure 1.6. Figure 1.6: 1235 [PITH_FULL_IMAGE:figures/full_fig_p056_1_6.png] view at source ↗
Figure 1.7
Figure 1.7. Figure 1.7: 138 37 More details on the methodology behind this section’s patent analysis can be found in the Appendix. 38 Patent standards and laws vary across countries and regions, so these charts should be interpreted with caution. More detailed country-level patent information will be released in a subsequent edition of the AI Index’s Global Vibrancy Tool. Global Trends Globally, the number of granted AI patents… view at source ↗
Figure 1.7
Figure 1.7. Figure 1.7: 2 [PITH_FULL_IMAGE:figures/full_fig_p058_1_7.png] view at source ↗
Figure 1.7
Figure 1.7. Figure 1.7: 4 Forward Citations Flow When newly filed patents reference earlier ones, those references are called forward citations. These are often used as a proxy for influence, since they indicate how often an invention informs later work. By this measure, the United States accounts for over half of all AI patent forward citations, a signal of downstream influence that contrasts with its 12.1% share of patent vol… view at source ↗
Figure 1.7
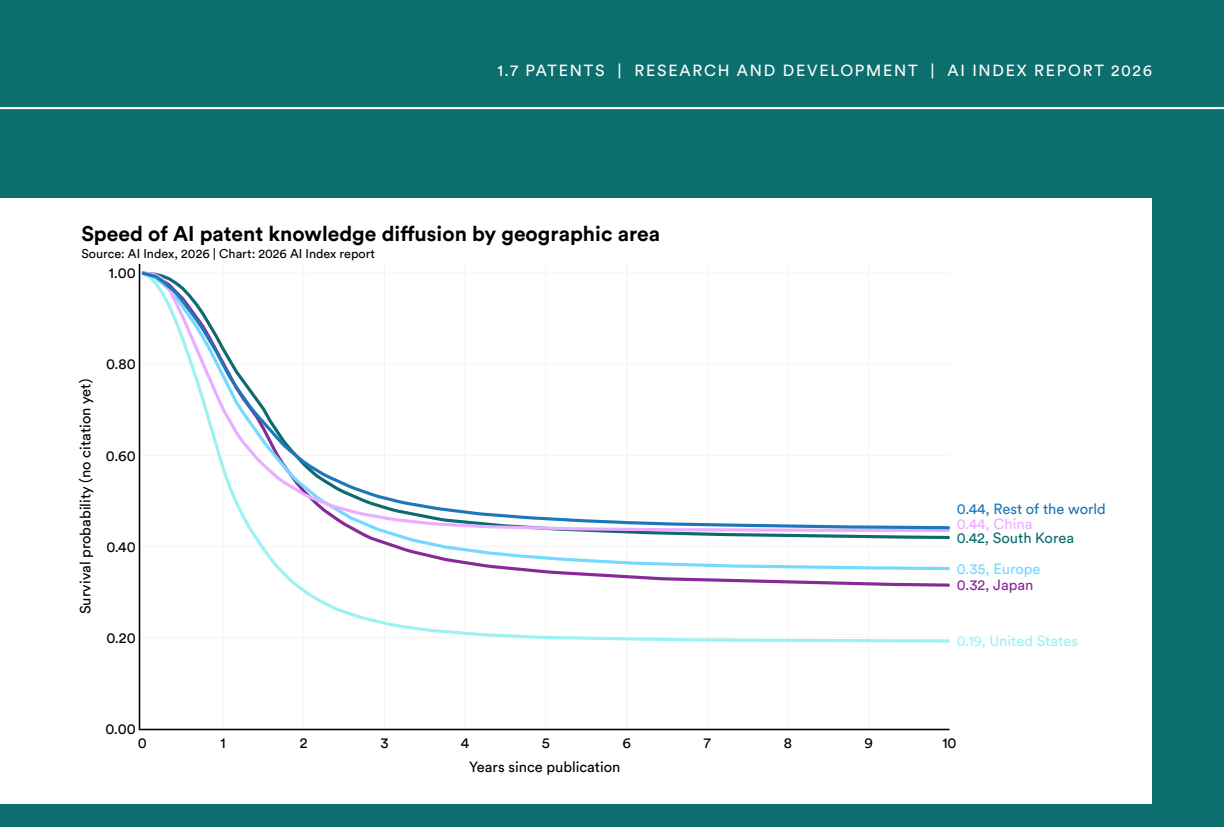
Figure 1.7. Figure 1.7: 539 39 Each data point in the figure reflects forward citations to AI patents, grouped at the patent family level to represent unique inventions rather than individual filings. Values are expressed as shares of all AI patent forward citations for patents granted between 2010 and 2024. Speed of Knowledge Diffusion Patent citation lag—the time between a patent’s publication and its first forward citation—c… view at source ↗
Figure 1.7
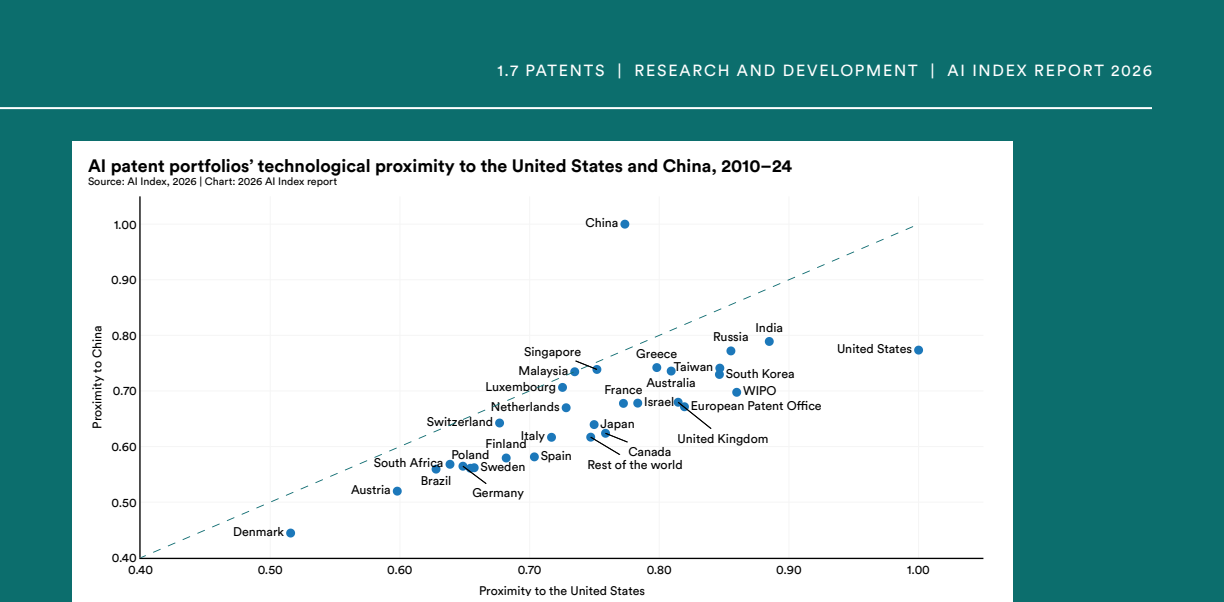
Figure 1.7. Figure 1.7: 640 Technological proximity41 measures whether countries are converging on similar types of AI innovation or pursuing distinct paths. Using a method proposed by Bar et al. (2012), the analysis42 compares how closely each country’s AI patent portfolio aligns with the two largest reference points, the United States and China ( [PITH_FULL_IMAGE:figures/full_fig_p061_1_7.png] view at source ↗
Figure 1.7
Figure 1.7. Figure 1.7: 7 HIGHLIGHT: AI Patent Examples 1 Patent CN111431996A: Resource configuration method and device, equipment and medium, 2022, China A machine-learning prediction model determines how to allocate computing resources across multiple services in a cluster. The system learns from historical and real-time signals—such as traffic volumes and CPU, memory, and network usage—to infer the right resource configurati… view at source ↗
Figure 1.8
Figure 1.8. Figure 1.8: 1 [PITH_FULL_IMAGE:figures/full_fig_p063_1_8.png] view at source ↗
Figure 1.8
Figure 1.8. Figure 1.8: 2 By Education Level The educational profile of top AI authors and inventors varies by country, though in most of the countries, PhD holders and those with master’s degrees together account for the majority in 2025 ( [PITH_FULL_IMAGE:figures/full_fig_p064_1_8.png] view at source ↗
Figure 1.8
Figure 1.8. Figure 1.8: 3 [PITH_FULL_IMAGE:figures/full_fig_p065_1_8.png] view at source ↗
Figure 1.8
Figure 1.8. Figure 1.8: 4 [PITH_FULL_IMAGE:figures/full_fig_p066_1_8.png] view at source ↗
Figure 1.8
Figure 1.8. Figure 1.8: 5 [PITH_FULL_IMAGE:figures/full_fig_p067_1_8.png] view at source ↗
Figure 1.8
Figure 1.8. Figure 1.8: 644 44 Asterisks indicate that a country’s y-axis label is scaled differently than the y-axis label for the other countries [PITH_FULL_IMAGE:figures/full_fig_p068_1_8.png] view at source ↗
Figure 2.1
Figure 2.1. Figure 2.1: 11 1 In [PITH_FULL_IMAGE:figures/full_fig_p076_2_1.png] view at source ↗
Figure 2.1
Figure 2.1. Figure 2.1: 22 [PITH_FULL_IMAGE:figures/full_fig_p077_2_1.png] view at source ↗
Figure 2.1
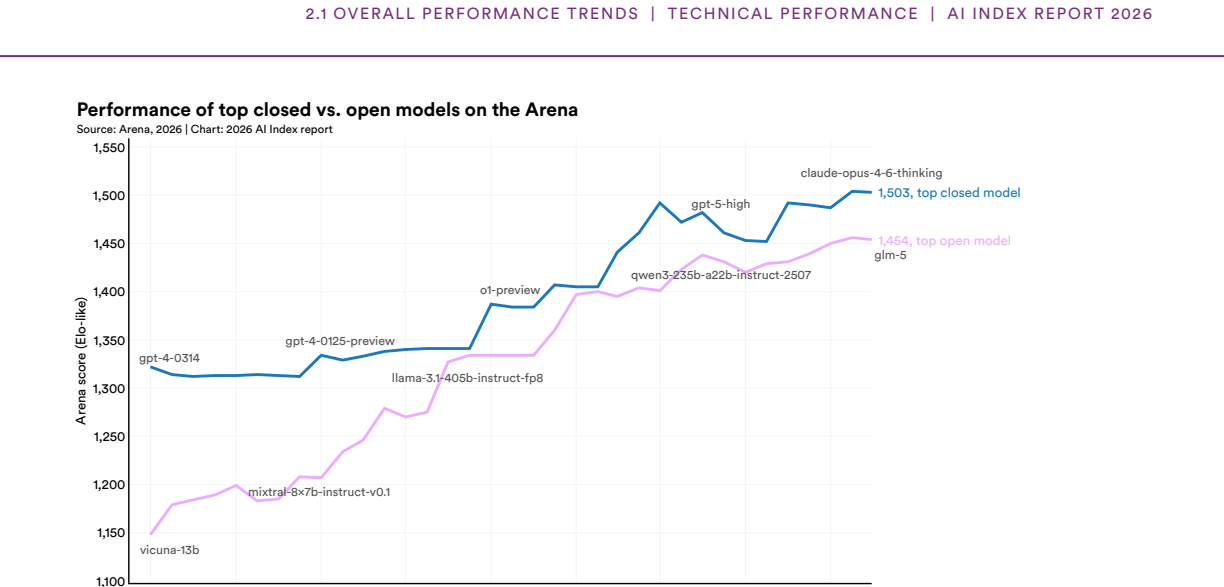
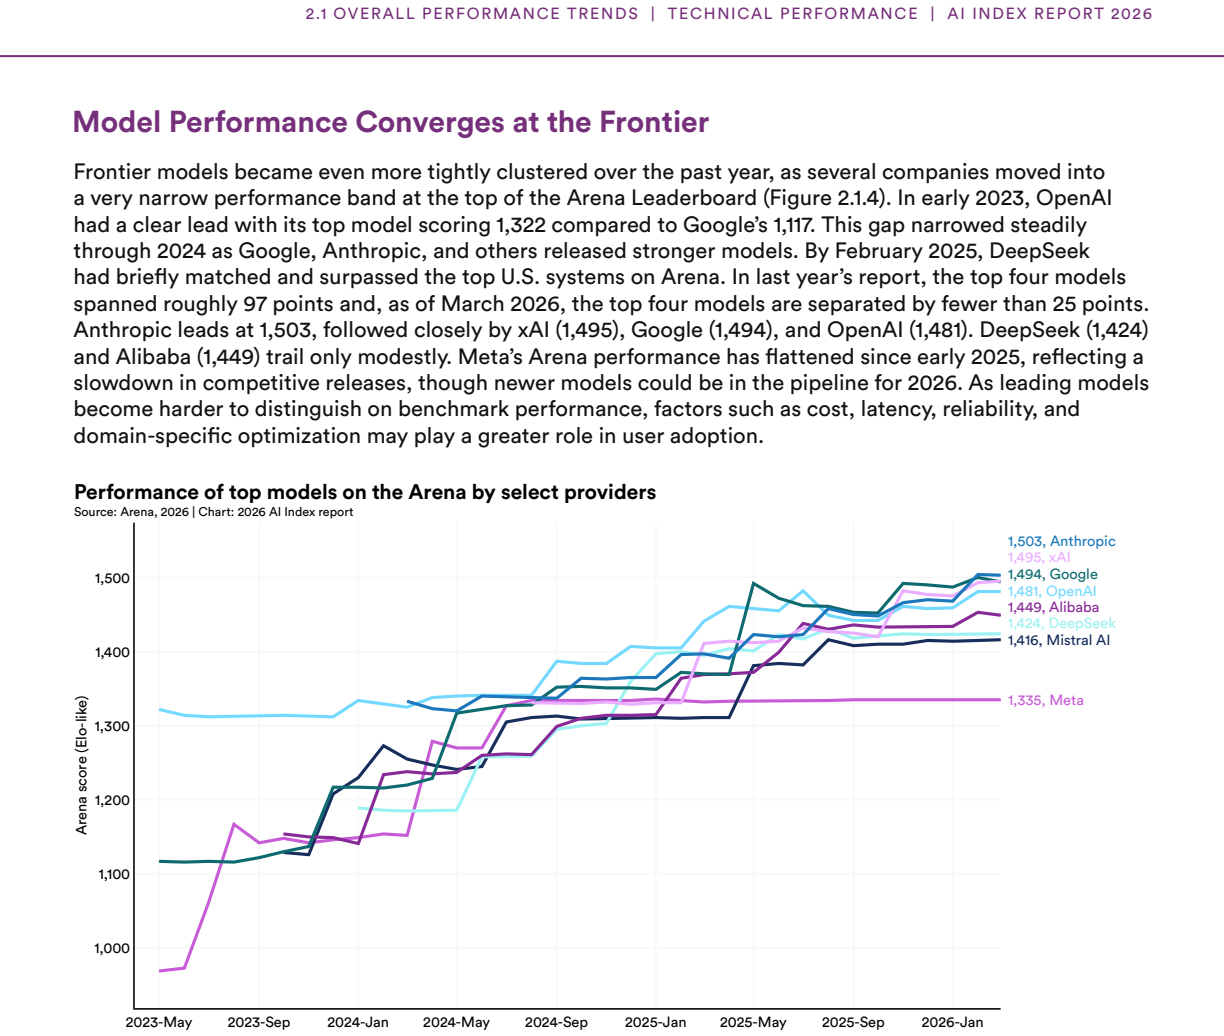
Figure 2.1. Figure 2.1: 44 4 Source: the Arena historical leaderboard (Public, Style Control On), exported in March 2026. 2.1 OVERALL PERFORMANCE TRENDS | TECHNICAL PERFORMANCE | AI INDEX REPORT 2026 Frontier models became even more tightly clustered over the past year, as several companies moved into a very narrow performance band at the top of the Arena Leaderboard ( [PITH_FULL_IMAGE:figures/full_fig_p078_2_1.png] view at source ↗
Figure 2.1
Figure 2.1. Figure 2.1: 5 [PITH_FULL_IMAGE:figures/full_fig_p079_2_1.png] view at source ↗
Figure 2.2
Figure 2.2. Figure 2.2: 15 5 Source: https://huggingface.co/spaces/TIGER-Lab/MMLU-Pro. Generation benchmarks focus on the quality of model outputs, looking at clarity, helpfulness, instruction￾following, and style. Unlike knowledge-style tests, these evaluations often depend on human judgment since some dimensions are subjective and dependent on both the prompt and the user. Preference-based tests help measure that subjectivity… view at source ↗
Figure 2.2
Figure 2.2. Figure 2.2: 26 6 Source: https://arena.ai/leaderboard/text. Beyond general understanding and generation, language models need to handle tasks that make them usable for practical deployment. Three key capabilities in deployed applications are retrieval-augmented generation (RAG), function calling, and text embedding. Benchmarks used to track these capabilities are particularly useful because they test fluency and whe… view at source ↗
Figure 2.2
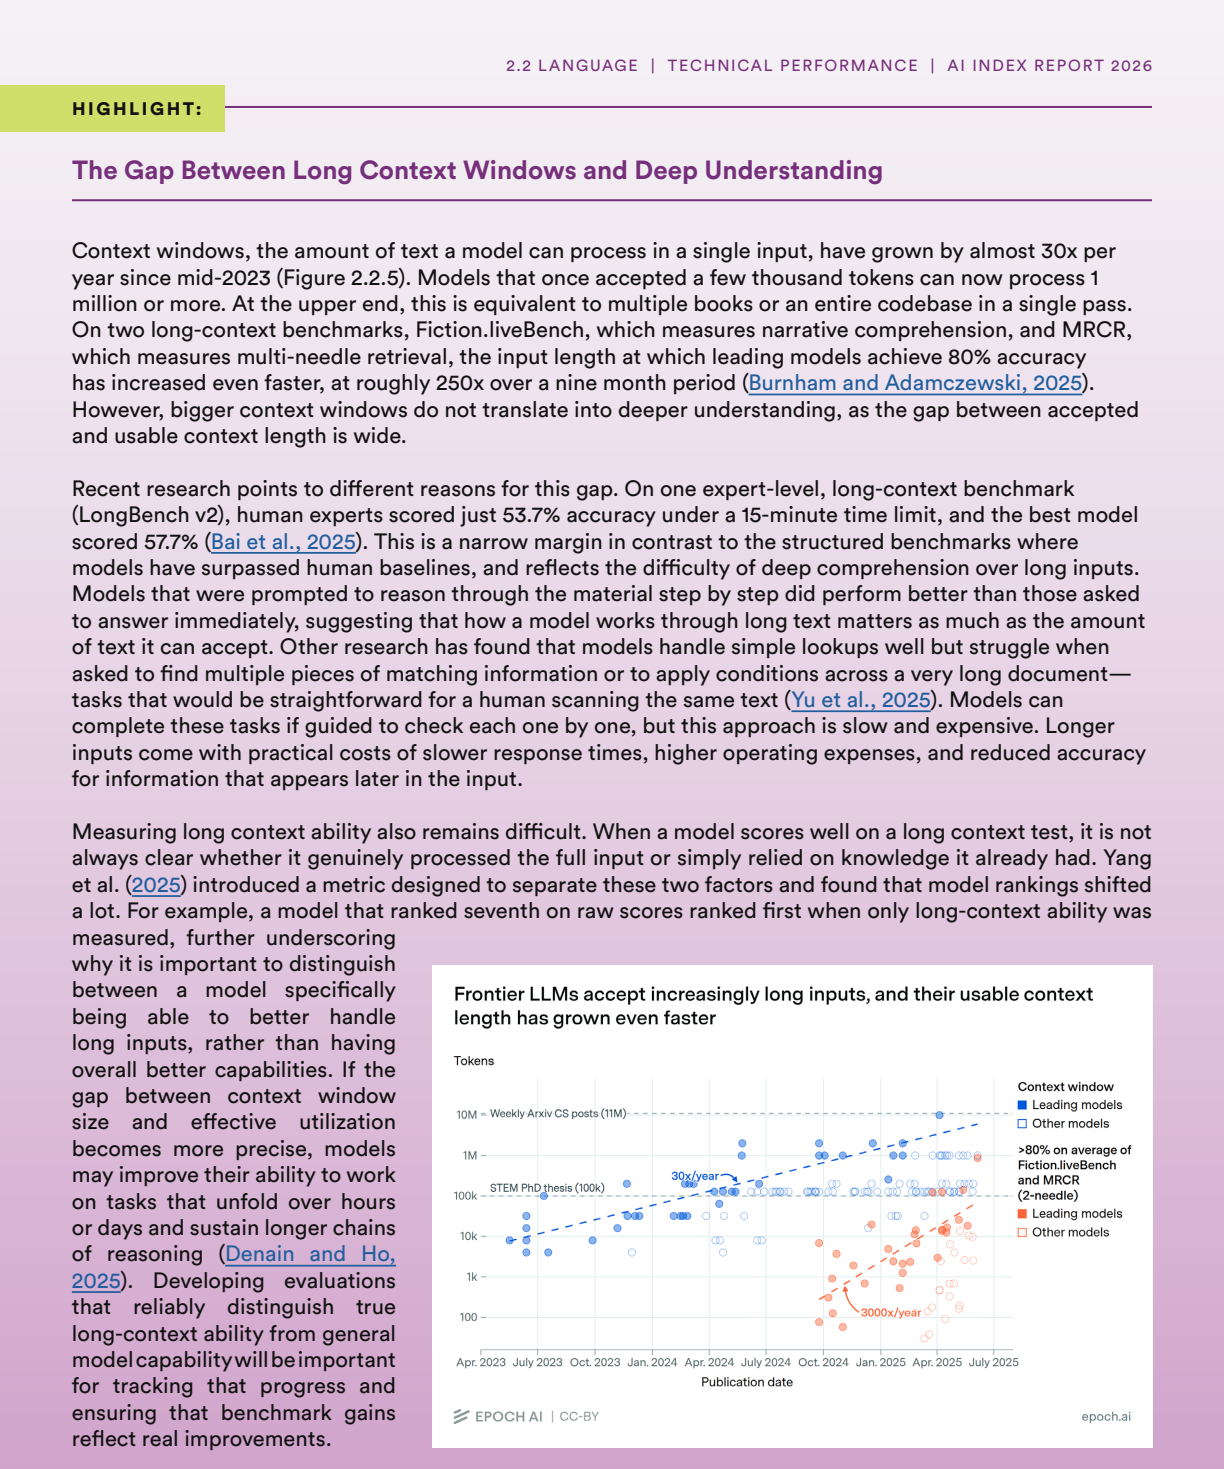
Figure 2.2. Figure 2.2: 37 7 Source: https://gorilla.cs.berkeley.edu/leaderboard.html [PITH_FULL_IMAGE:figures/full_fig_p084_2_2.png] view at source ↗
Figure 2.2
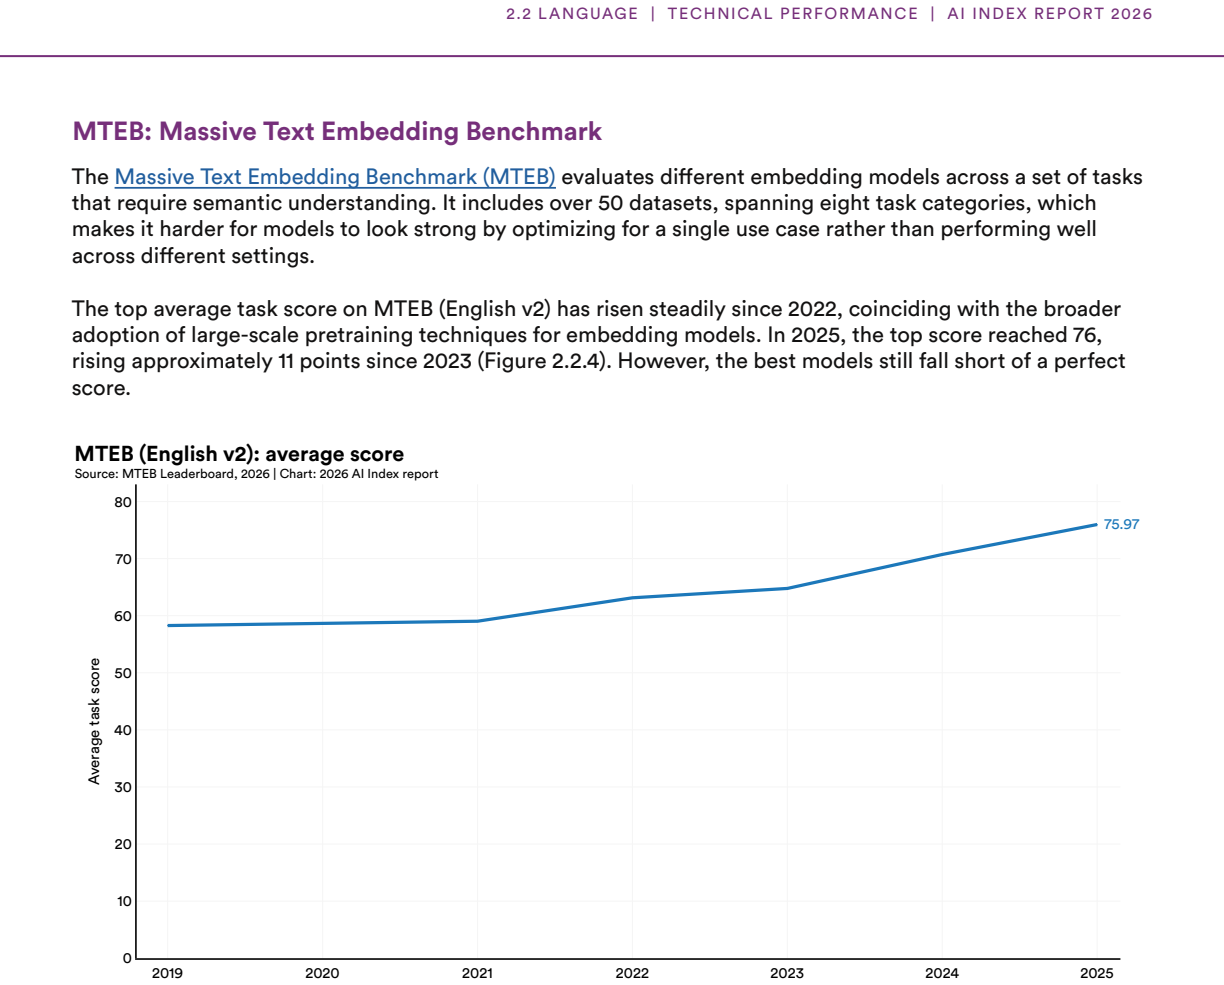
Figure 2.2. Figure 2.2: 48 8 Source: https://mteb-leaderboard.hf.space/?benchmark_name=MTEB%28eng%2C+v1%29 https://arxiv.org/abs/2502.13595 [PITH_FULL_IMAGE:figures/full_fig_p085_2_2.png] view at source ↗
Figure 2.2
Figure 2.2. Figure 2.2: 5 [PITH_FULL_IMAGE:figures/full_fig_p086_2_2.png] view at source ↗
Figure 2.3
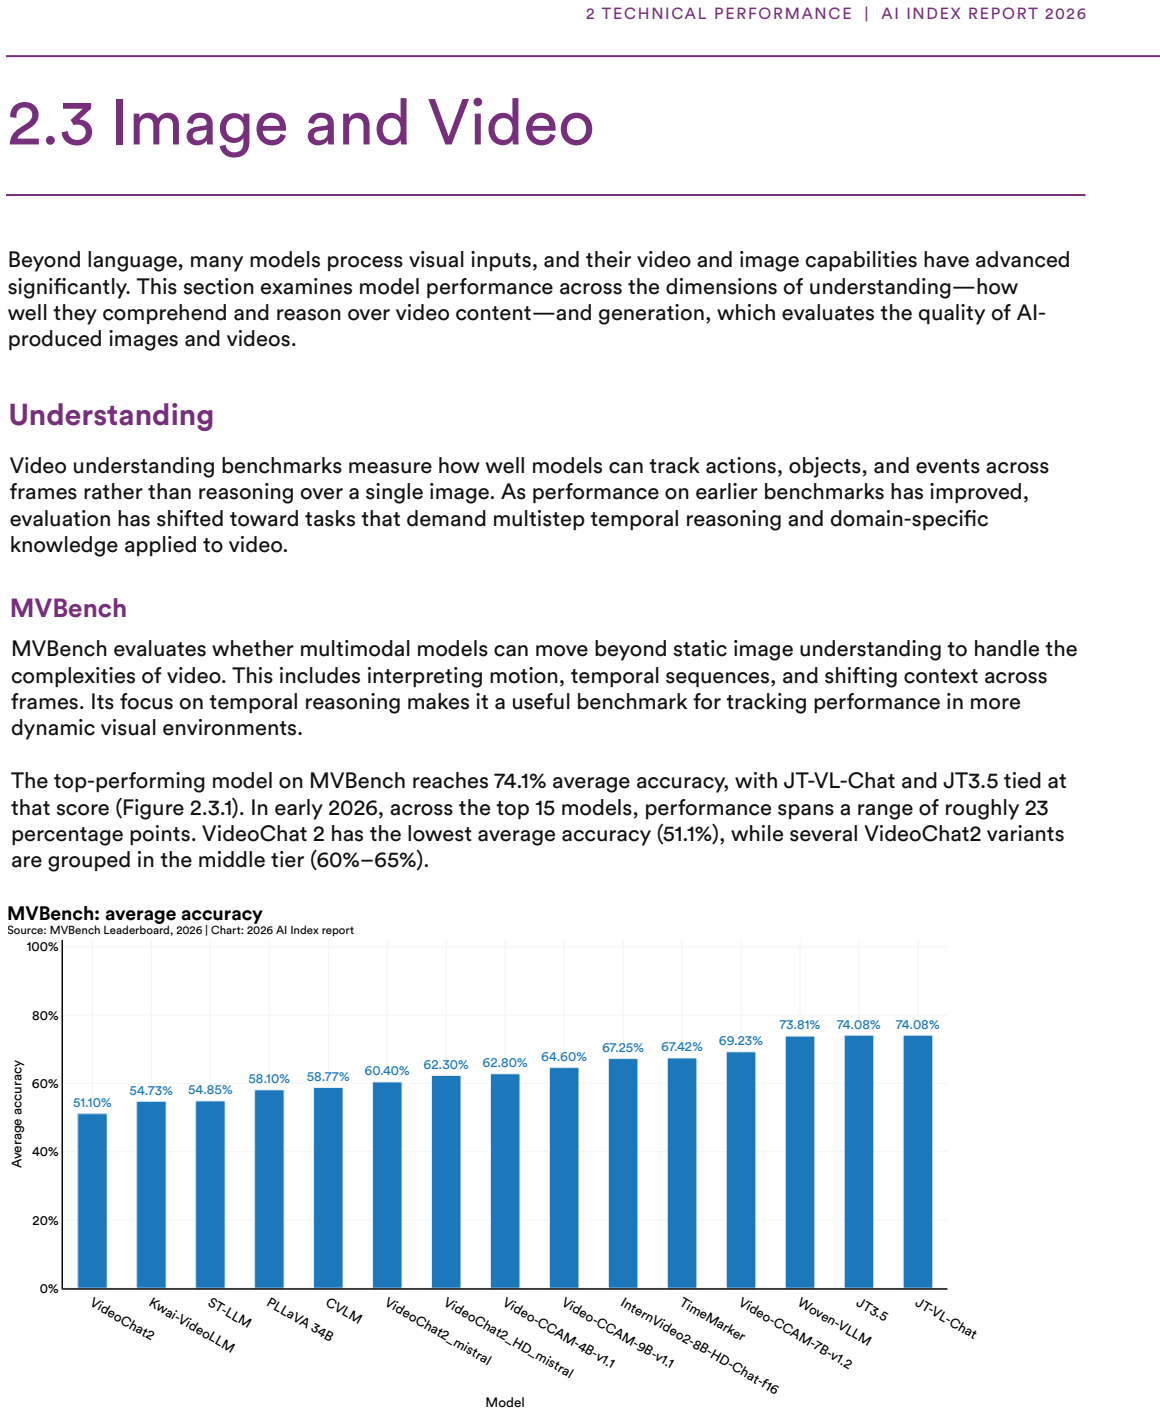
Figure 2.3. Figure 2.3: 19 9 Source: https://huggingface.co/spaces/OpenGVLab/MVBench_Leaderboard [PITH_FULL_IMAGE:figures/full_fig_p087_2_3.png] view at source ↗
Figure 2.3
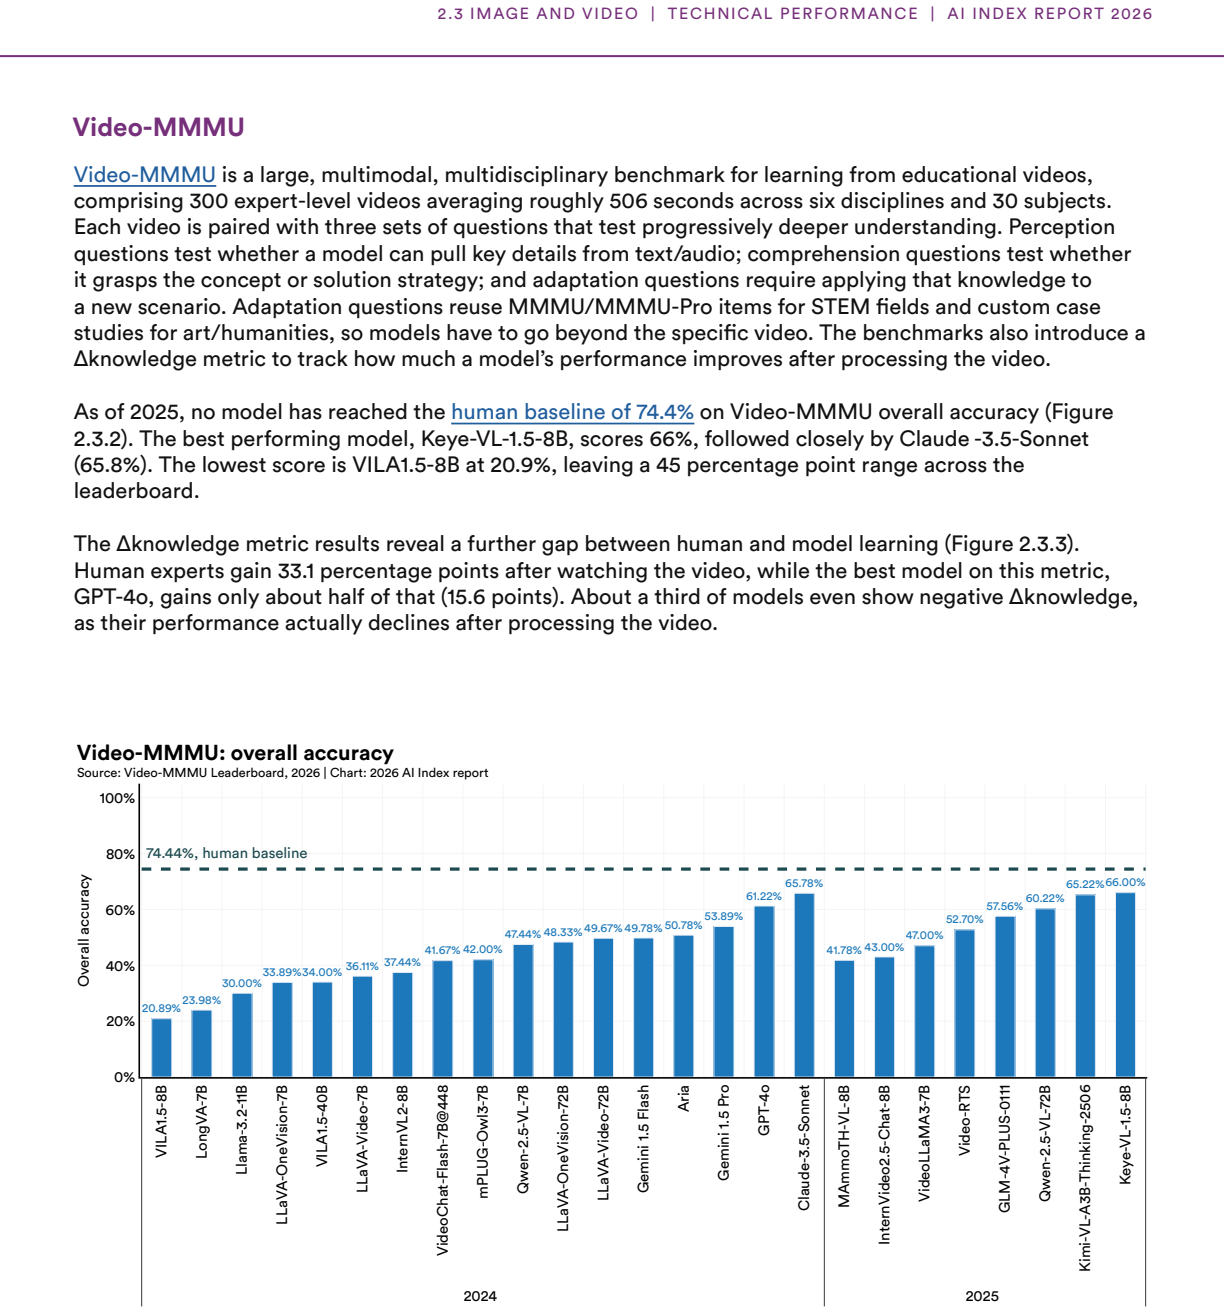
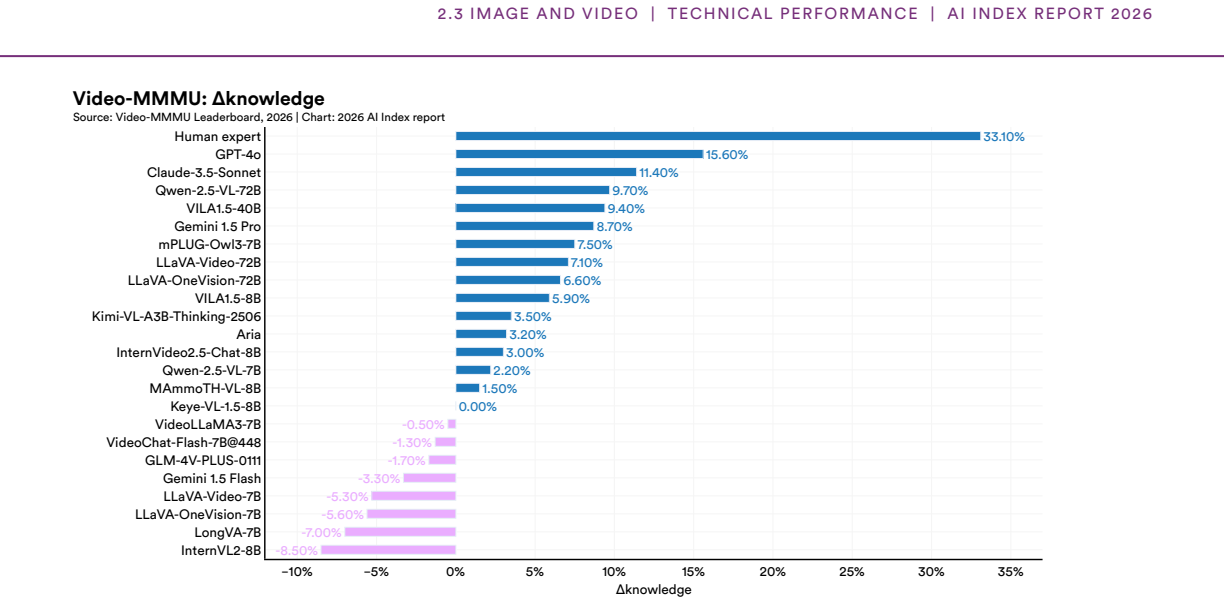
Figure 2.3. Figure 2.3: 210 10 Source: https://videommmu.github.io/#Leaderboard [PITH_FULL_IMAGE:figures/full_fig_p088_2_3.png] view at source ↗
Figure 2.3
Figure 2.3. Figure 2.3: 3 [PITH_FULL_IMAGE:figures/full_fig_p089_2_3.png] view at source ↗
Figure 2.3
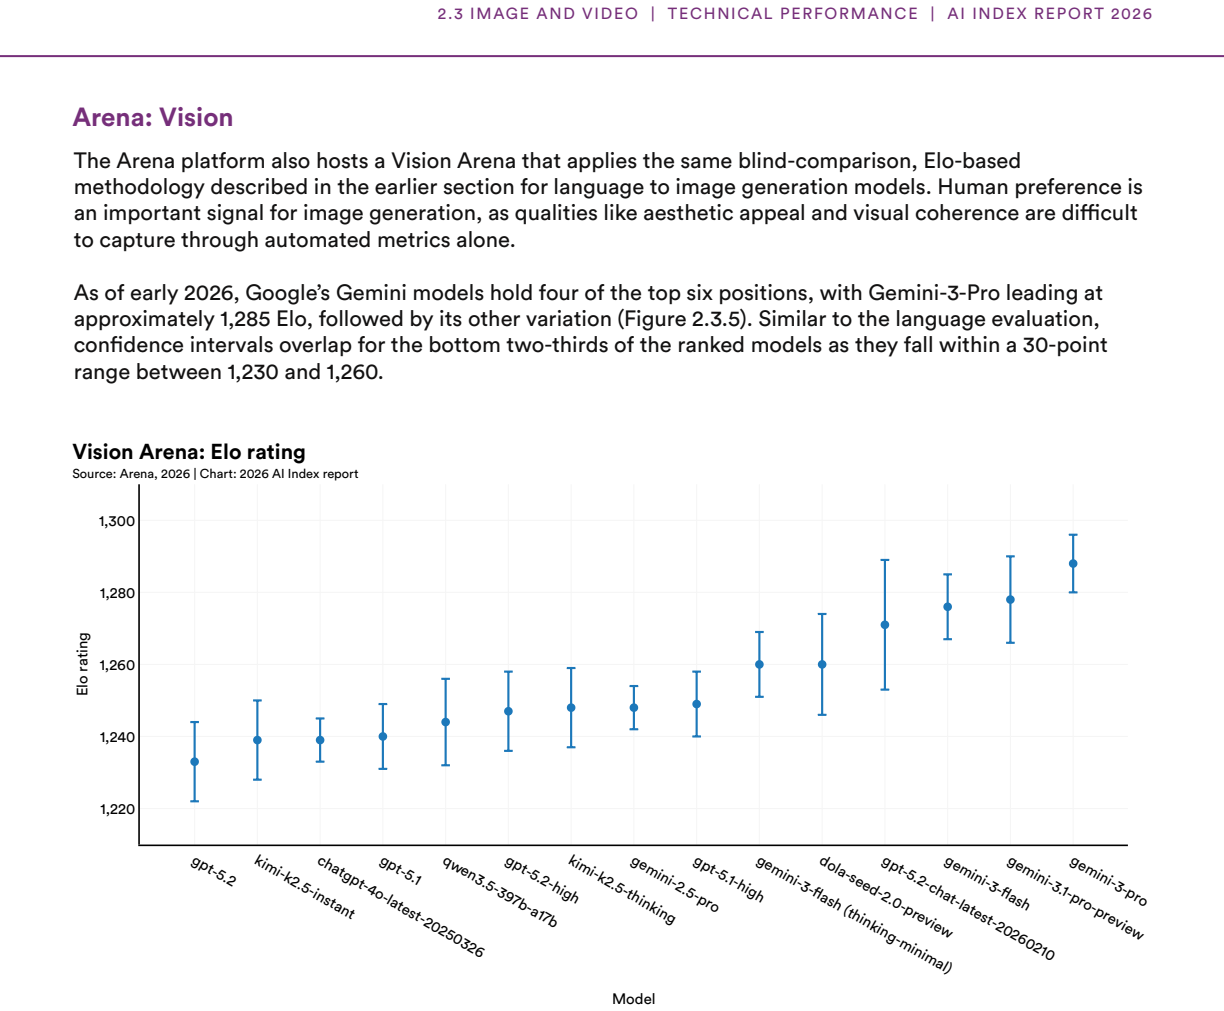
Figure 2.3. Figure 2.3: 511 11 This chart shows only the top 15 models as of February 2026; source: https://arena.ai/leaderboard/vision. 2.3 IMAGE AND VIDEO | TECHNICAL PERFORMANCE | AI INDEX REPORT 2026 The Arena platform also hosts a Vision Arena that applies the same blind-comparison, Elo-based methodology described in the earlier section for language to image generation models. Human preference is an important signal for im… view at source ↗
Figure 2.3
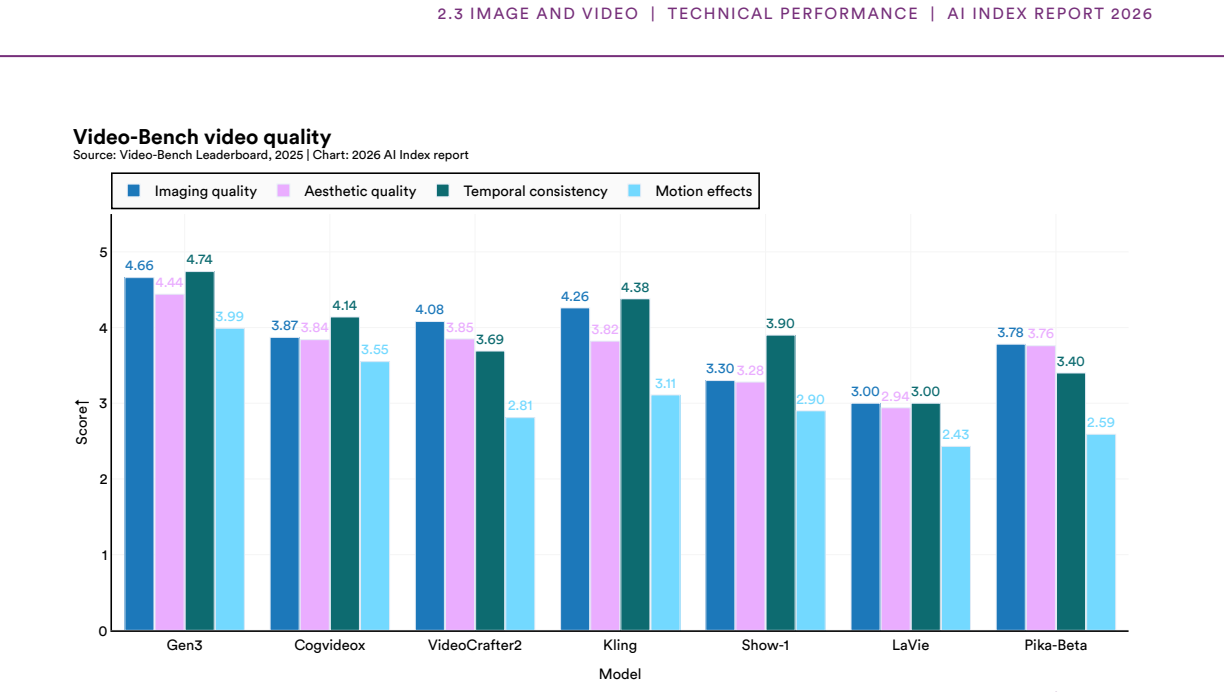
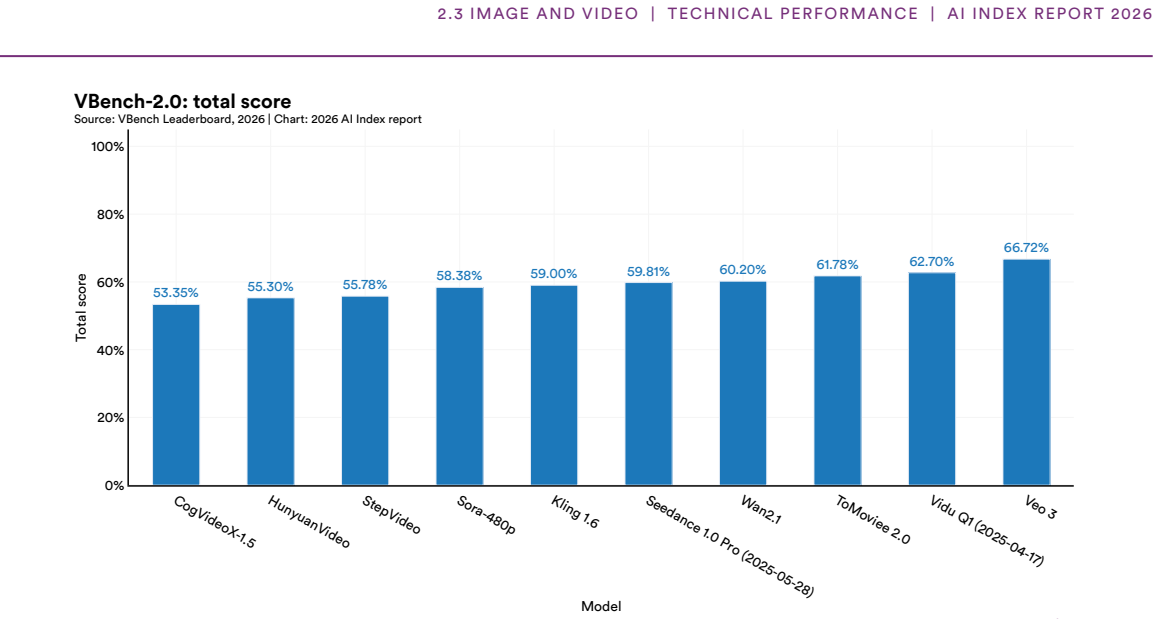
Figure 2.3. Figure 2.3: 612 12 Source: https://github.com/Video-Bench/Video-Bench?tab=readme-ov-file#leaderboard. VBench-2.0 is a comprehensive, human-aligned benchmark for evaluating video generation models on intrinsic faithfulness, defined as well-rounded adherence to reality rather than simply being visually convincing. It scores models across five broad dimensions (Human Fidelity, Creativity, Controllability, Physics, and … view at source ↗
Figure 2.3
Figure 2.3. Figure 2.3: 713 13 Source: https://huggingface.co/spaces/Vchitect/VBench_Leaderboard. 2.3 IMAGE AND VIDEO | TECHNICAL PERFORMANCE | AI INDEX REPORT 2026 53.35% 55.30% 55.78% 58.38% 59.00% 59.81% 60.20% 61.78% 62.70% 66.72% CogVideoX-1.5 HunyuanVideo StepVideo Sora-480p Kling 1.6 Seedance 1.0 Pro (2025-05-28) Wan2.1 ToMoviee 2.0 Vidu Q1 (2025-04-17) Veo 3 0% 20% 40% 60% 80% 100% Model Total score VBench-2.0: total sc… view at source ↗
Figure 2.4
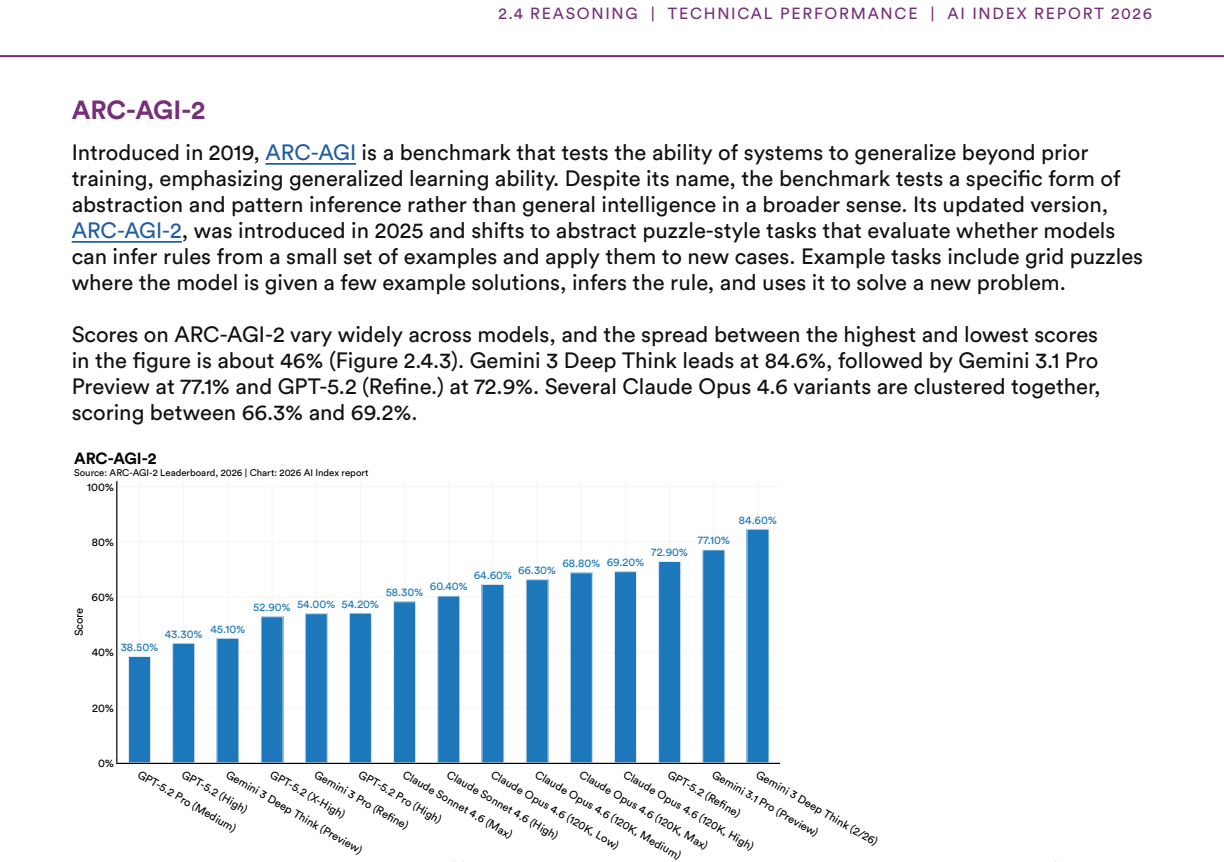
Figure 2.4. Figure 2.4: 114 [PITH_FULL_IMAGE:figures/full_fig_p094_2_4.png] view at source ↗
Figure 2.4
Figure 2.4. Figure 2.4: 316 [PITH_FULL_IMAGE:figures/full_fig_p095_2_4.png] view at source ↗
Figure 2.4
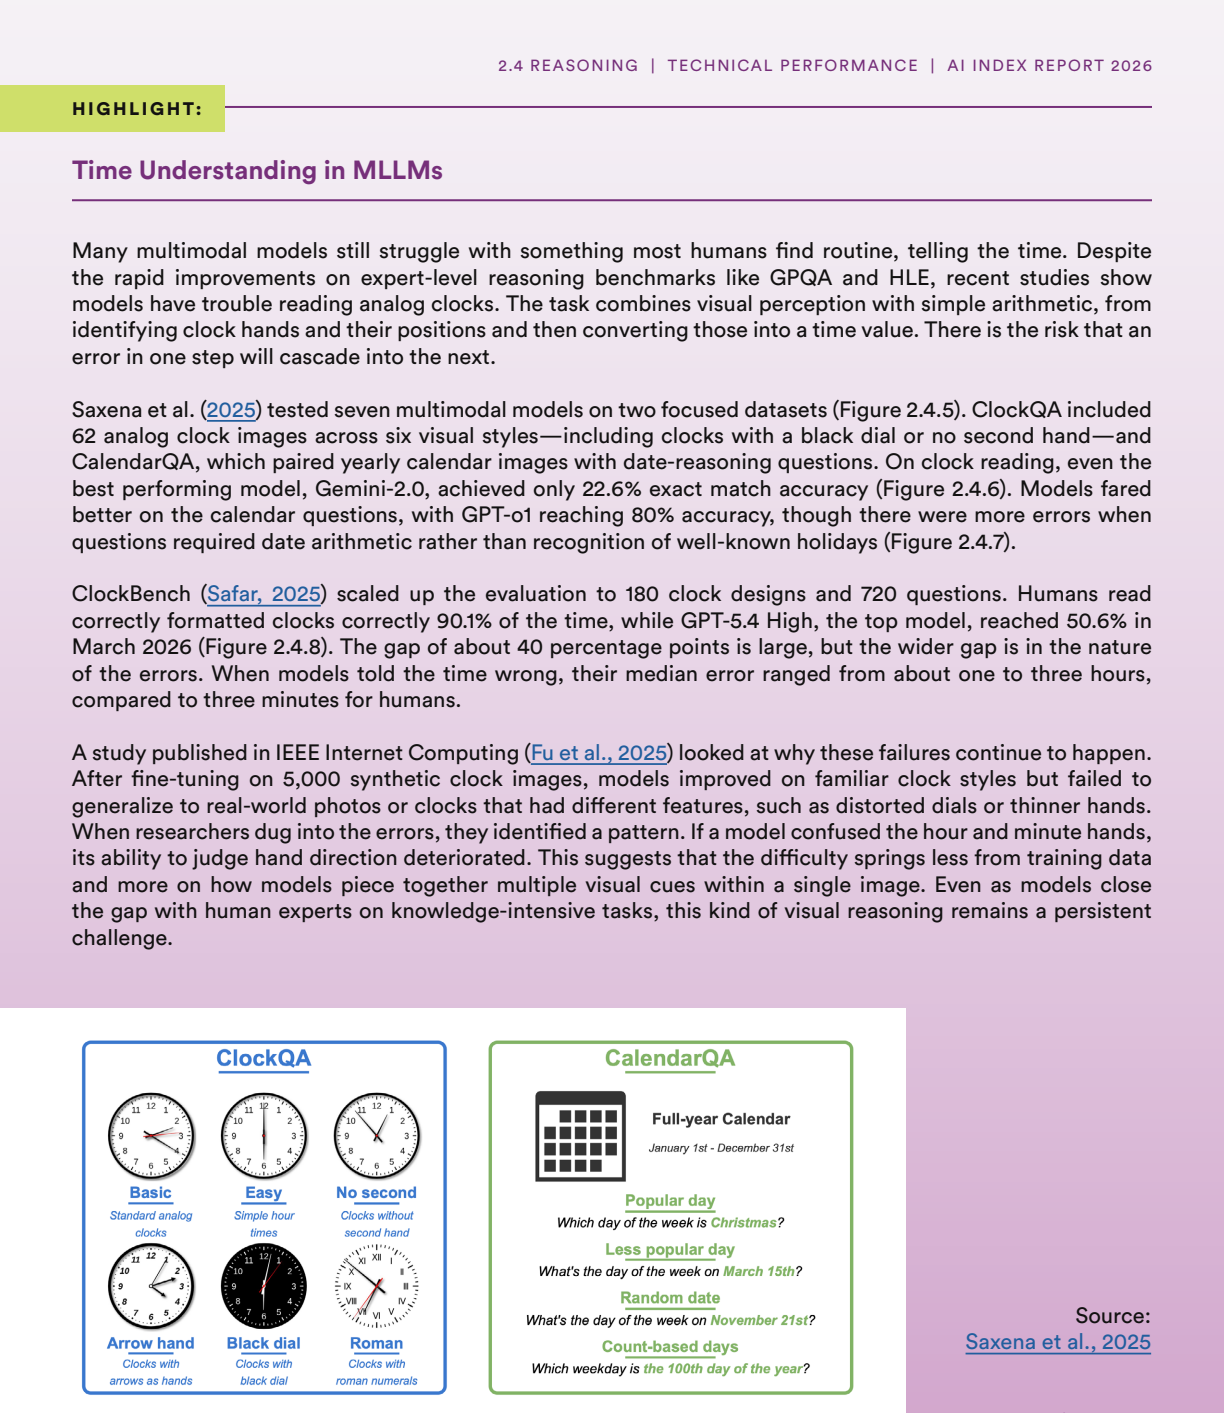
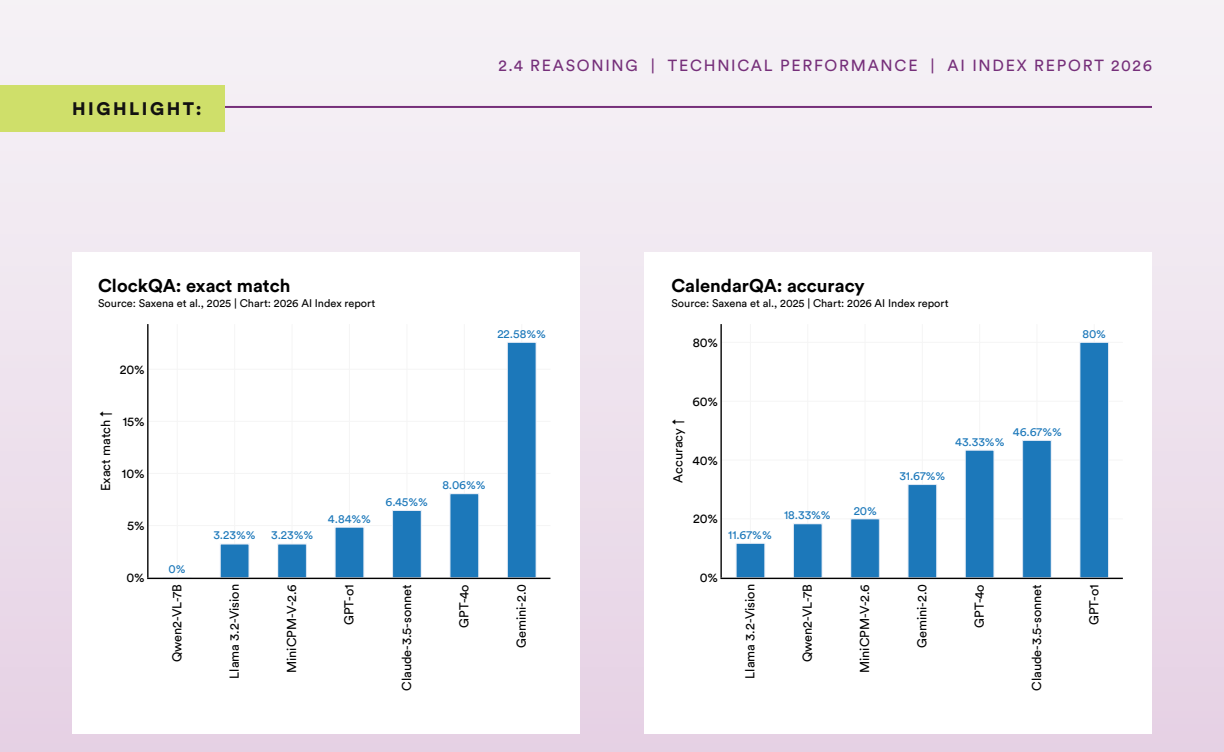
Figure 2.4. Figure 2.4: 5 [PITH_FULL_IMAGE:figures/full_fig_p096_2_4.png] view at source ↗
Figure 2.4
Figure 2.4. Figure 2.4: 6 [PITH_FULL_IMAGE:figures/full_fig_p097_2_4.png] view at source ↗
Figure 2.4
Figure 2.4. Figure 2.4: 919 [PITH_FULL_IMAGE:figures/full_fig_p099_2_4.png] view at source ↗
Figure 2.5
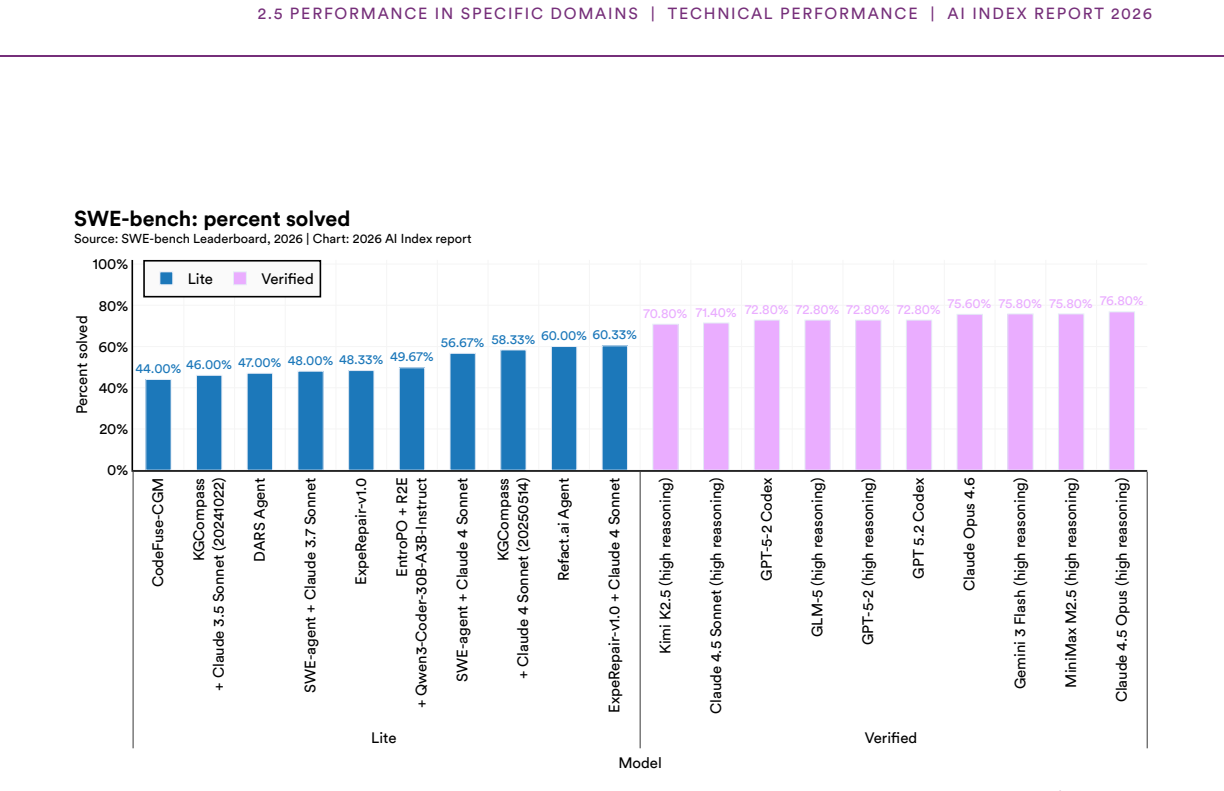
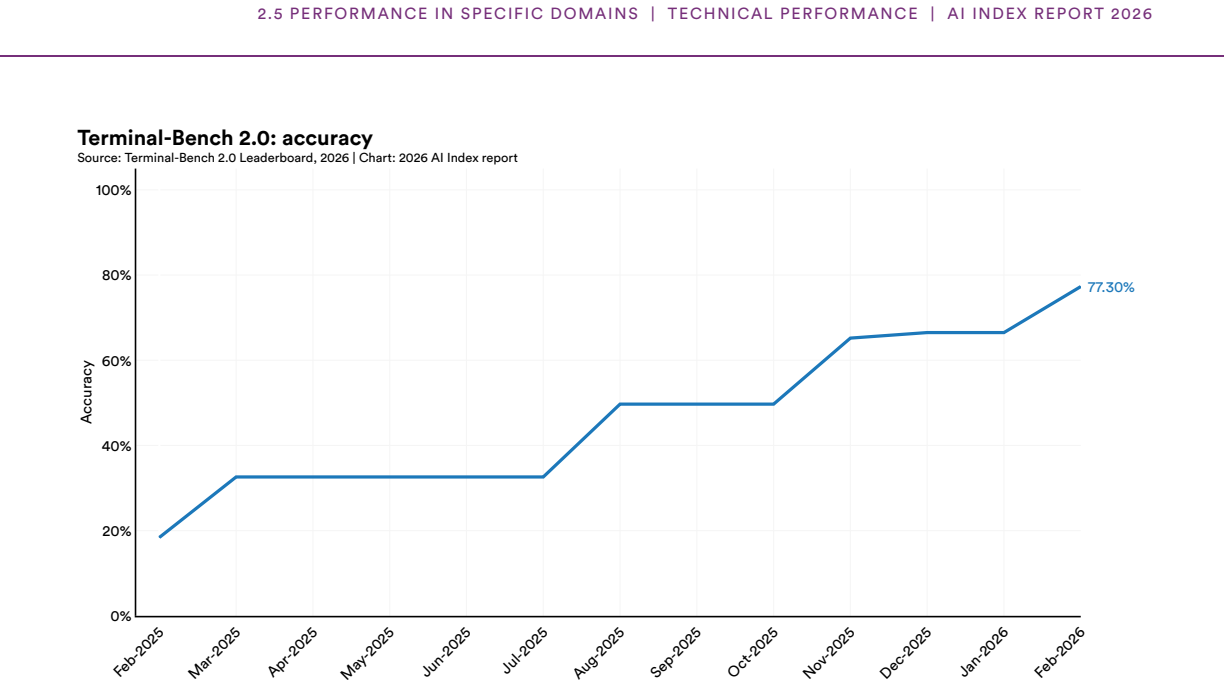
Figure 2.5. Figure 2.5: 121 21 This chart shows the top 10 models for SWE-bench Verified and Lite as of February 2026. For Verified, only results using the mini-SWE-agent-v2 filter are included. This means all models were tested under the same agent workflow, so differences in scores reflect the underlying model rather than differences in the surrounding system. Data source: https://www.swebench.com/index.html. Terminal-Bench i… view at source ↗
Figure 2.5
Figure 2.5. Figure 2.5: 222 [PITH_FULL_IMAGE:figures/full_fig_p102_2_5.png] view at source ↗
Figure 2.5
Figure 2.5. Figure 2.5: 424 [PITH_FULL_IMAGE:figures/full_fig_p103_2_5.png] view at source ↗
Figure 2.5
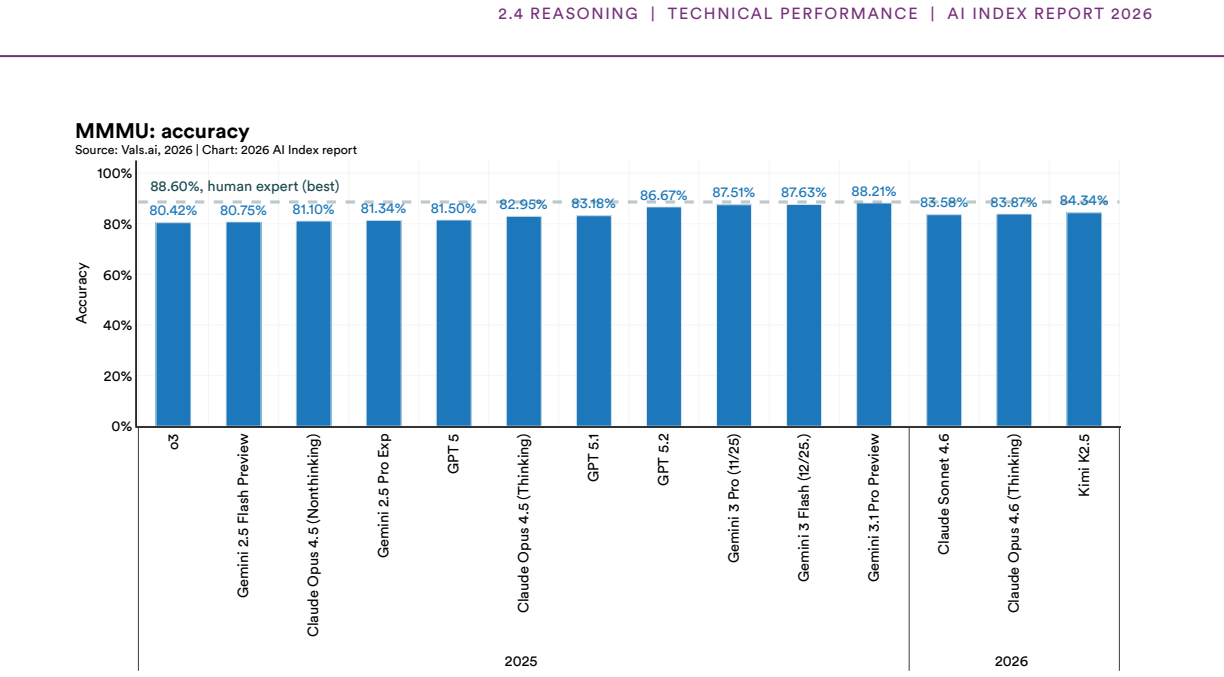
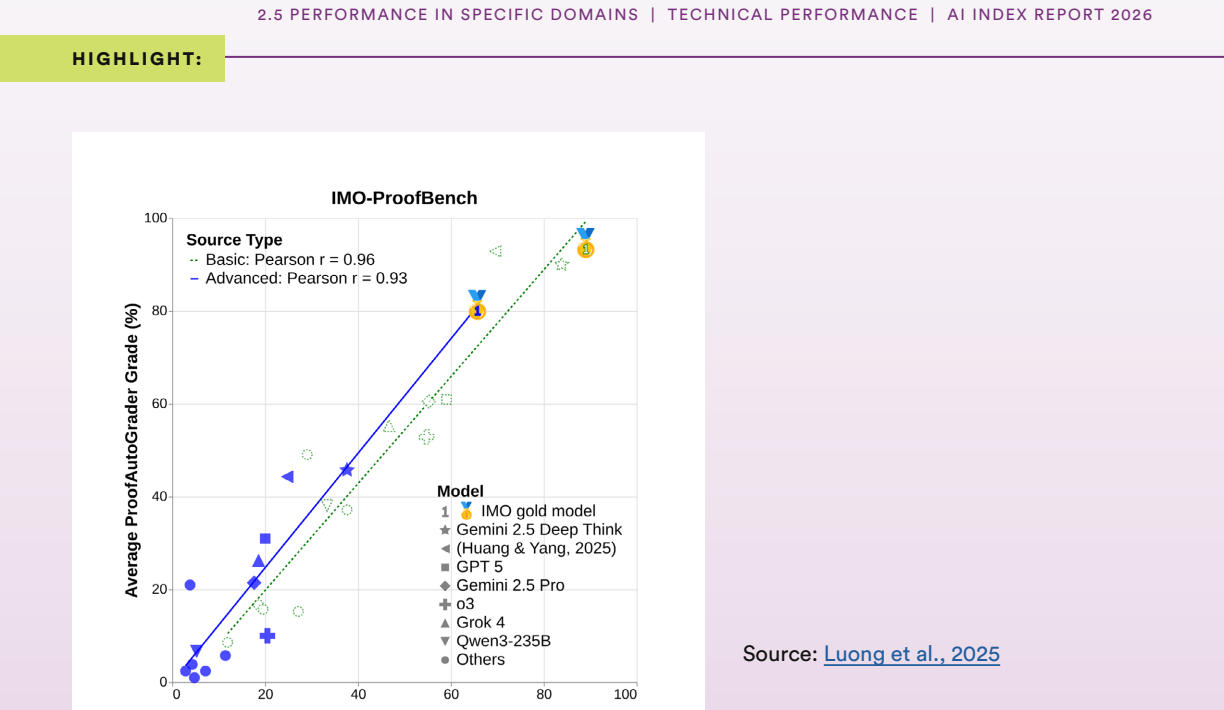
Figure 2.5. Figure 2.5: 726 26 Data source: https://imobench.github.io/. GPT-5.1 Grok 4.1 Fast Reasoning Claude Opus 4.5 GPT-5 Pro Gemini 3 Pro GPT-5.2 Thinking (high) Gemini Deep Think (IMO Gold) Gemini 3 Deep Think Aletheia 0% 20% 40% 60% 80% 100% Score 7.1% 18.6% 23.8% 28.6% 30% 35.7% 65.7% 76.7% 91.9% IMO-ProofBench Source: IMO-ProofBench Leaderboard, 2026 | Chart: 2026 AI Index report [PITH_FULL_IMAGE:figures/full_fig_p10… view at source ↗
Figure 2.5
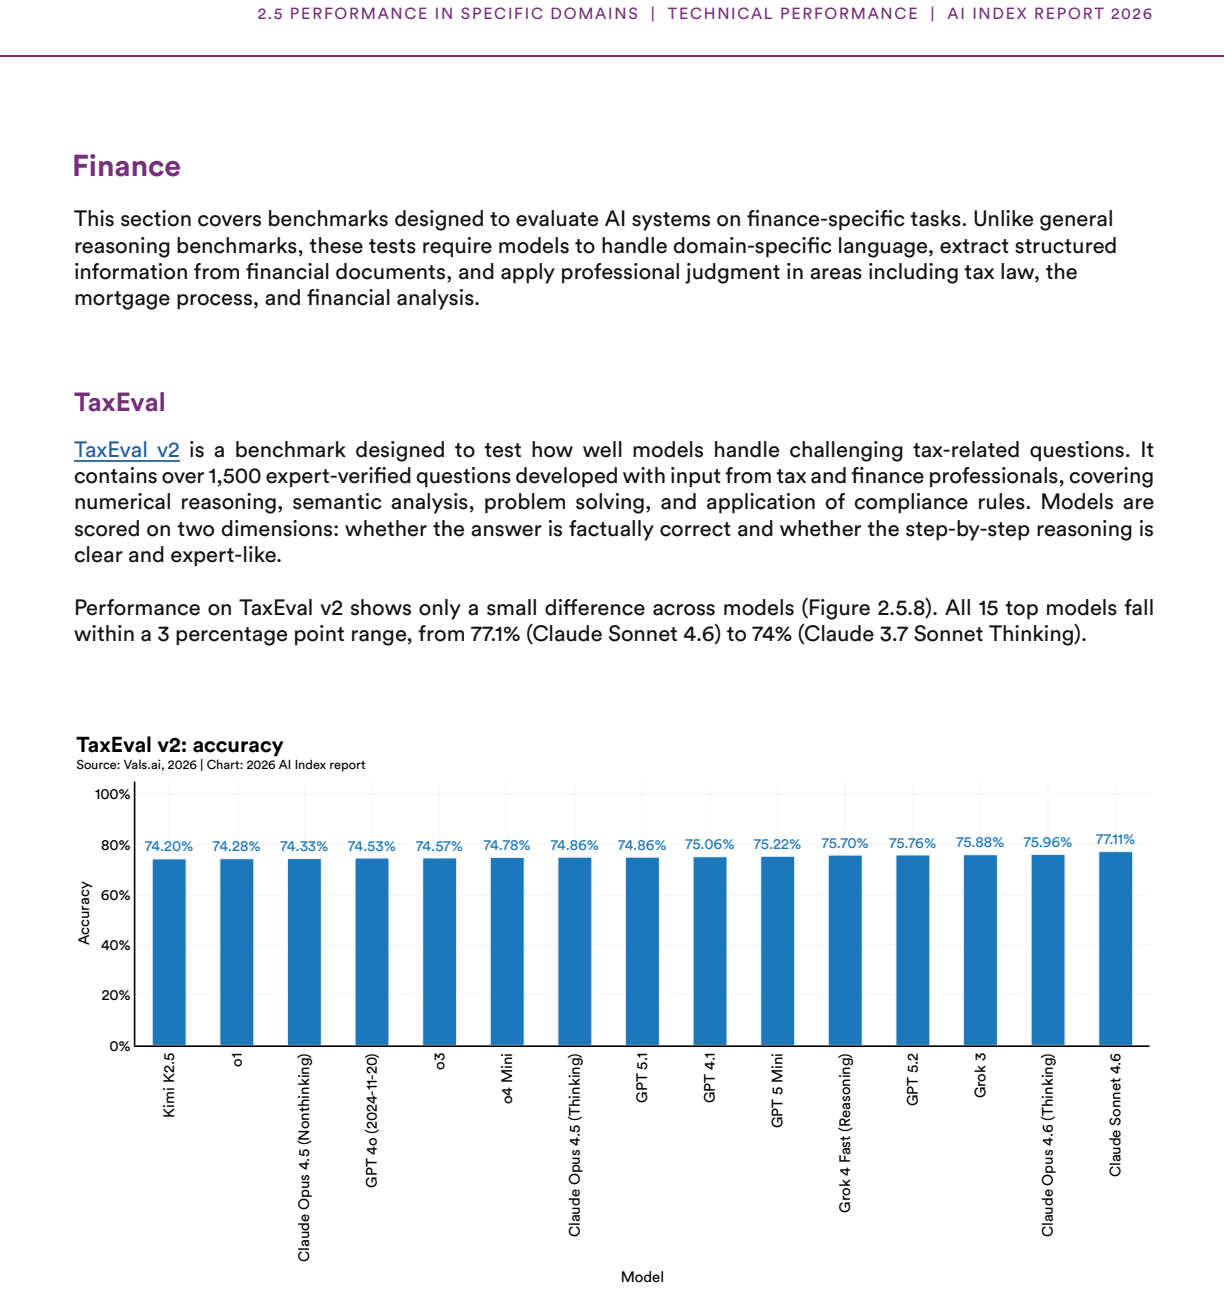
Figure 2.5. Figure 2.5: 827 27 Data source: https://www.vals.ai/benchmarks/tax_eval_v2 [PITH_FULL_IMAGE:figures/full_fig_p106_2_5.png] view at source ↗
Figure 2.5
Figure 2.5. Figure 2.5: 928 28 Data source: https://www.vals.ai/benchmarks/mortgage_tax [PITH_FULL_IMAGE:figures/full_fig_p107_2_5.png] view at source ↗
Figure 2.5
Figure 2.5. Figure 2.5: 1029 29 Data source: https://www.vals.ai/benchmarks/corp_fin_v2 [PITH_FULL_IMAGE:figures/full_fig_p108_2_5.png] view at source ↗
Figure 2.5
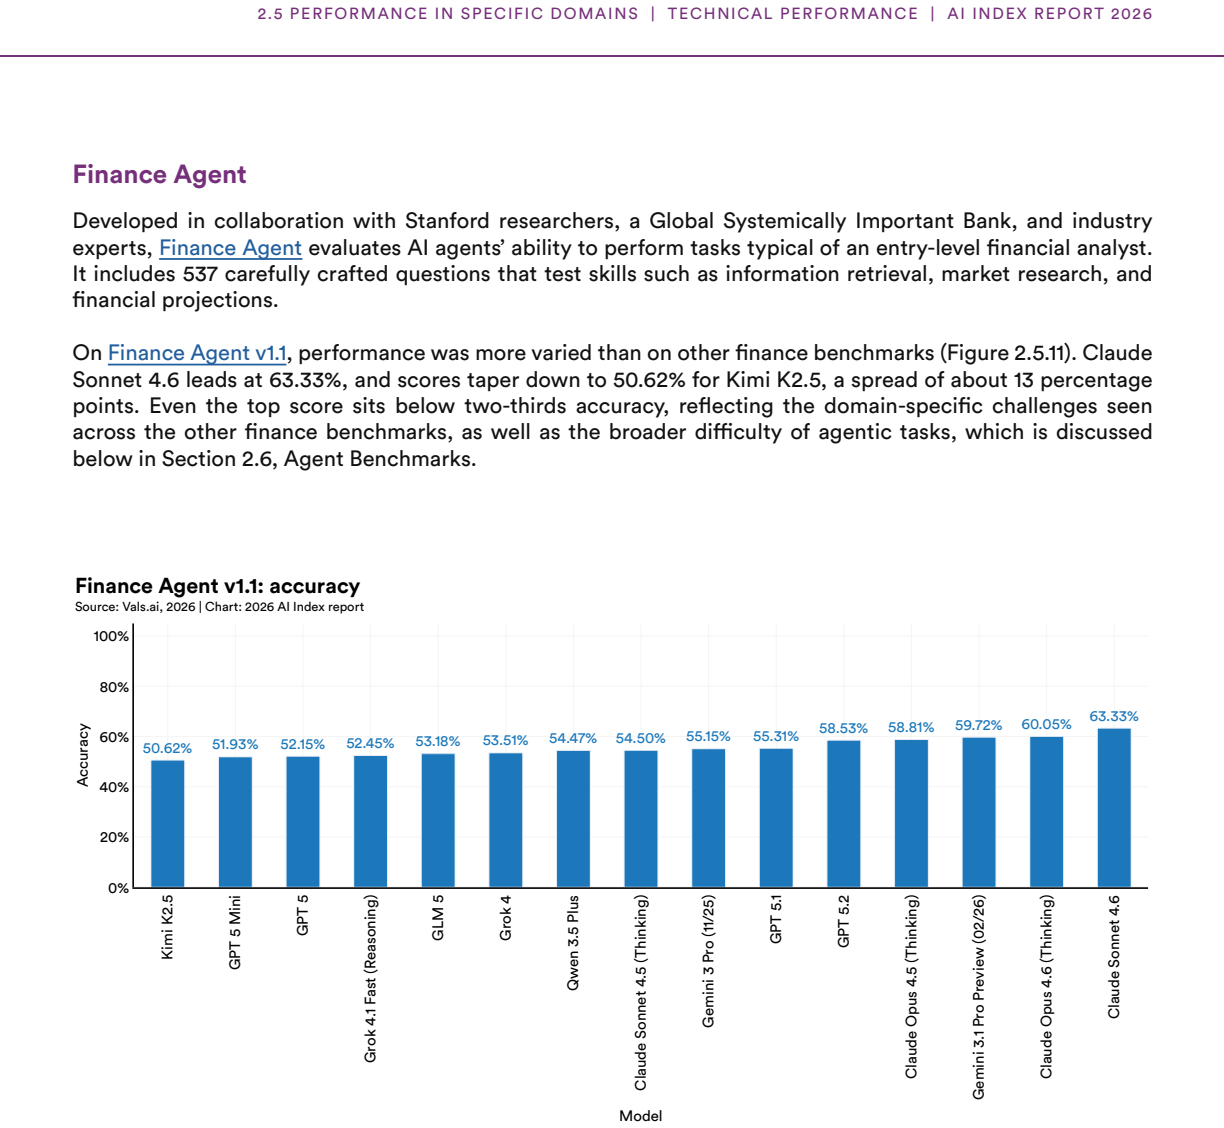
Figure 2.5. Figure 2.5: 1130 30 Data source: https://www.vals.ai/benchmarks/finance_agent [PITH_FULL_IMAGE:figures/full_fig_p109_2_5.png] view at source ↗
Figure 2.5
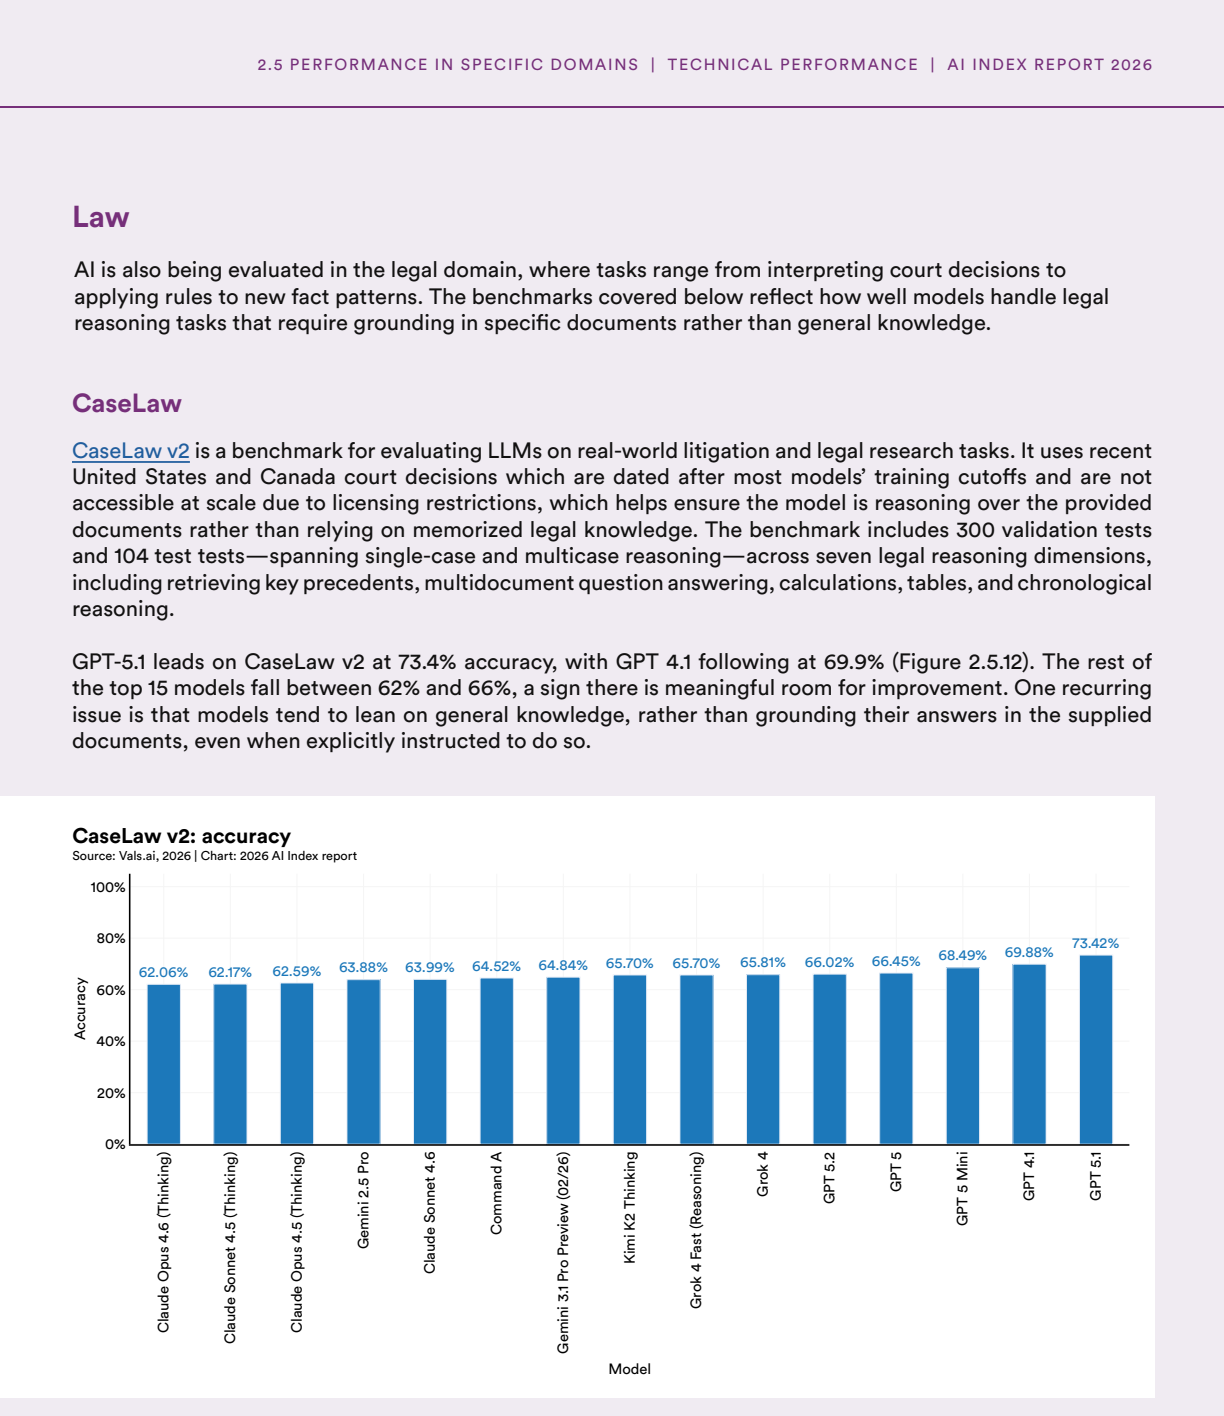
Figure 2.5. Figure 2.5: 1231 31 Data source: https://www.vals.ai/benchmarks/case_law_v2 [PITH_FULL_IMAGE:figures/full_fig_p110_2_5.png] view at source ↗
Figure 2.5
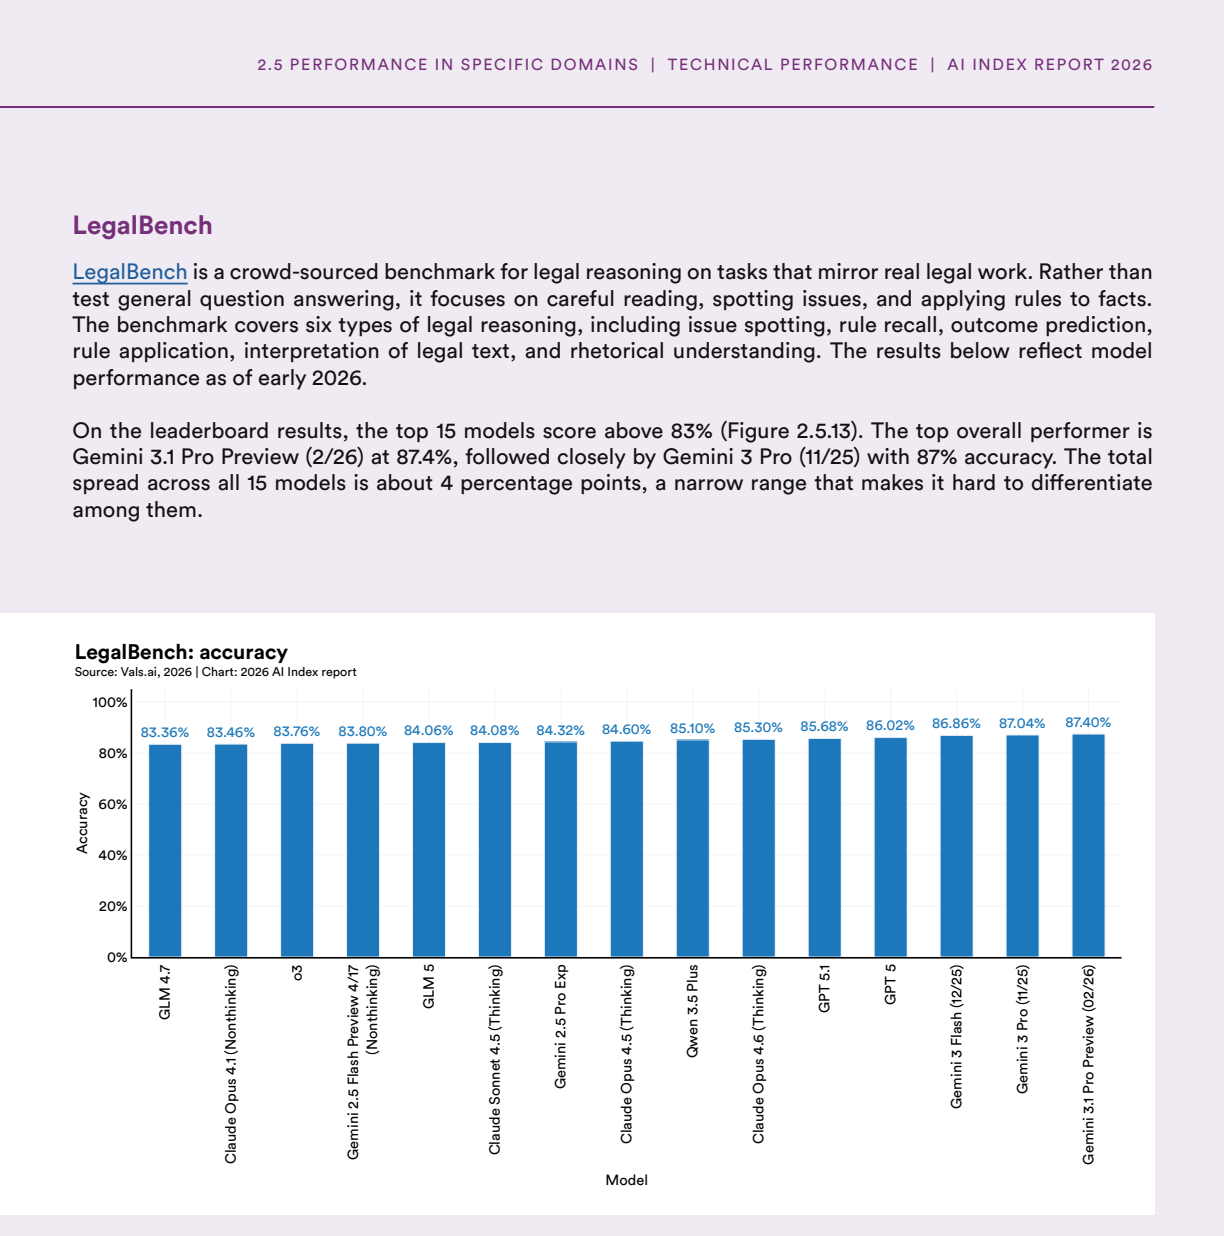
Figure 2.5. Figure 2.5: 1332 32 Data source: https://www.vals.ai/benchmarks/legal_bench. 83.36% 83.46% 83.76% 83.80% 84.06% 84.08% 84.32% 84.60% 85.10% 85.30% 85.68% 86.02% 86.86% 87.04% 87.40% GLM 4.7 Claude Opus 4.1 (Nonthinking) o3 Gemini 2.5 Flash Preview 4/17 (Nonthinking) GLM 5 Claude Sonnet 4.5 (Thinking) Gemini 2.5 Pro Exp Claude Opus 4.5 (Thinking) Q wen 3.5 Plus Claude Opus 4.6 (Thinking) GPT 5.1 GPT 5 Gemini 3 Flash … view at source ↗
Figure 2.6
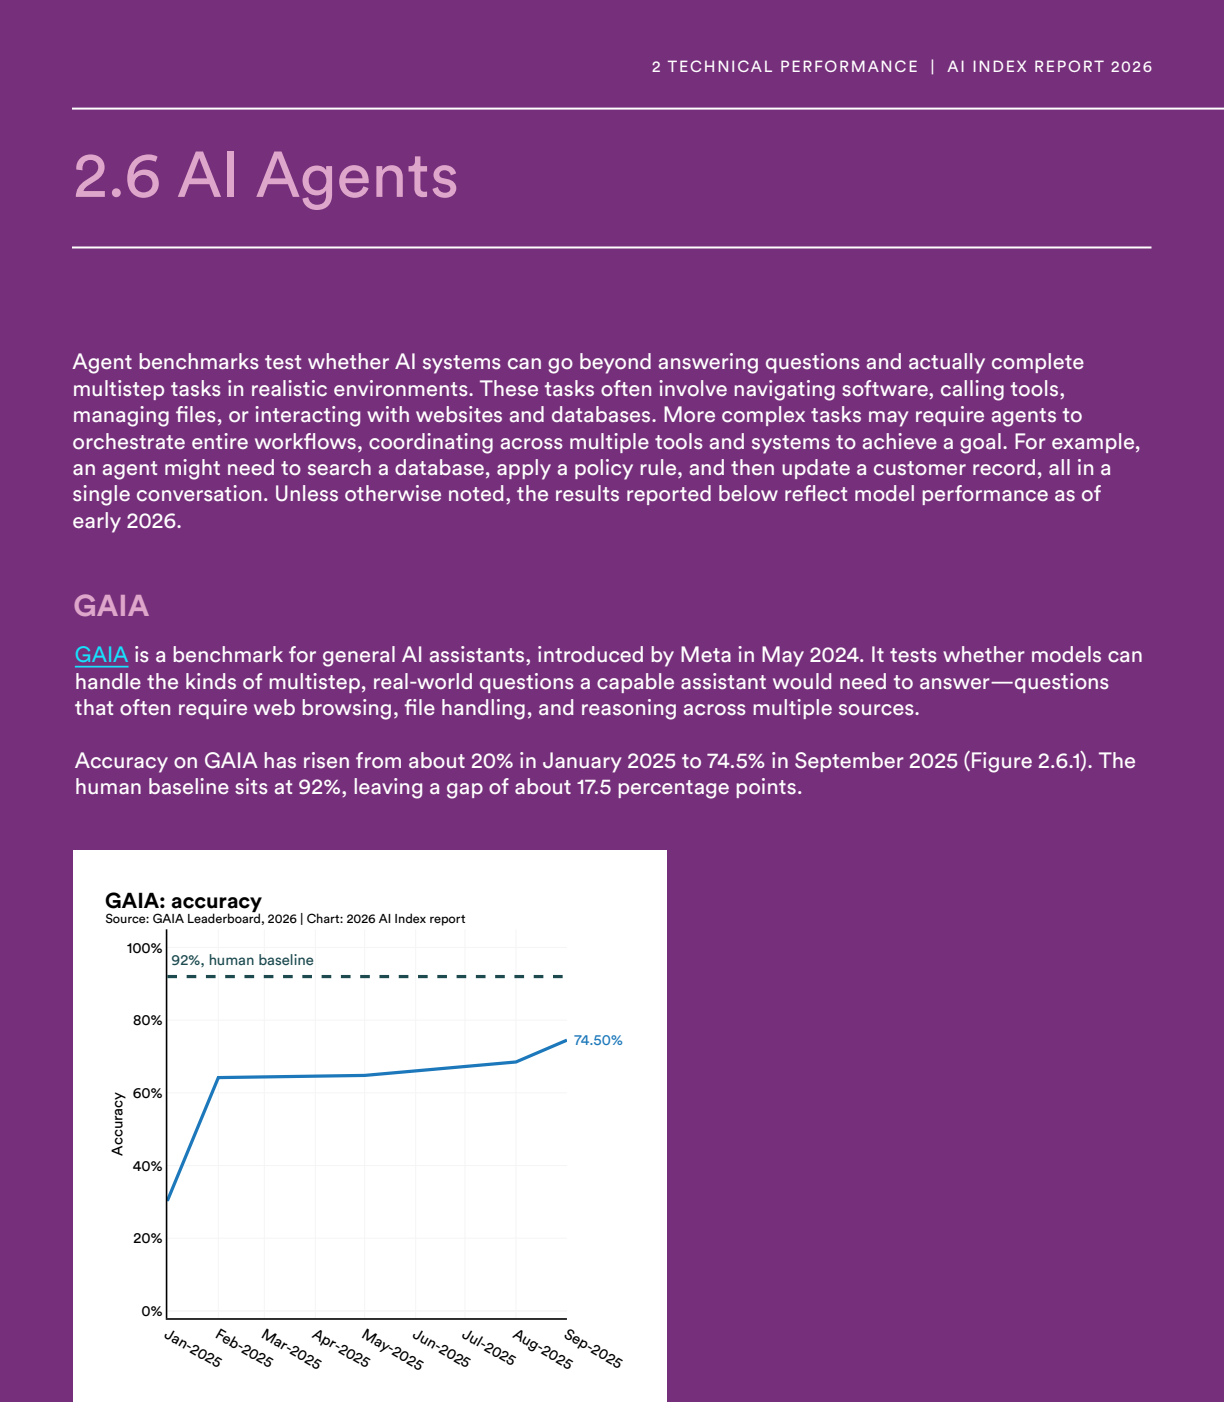
Figure 2.6. Figure 2.6: 133 33 Data source: https://hal.cs.princeton.edu/gaia [PITH_FULL_IMAGE:figures/full_fig_p112_2_6.png] view at source ↗
Figure 2.6
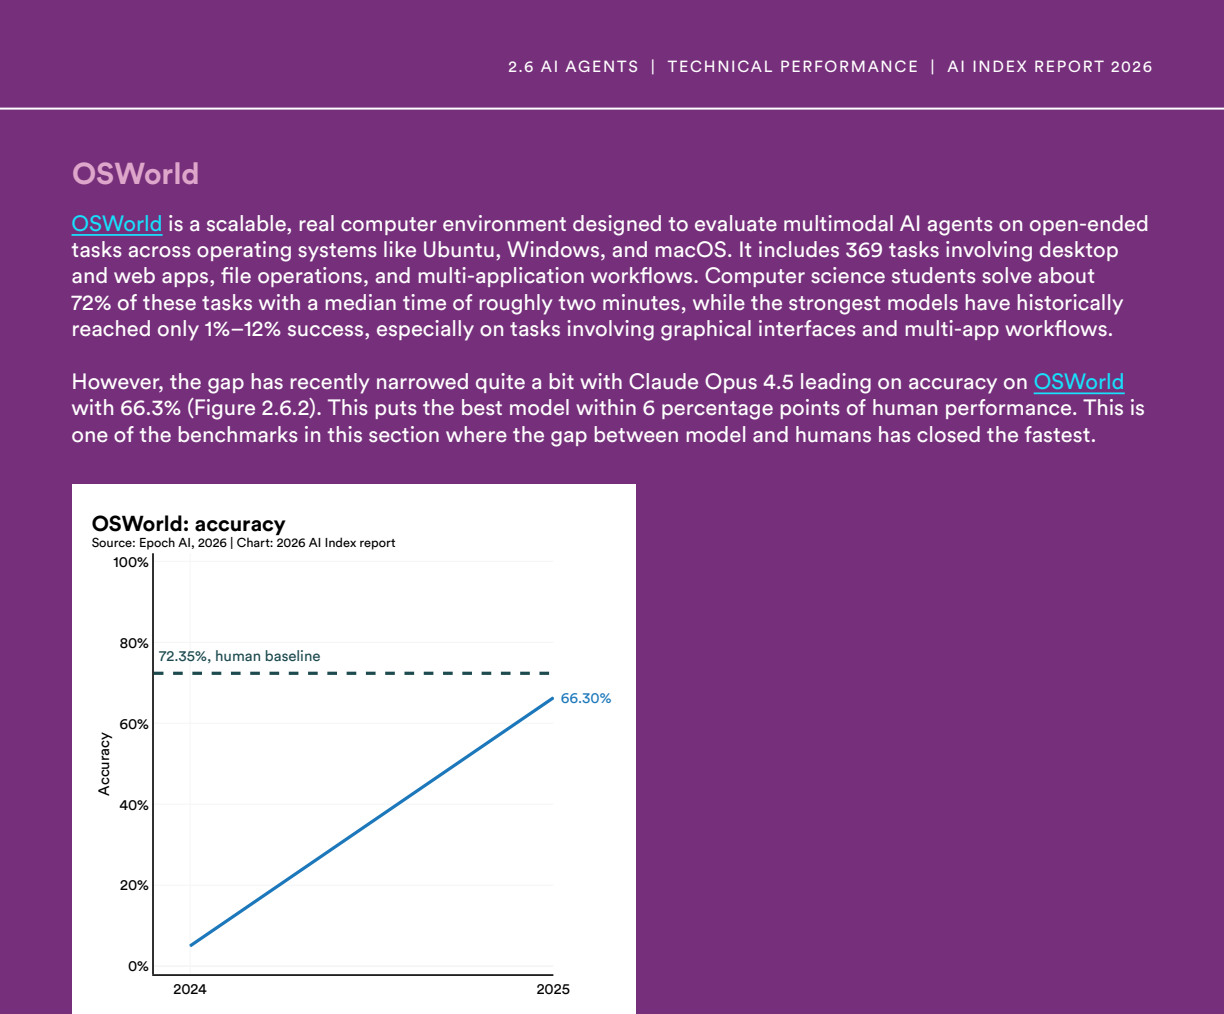
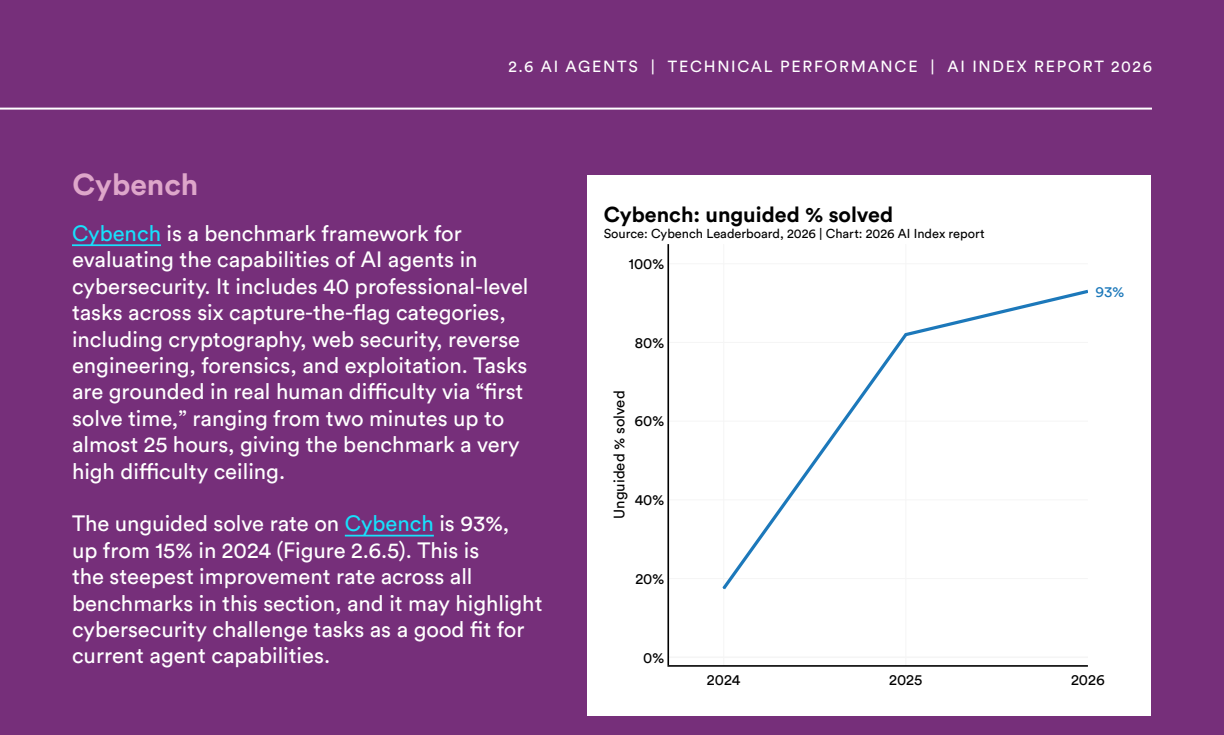
Figure 2.6. Figure 2.6: 234 34 Data source: https://epoch.ai/benchmarks/. 2.6 AI AGENTS | TECHNICAL PERFORMANCE | AI INDEX REPORT 2026 OSWorld is a scalable, real computer environment designed to evaluate multimodal AI agents on open-ended tasks across operating systems like Ubuntu, Windows, and macOS. It includes 369 tasks involving desktop and web apps, file operations, and multi-application workflows. Computer science studen… view at source ↗
Figure 2.6
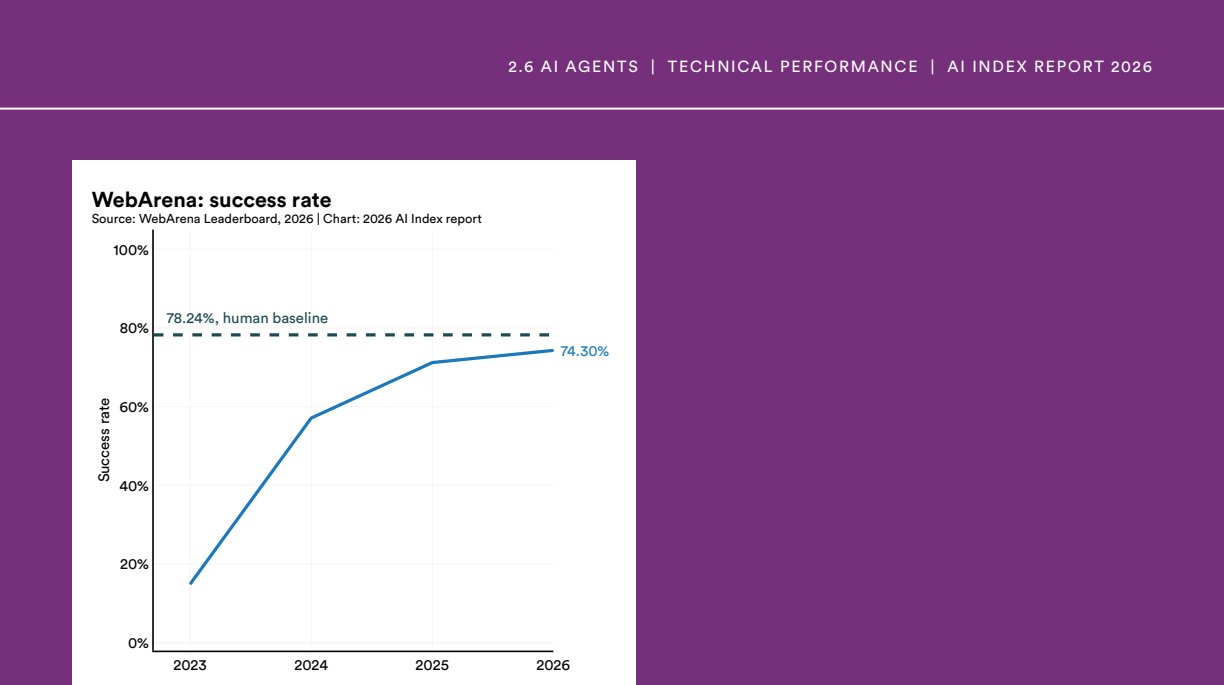
Figure 2.6. Figure 2.6: 335 [PITH_FULL_IMAGE:figures/full_fig_p114_2_6.png] view at source ↗
Figure 2.6
Figure 2.6. Figure 2.6: 537 [PITH_FULL_IMAGE:figures/full_fig_p115_2_6.png] view at source ↗
Figure 2.7
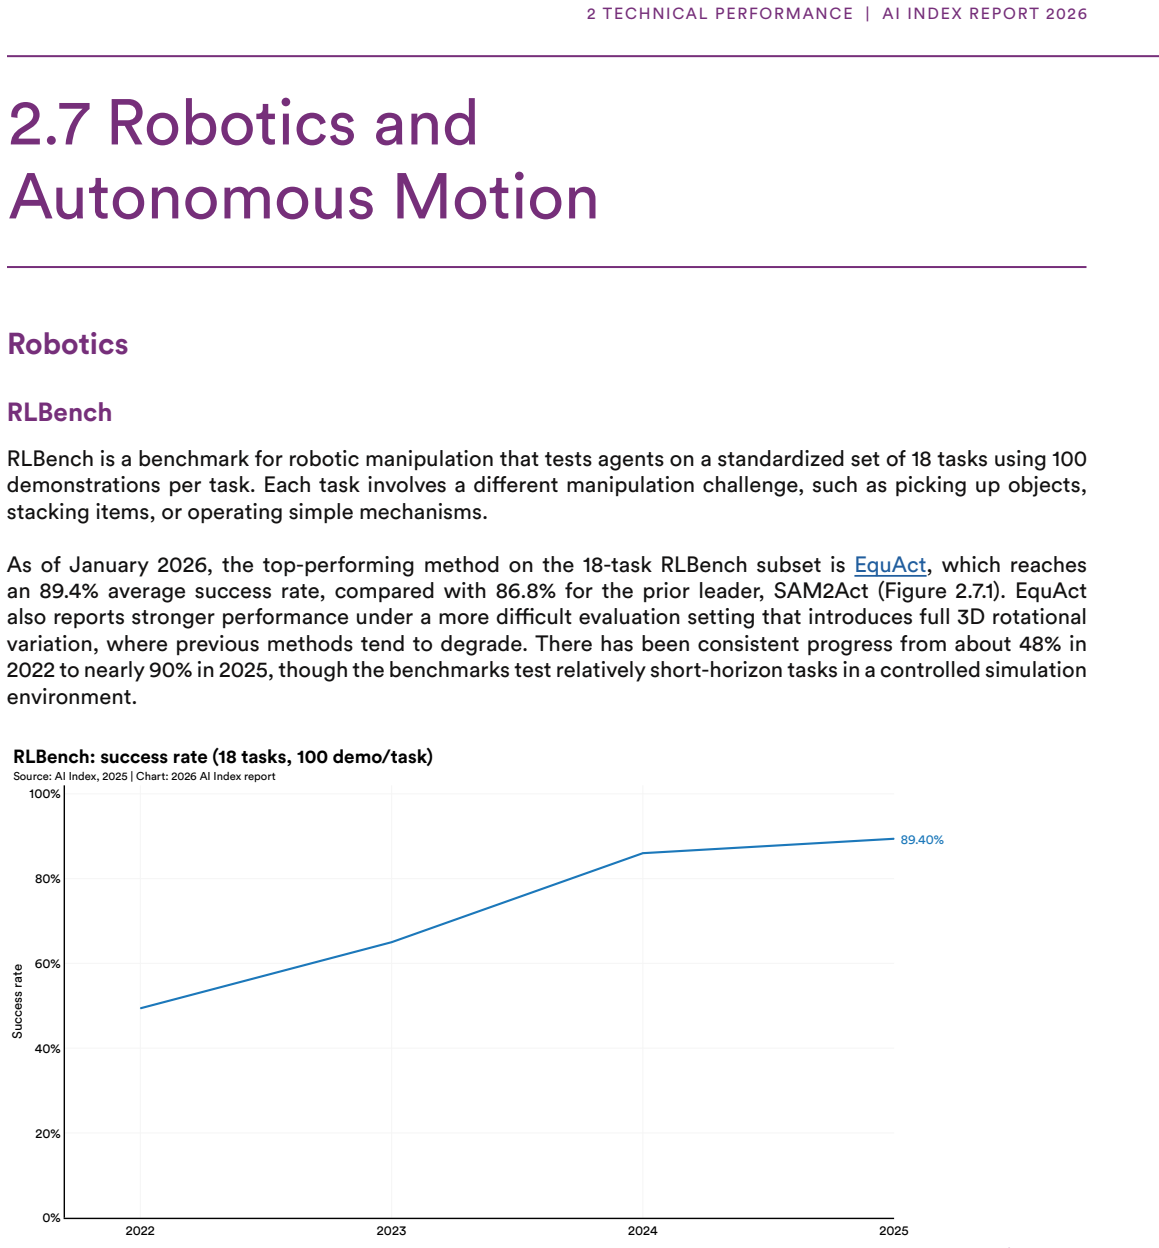
Figure 2.7. Figure 2.7: 1 BEHAVIOR-1K BEHAVIOR-1K is a simulation benchmark built around real human needs. The tasks come from surveys asking people what household tasks they want robots to help with, resulting in 1,000 realistic activities. These are long-horizon mobile manipulation challenges in simulated home environments, designed to bridge the gap between current research and human-centered applications [PITH_FULL_IMAGE:f… view at source ↗
Figure 2.7
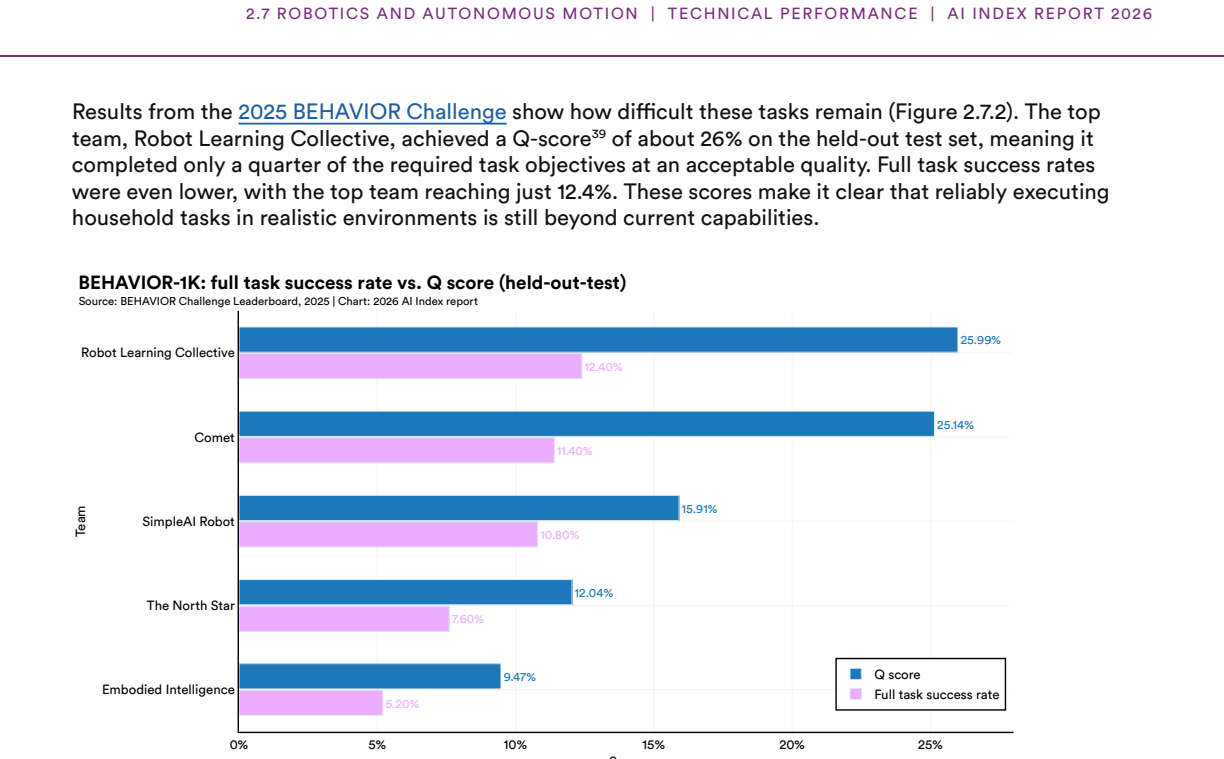
Figure 2.7. Figure 2.7: 2 [PITH_FULL_IMAGE:figures/full_fig_p117_2_7.png] view at source ↗
Figure 2.7
Figure 2.7. Figure 2.7: 4 [PITH_FULL_IMAGE:figures/full_fig_p119_2_7.png] view at source ↗
Figure 2.7
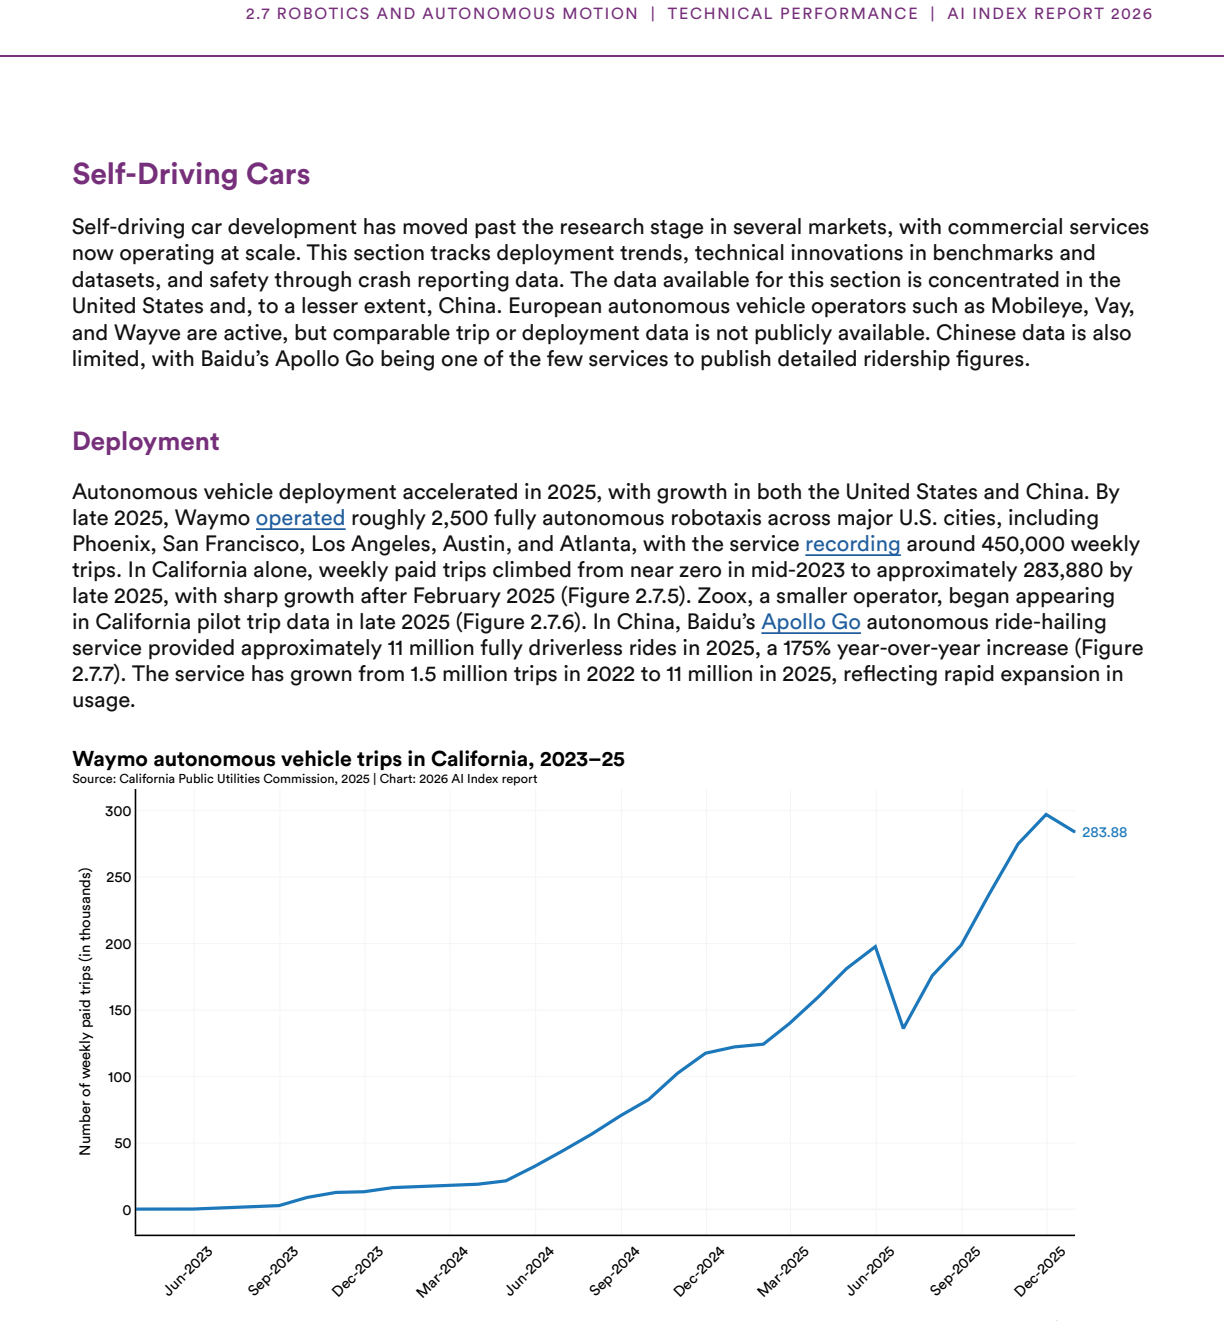
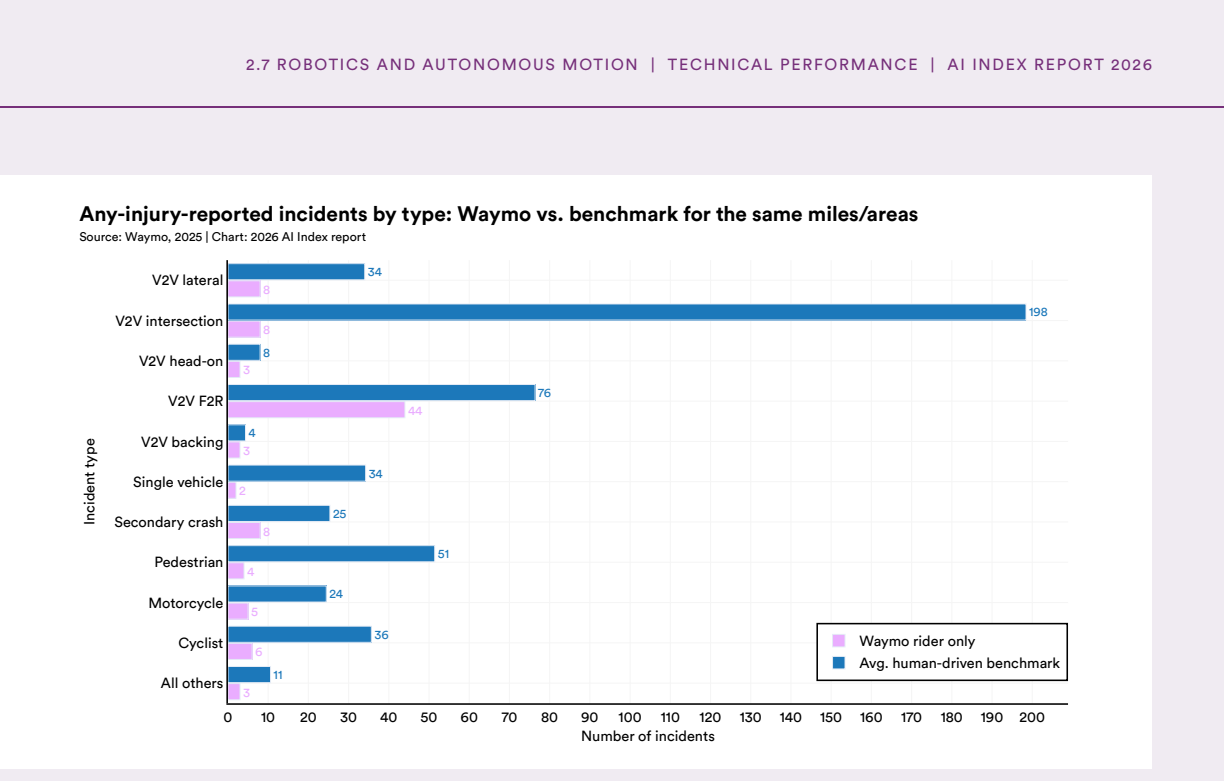
Figure 2.7. Figure 2.7: 540 40 These AV deployment metrics, as reported to the California Public Utilities Commission, pertain to Waymo and Cruise (until the latter was discontinued by General Motors in December 2024). Several other companies, including Aurora, Tensor (formerly AutoX), WeRide Corp, and Zoox, are in pilot stages. Tesla has not been approved by the CPUC to offer autonomous passenger service. Data source: Californ… view at source ↗
Figure 2.7
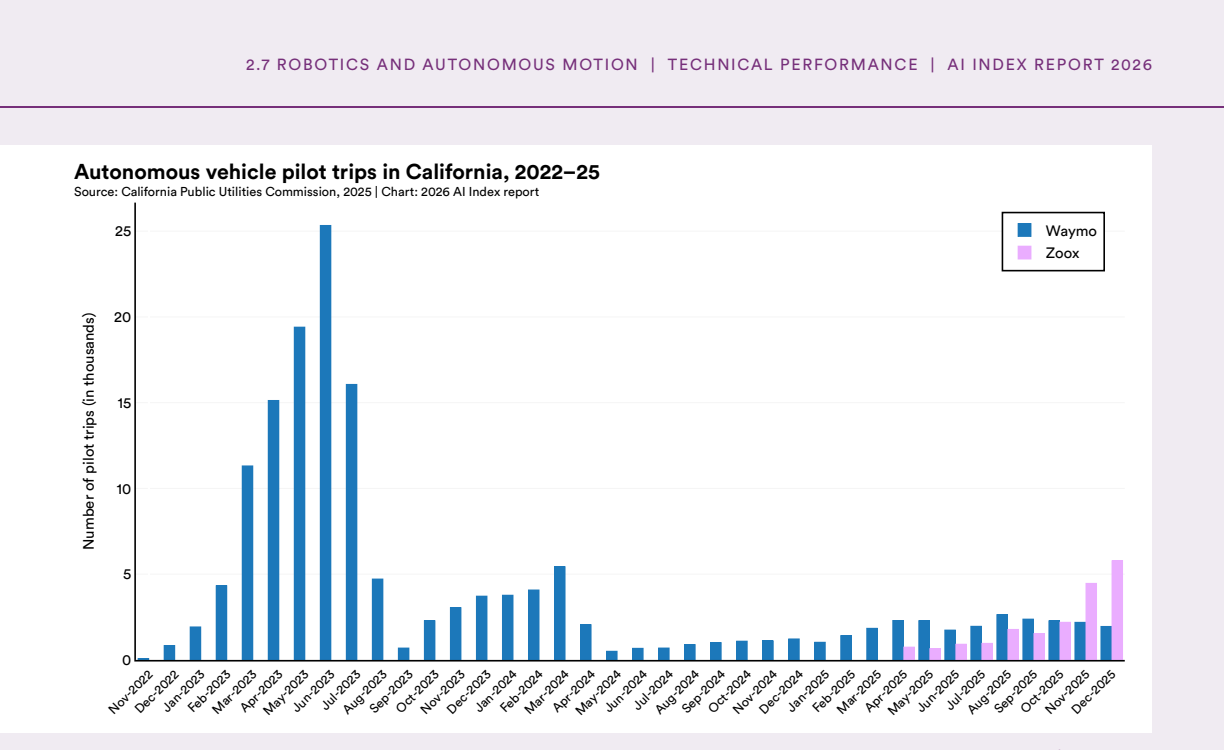
Figure 2.7. Figure 2.7: 641 [PITH_FULL_IMAGE:figures/full_fig_p122_2_7.png] view at source ↗
Figure 2.7
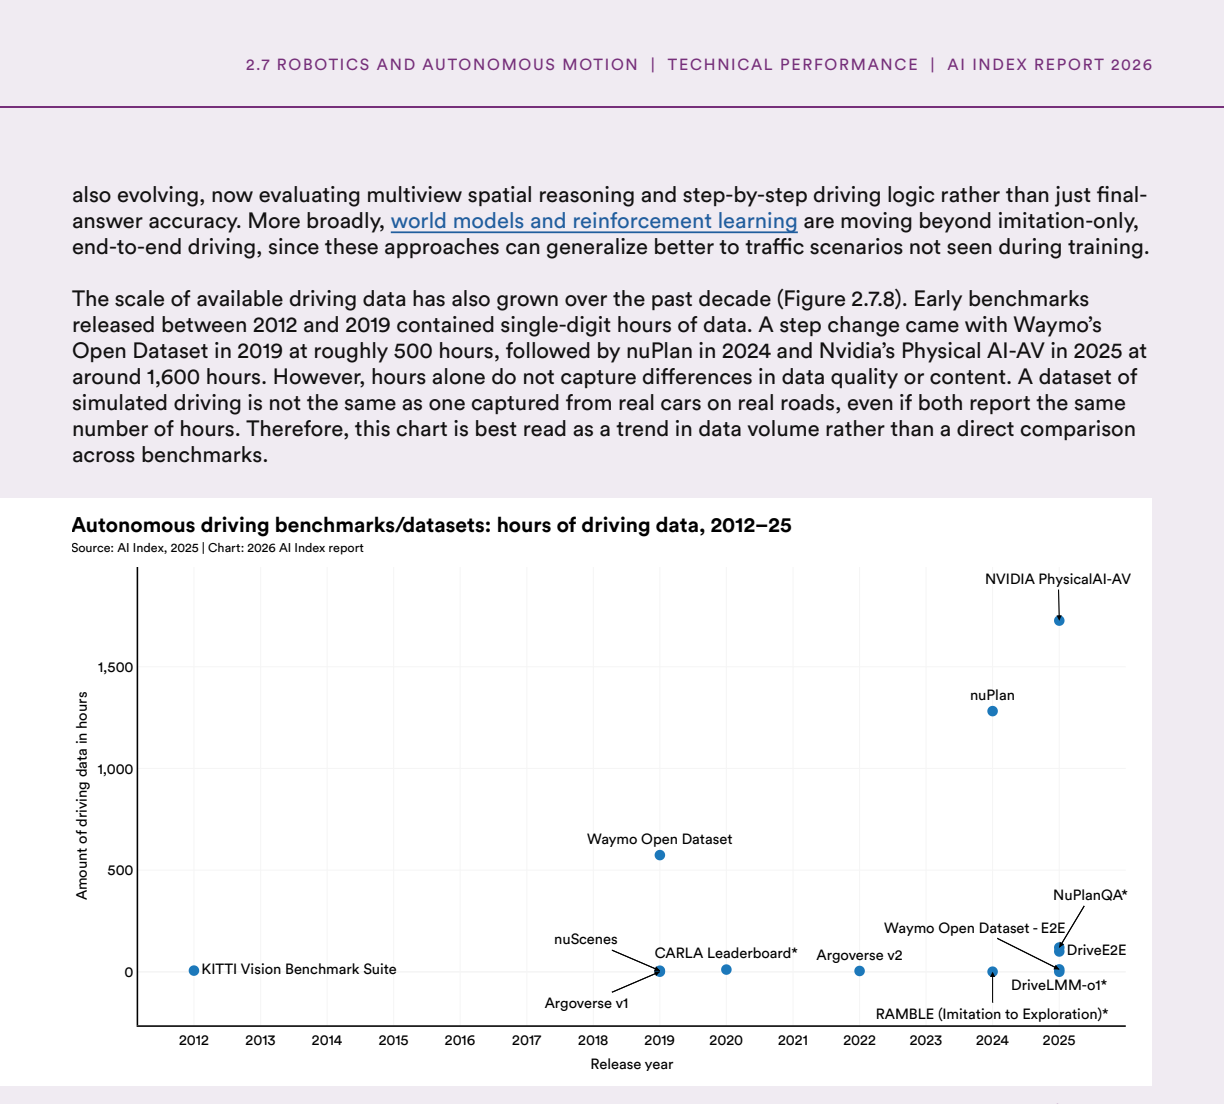
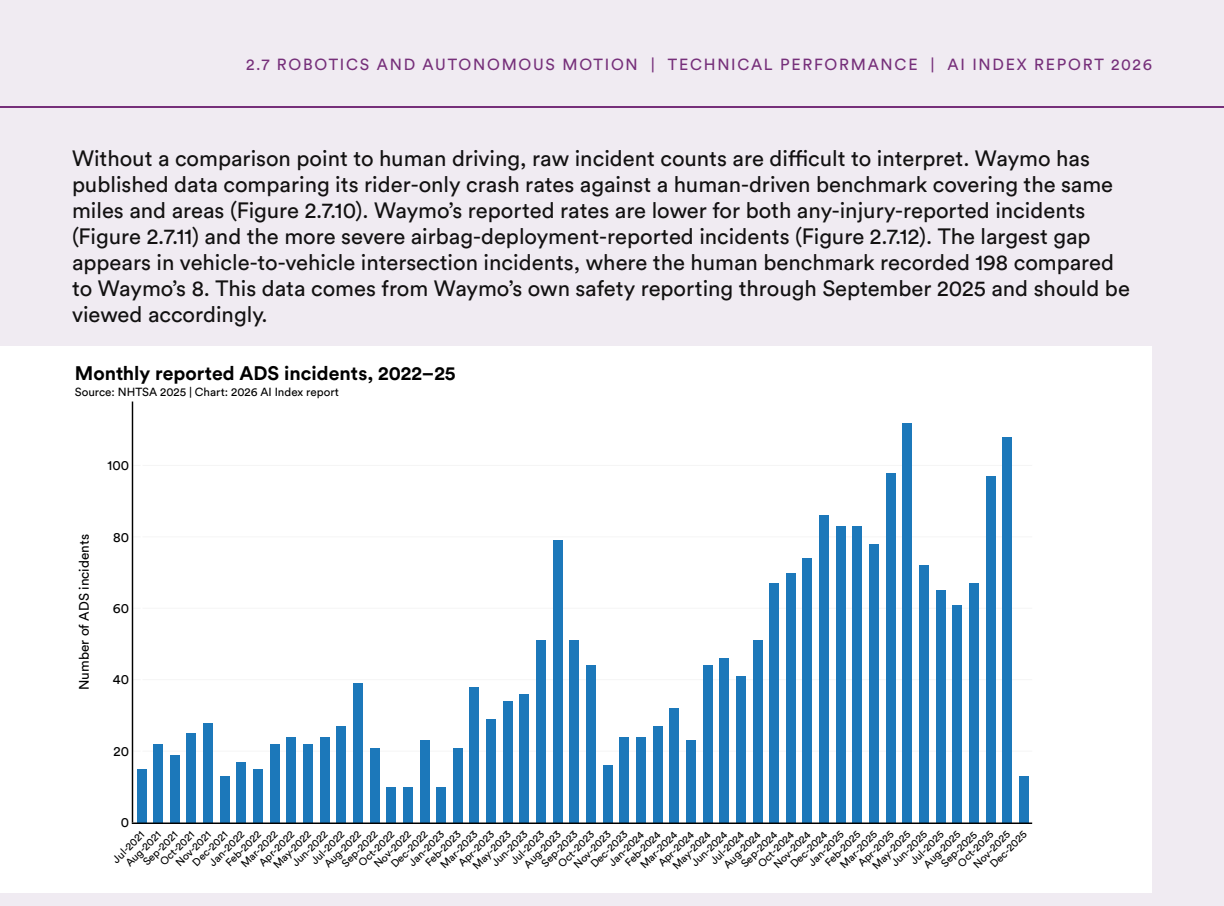
Figure 2.7. Figure 2.7: 843 43 For datasets marked with an asterisk, hours of driving data are estimated rather than directly reported. The Standing General Order (the General Order) on Crash Reporting is a National Highway Traffic Safety Administration (NHTSA) mandate that requires manufacturers and operators to report certain crashes involving automated driving systems (ADS) or SAE Level 2 advanced driver assistance systems (… view at source ↗
Figure 2.7
Figure 2.7. Figure 2.7: 9 [PITH_FULL_IMAGE:figures/full_fig_p124_2_7.png] view at source ↗
Figure 2.7
Figure 2.7. Figure 2.7: 1145 [PITH_FULL_IMAGE:figures/full_fig_p125_2_7.png] view at source ↗
Figure 3.1
Figure 3.1. Figure 3.1: 1 [PITH_FULL_IMAGE:figures/full_fig_p131_3_1.png] view at source ↗
Figure 3.2
Figure 3.2. Figure 3.2: 12 1 The AI Index continues to rely on AIID as its primary source of AI incidents due to AIID’s reliability and stable incident records. 2 The number of AI incidents is continually updated, including for previous years. Therefore, the totals reported in [PITH_FULL_IMAGE:figures/full_fig_p132_3_2.png] view at source ↗
Figure 3.2
Figure 3.2. Figure 3.2: 2 Unmoderated AI Output and Harmful Speech (July 8, 2025) In July 2025, Grok—the chatbot developed by xAI and embedded across X—faced backlash after users shared examples of the system generating antisemitic language, violent hate speech, and even praise for Adolf Hitler when prompted. The issue emerged shortly after a system update that relaxed safety filters, allowing the chatbot to produce more provoc… view at source ↗
Figure 3.2
Figure 3.2. Figure 3.2: 3 [PITH_FULL_IMAGE:figures/full_fig_p135_3_2.png] view at source ↗
Figure 3.2
Figure 3.2. Figure 3.2: 53 3 For a comprehensive view of all evaluated models, consult the full leaderboard. Hughes Hallucination Evaluation Model (HHEM) Leaderboard AA-Omniscience The Hughes Hallucination Evaluation Model (HHEM) leaderboard, developed by Vectara, assesses how frequently LLMs introduce hallucinations when summarizing documents from the CNN/Daily Mail corpus. Among the top 15 models evaluated, hallucination rate… view at source ↗
Figure 3.2
Figure 3.2. Figure 3.2: 6 [PITH_FULL_IMAGE:figures/full_fig_p137_3_2.png] view at source ↗
Figure 3.2
Figure 3.2. Figure 3.2: 84 4 This figure reports accuracy on verification (Ver.), confirmation (Conf.), and recursive knowledge (Rec.) tasks. First-person subjects are denoted as 1P and third-person subjects as 3P. “Avg” indicates average accuracy across tasks. Factual scenarios are labelled “T” and false scenarios “F.” Models released after GPT-4o (May 2024) (top) are classified as recent “reasoning-oriented” models, while tho… view at source ↗
Figure 3.2
Figure 3.2. Figure 3.2: 9 [PITH_FULL_IMAGE:figures/full_fig_p139_3_2.png] view at source ↗
Figure 3.3
Figure 3.3. Figure 3.3: 1 [PITH_FULL_IMAGE:figures/full_fig_p140_3_3.png] view at source ↗
Figure 3.3
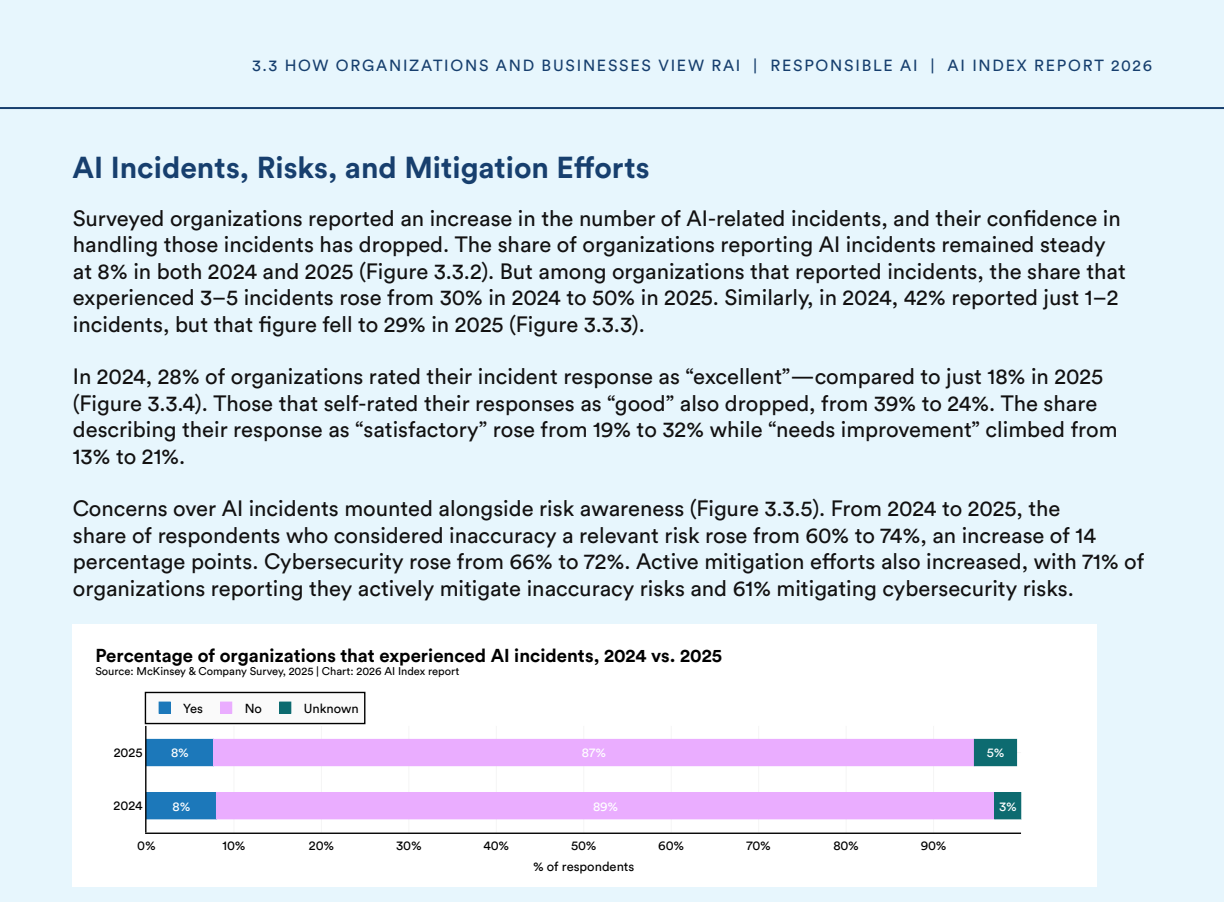
Figure 3.3. Figure 3.3: 4 uses the OECD definition of an AI incident: an event, circumstance, or series of events where the development, use, or malfunction of [PITH_FULL_IMAGE:figures/full_fig_p141_3_3.png] view at source ↗
Figure 3.3
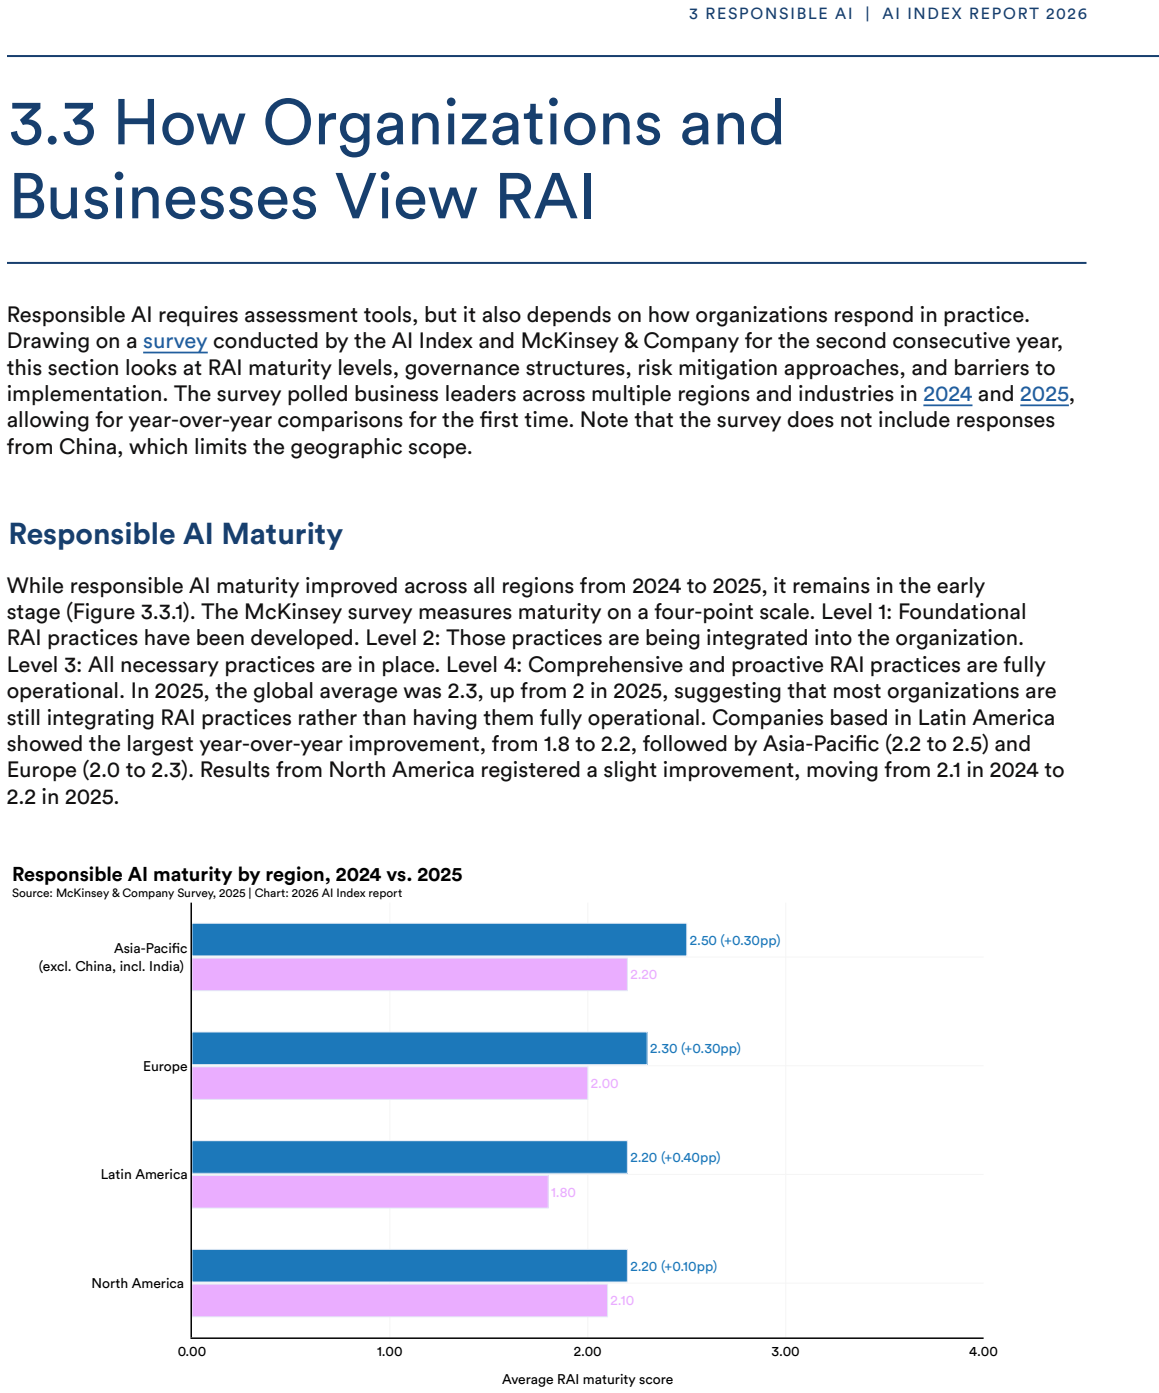
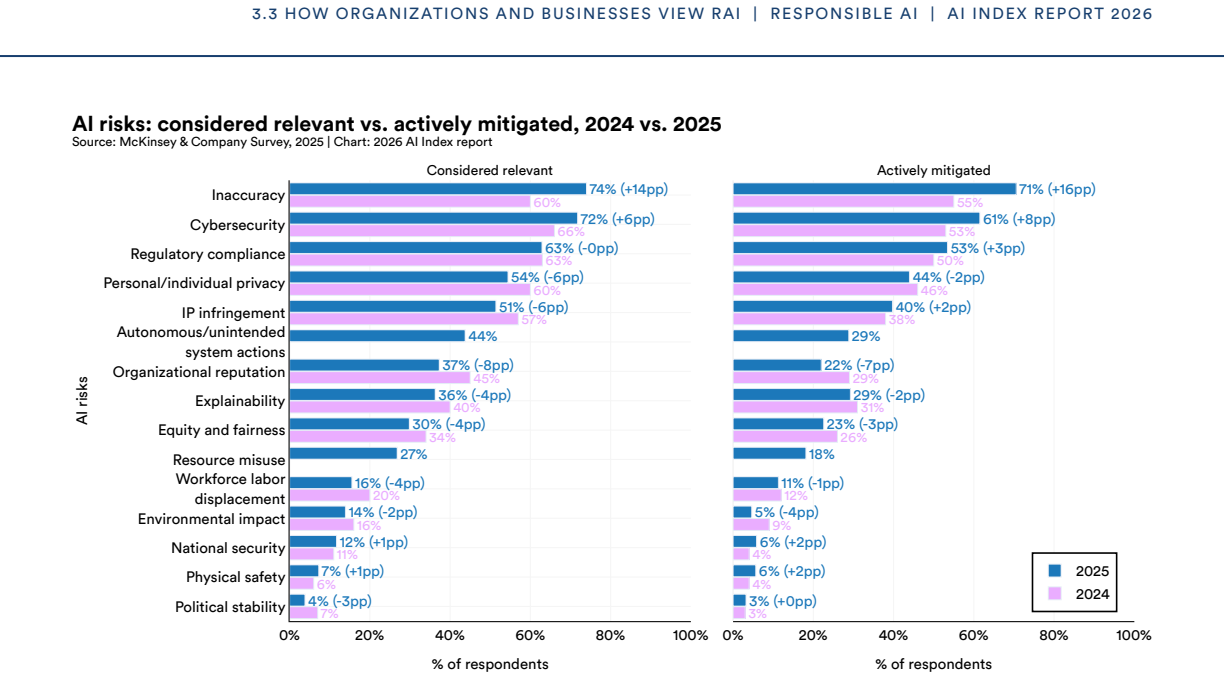
Figure 3.3. Figure 3.3: 56 6 ‘‘Autonomous/unintended system actions” and “resource misuse” were new additions to the 2025 survey. AI Governance and Investment Organizations are formalizing who is responsible for AI governance. Between 2024 and 2025, companies shifted AI governance ownership away from data and analytics functions (down from 17% to 13%), toward dedicated AI governance roles (up from 14% to 17%) ( [PITH_FULL_IMAG… view at source ↗
Figure 3.3
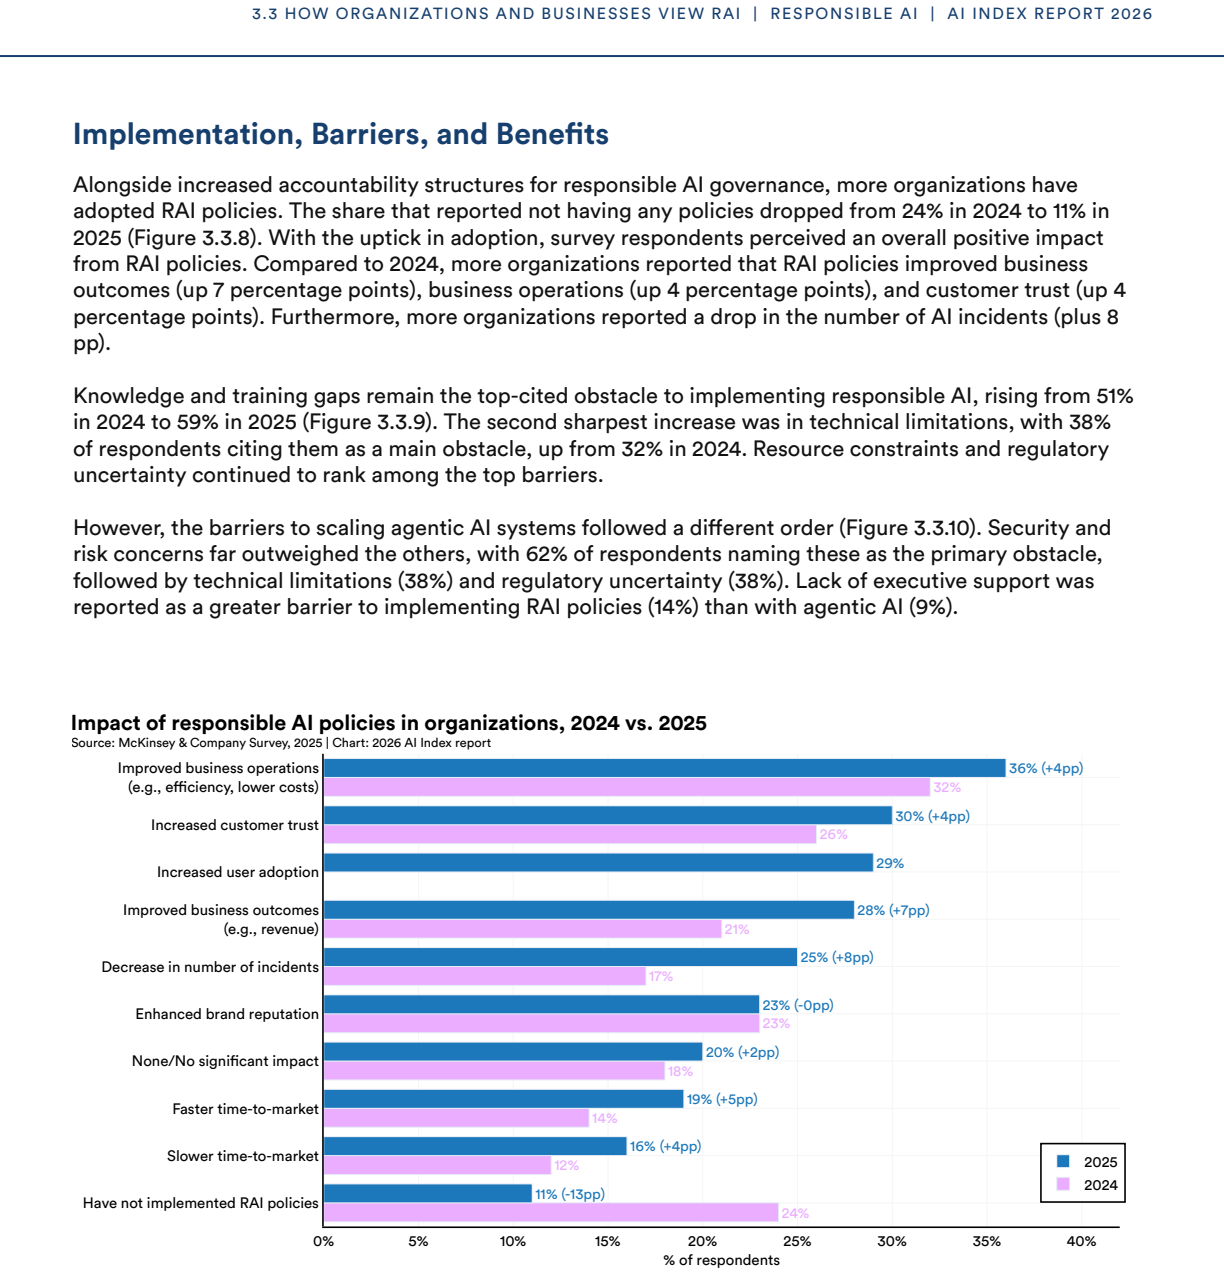
Figure 3.3. Figure 3.3: 67 7 The “Unknown” response option was not included in this visualization. 3.3 HOW ORGANIZATIONS AND BUSINESSES VIEW RAI | RESPONSIBLE AI | AI INDEX REPORT 2026 1% 2% 9% 4% 7% 10% 17% 14% 13% 21% 1% (+0pp) 1% (-1pp) 5% (-4pp) 5% (+1pp) 6% (-1pp) 8% (-2pp) 13% (-4pp) 17% (+3pp) 19% (+6pp) 21% (+0pp) 0% 2% 4% 6% 8% 10% 12% 14% 16% 18% 20% 22% 24% Other Customer care No business function primarily responsib… view at source ↗
Figure 3.3
Figure 3.3. Figure 3.3: 88 8 Percentages are based on respondents who selected at least one answer [PITH_FULL_IMAGE:figures/full_fig_p144_3_3.png] view at source ↗
Figure 3.3
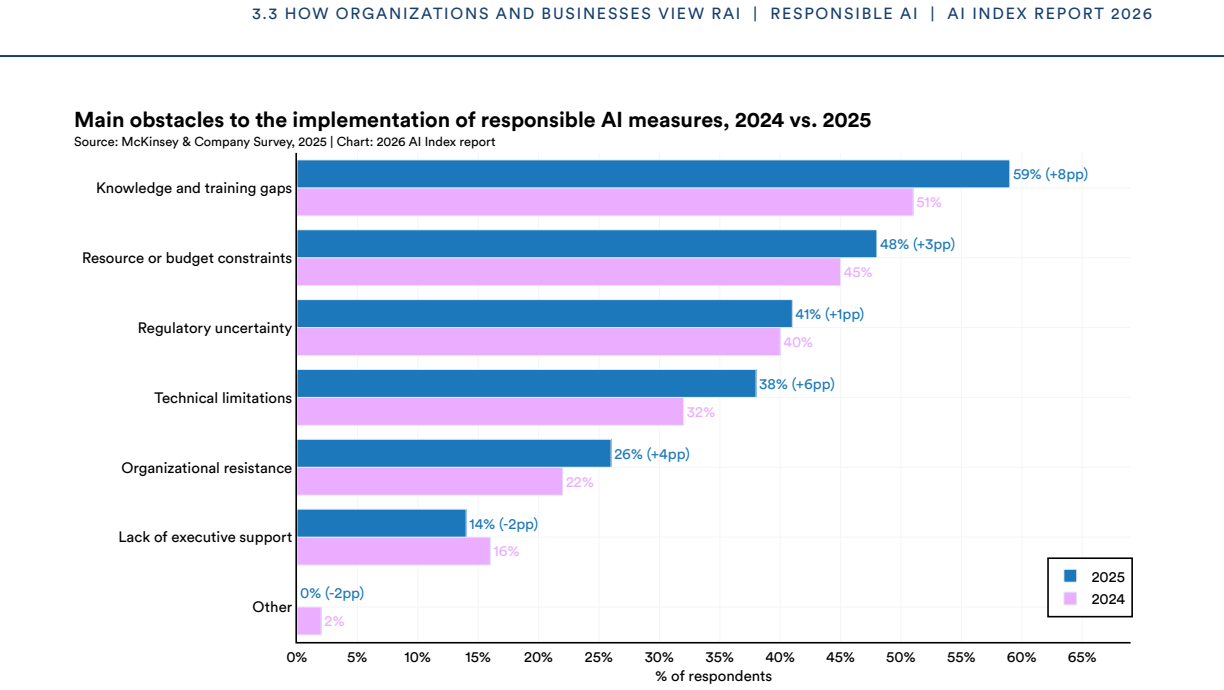
Figure 3.3. Figure 3.3: 99 9 Neither the “Unknown” nor the “None” response option is shown in this visualization. 3.3 HOW ORGANIZATIONS AND BUSINESSES VIEW RAI | RESPONSIBLE AI | AI INDEX REPORT 2026 2% 16% 22% 32% 40% 45% 51% 0% (-2pp) 14% (-2pp) 26% (+4pp) 38% (+6pp) 41% (+1pp) 48% (+3pp) 59% (+8pp) 0% 5% 10% 15% 20% 25% 30% 35% 40% 45% 50% 55% 60% 65% Other Lack of executive support Organizational resistance Technical limita… view at source ↗
Figure 3.3
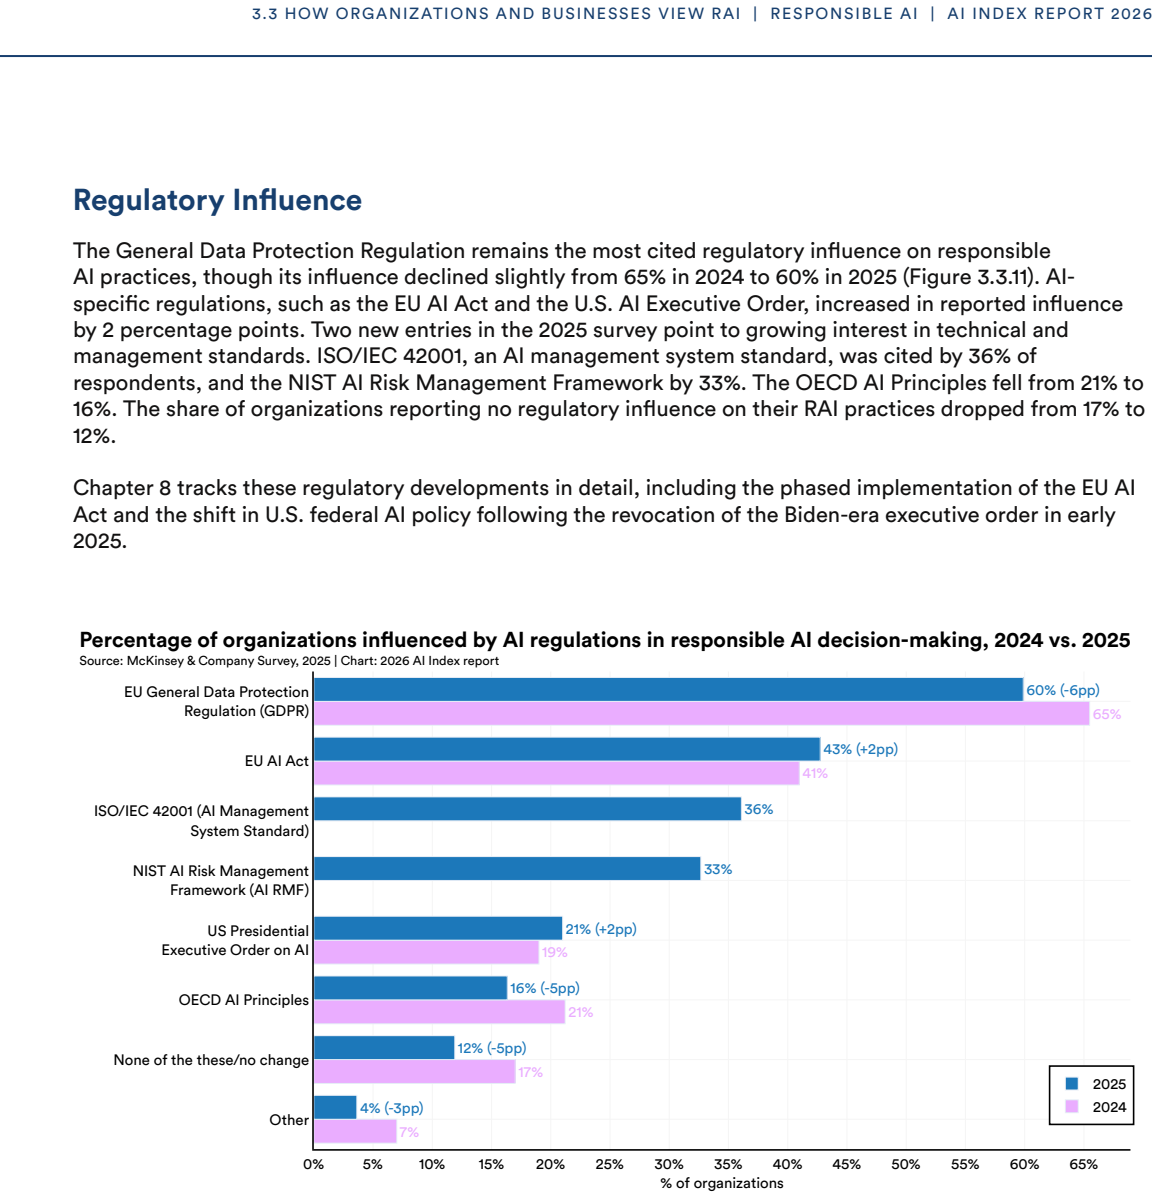
Figure 3.3. Figure 3.3: 1110 10 The ISO/IEC 42001 (AI Management System Standard) and NIST AI Risk Management Framework (AI RMF) AI regulation were added in the 2025 RAI Survey, and not included in 2024 Survey [PITH_FULL_IMAGE:figures/full_fig_p146_3_3.png] view at source ↗
Figure 3.4
Figure 3.4. Figure 3.4: 1 [PITH_FULL_IMAGE:figures/full_fig_p147_3_4.png] view at source ↗
Figure 3.4
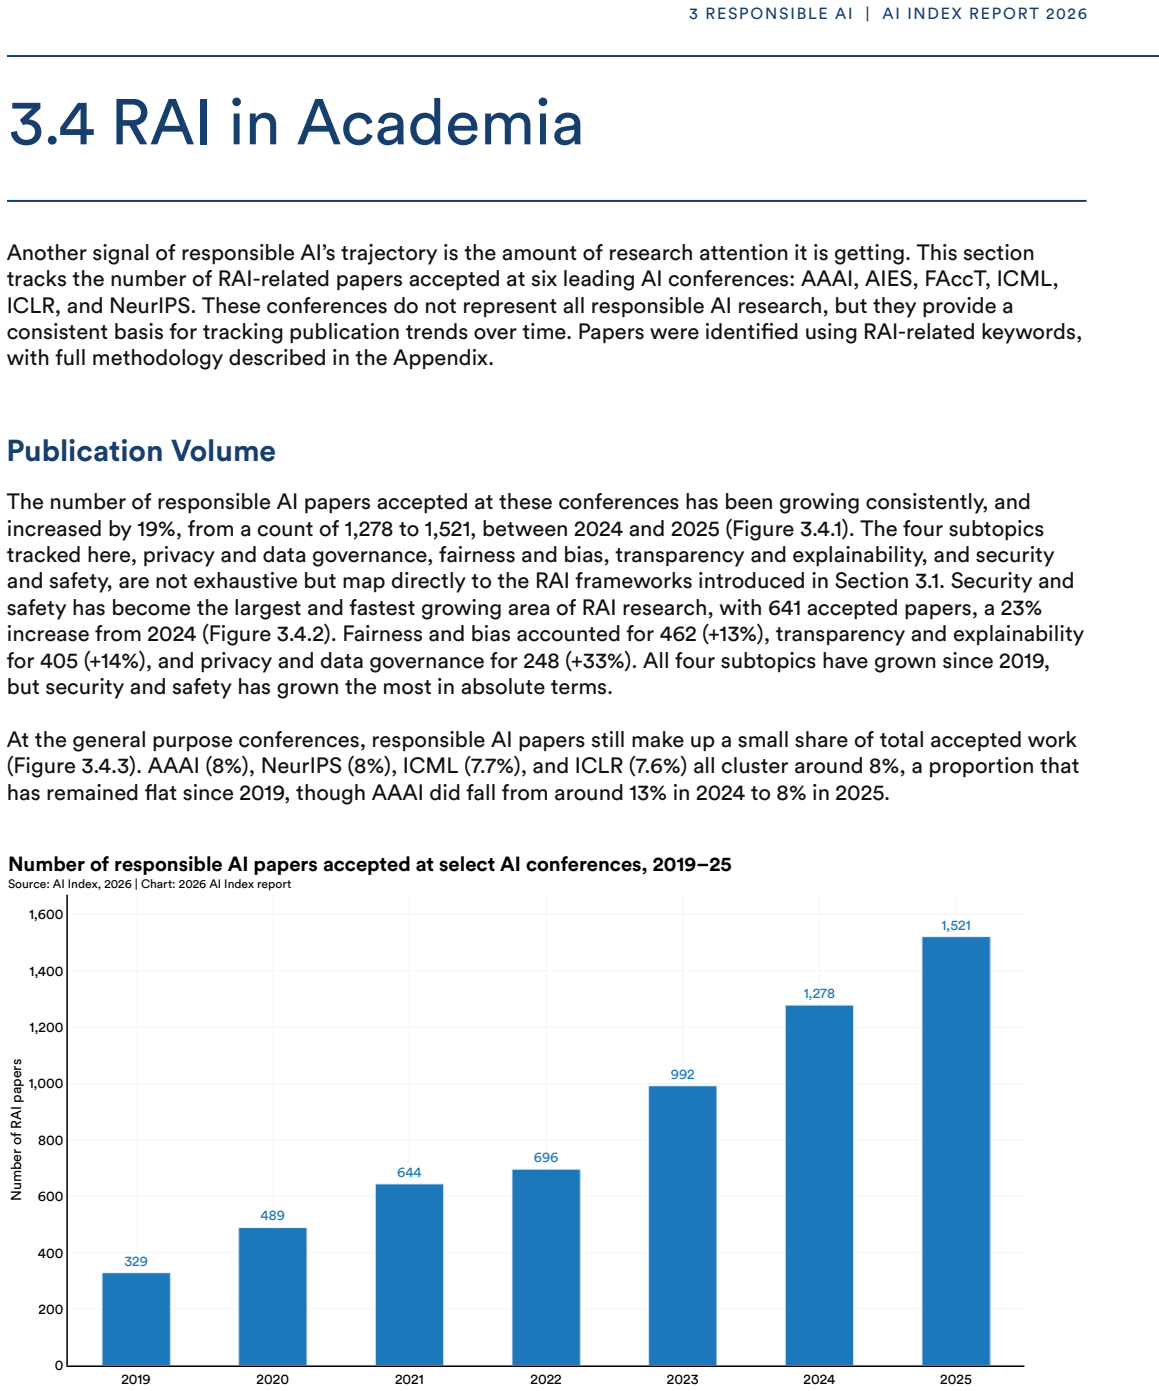
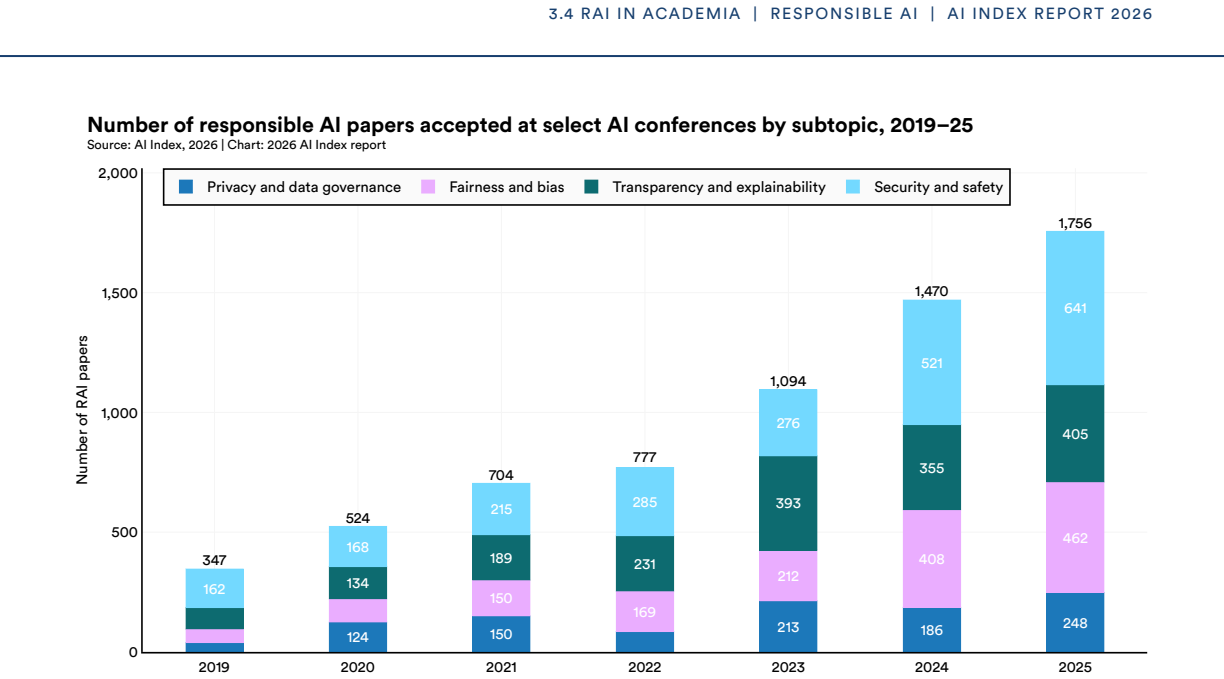
Figure 3.4. Figure 3.4: 2 11 11 A single publication may be related to more than one topic and may therefore be counted or shown in multiple categories. 2019 2020 2021 2022 2023 2024 2025 0% 10% 20% 30% 40% 50% 60% 70% RAI papers (% of total) 7.62%, ICLR 7.65%, ICML 7.98%, NeurIPS 8.00%, AAAI 54.68%, AIES 67.43%, FAccT Responsible AI papers accepted (% of total) at select AI conferences by conference, 2019–25 Source: AI Index, … view at source ↗
Figure 3.4
Figure 3.4. Figure 3.4: 4 [PITH_FULL_IMAGE:figures/full_fig_p149_3_4.png] view at source ↗
Figure 3.5
Figure 3.5. Figure 3.5: 1 [PITH_FULL_IMAGE:figures/full_fig_p150_3_5.png] view at source ↗
Figure 3.5
Figure 3.5. Figure 3.5: 2 [PITH_FULL_IMAGE:figures/full_fig_p152_3_5.png] view at source ↗
Figure 3.6
Figure 3.6. Figure 3.6: 1 [PITH_FULL_IMAGE:figures/full_fig_p154_3_6.png] view at source ↗
Figure 3.7
Figure 3.7. Figure 3.7: 1 [PITH_FULL_IMAGE:figures/full_fig_p155_3_7.png] view at source ↗
Figure 3.7
Figure 3.7. Figure 3.7: 2 [PITH_FULL_IMAGE:figures/full_fig_p156_3_7.png] view at source ↗
Figure 3.7
Figure 3.7. Figure 3.7: 3 [PITH_FULL_IMAGE:figures/full_fig_p157_3_7.png] view at source ↗
Figure 3.7
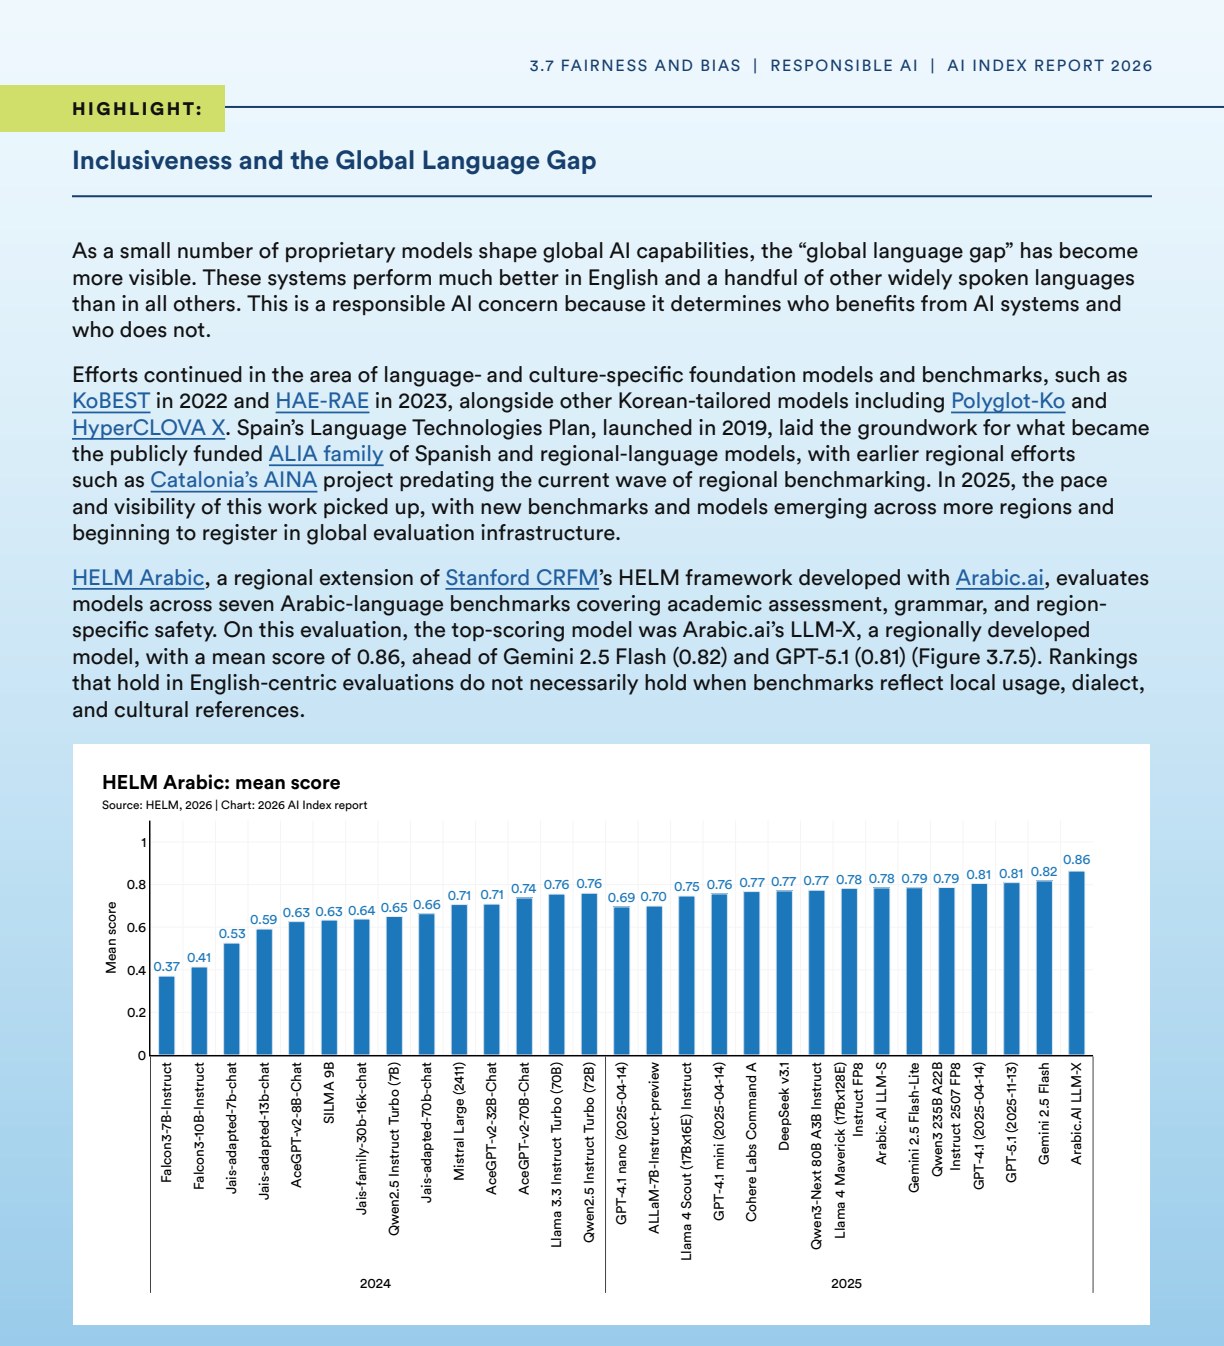
Figure 3.7. Figure 3.7: 514 14 Data source: https://crfm.stanford.edu/helm/arabic/latest/. HIGHLIGHT: Inclusiveness and the Global Language Gap As a small number of proprietary models shape global AI capabilities, the “global language gap” has become more visible. These systems perform much better in English and a handful of other widely spoken languages than in all others. This is a responsible AI concern because it determines… view at source ↗
Figure 3.7
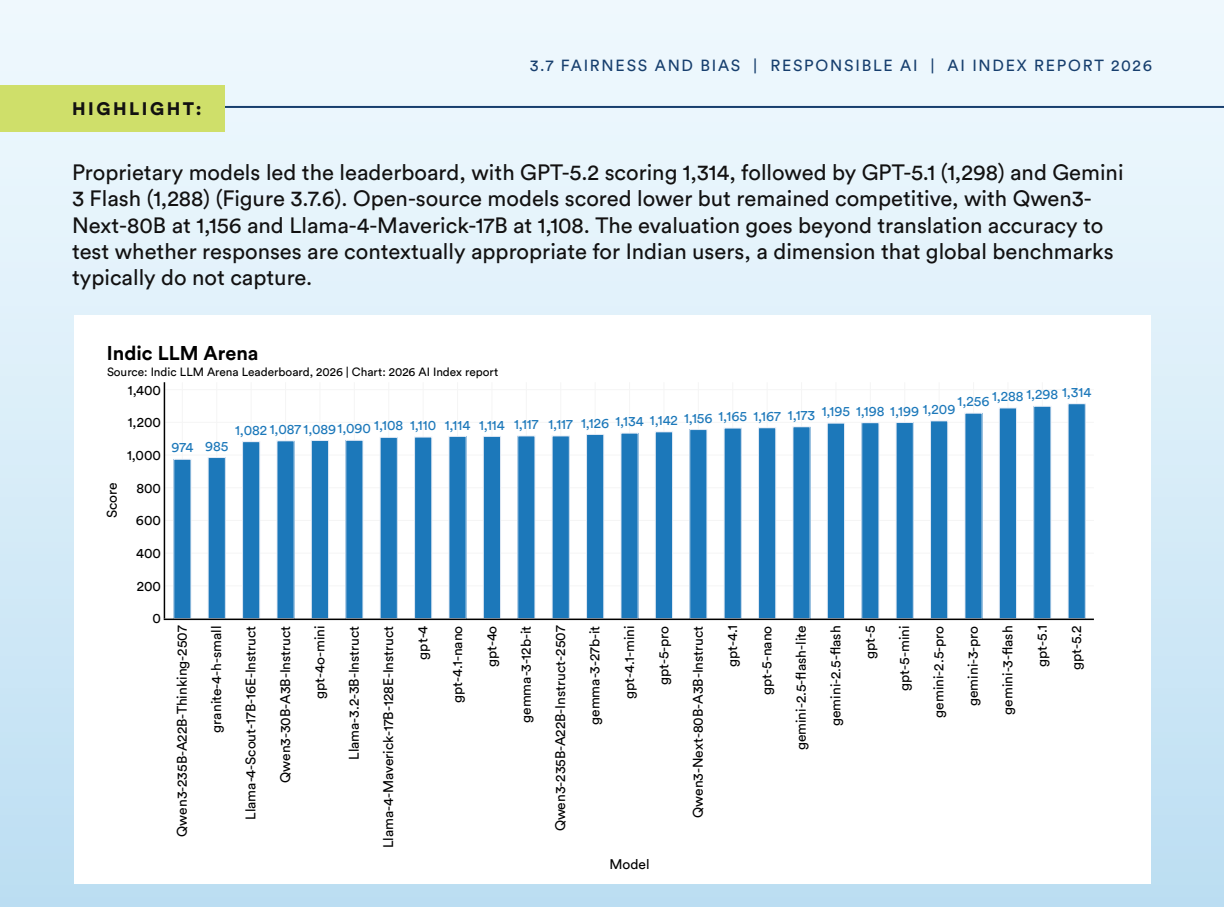
Figure 3.7. Figure 3.7: 615 15 Data source: https://arena.ai4bharat.org/#/leaderboard/chat/overview. HIGHLIGHT: 3.7 FAIRNESS AND BIAS | RESPONSIBLE AI | AI INDEX REPORT 2026 Proprietary models led the leaderboard, with GPT-5.2 scoring 1,314, followed by GPT-5.1 (1,298) and Gemini 3 Flash (1,288) ( [PITH_FULL_IMAGE:figures/full_fig_p159_3_7.png] view at source ↗
Figure 3.7
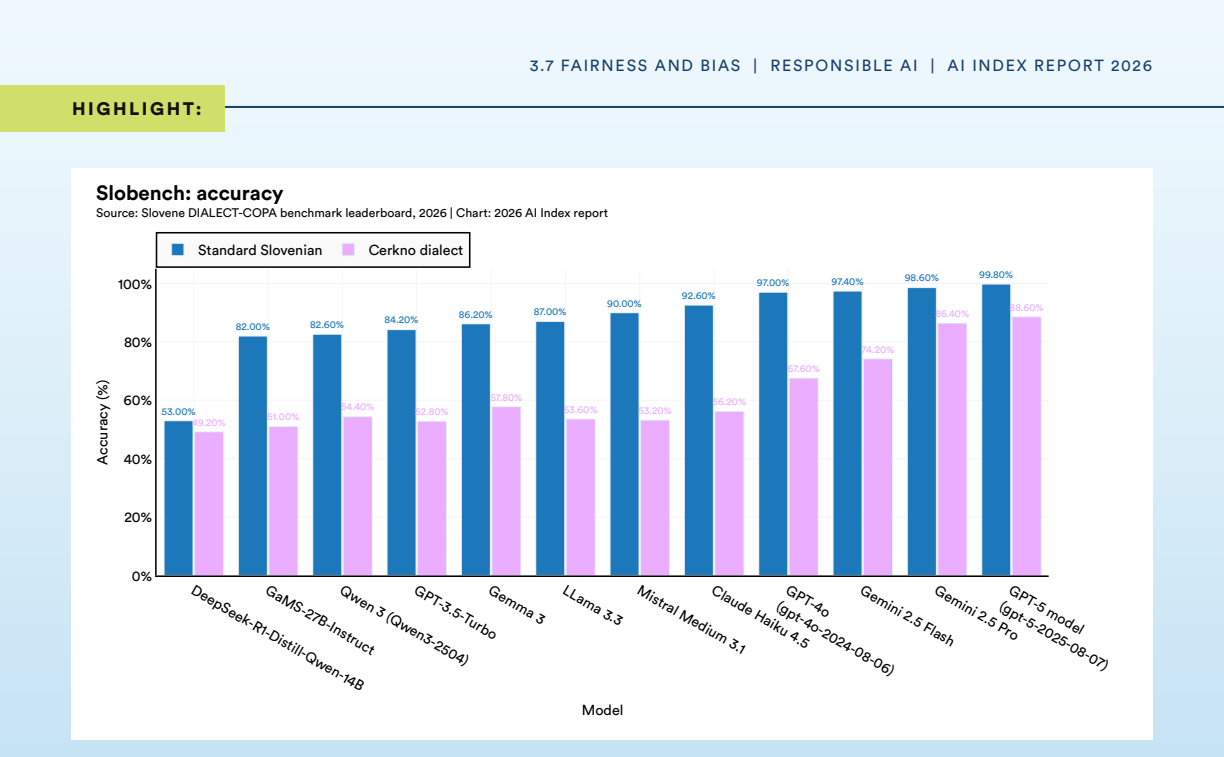
Figure 3.7. Figure 3.7: 716 16 Data source: https://slobench.cjvt.si/leaderboard/view/17. HIGHLIGHT: 3.7 FAIRNESS AND BIAS | RESPONSIBLE AI | AI INDEX REPORT 2026 53.00% 82.00% 82.60% 84.20% 86.20% 87.00% 90.00% 92.60% 97.00% 97.40% 98.60% 99.80% 88.60% 86.40% 74.20% 67.60% 56.20% 53.60% 53.20% 57.80% 52.80% 54.40% 51.00% 49.20% DeepSeek-R1-Distill-Qwen-14B GaMS-27B-Instruct Qwen 3 (Qwen3-2504) GPT-3.5-Turbo Gemma 3 LLama 3.3 M… view at source ↗
Figure 3.7
Figure 3.7. Figure 3.7: 8 [PITH_FULL_IMAGE:figures/full_fig_p162_3_7.png] view at source ↗
Figure 3.8
Figure 3.8. Figure 3.8: 1 [PITH_FULL_IMAGE:figures/full_fig_p163_3_8.png] view at source ↗
Figure 3.8
Figure 3.8. Figure 3.8: 2 [PITH_FULL_IMAGE:figures/full_fig_p164_3_8.png] view at source ↗
Figure 3.9
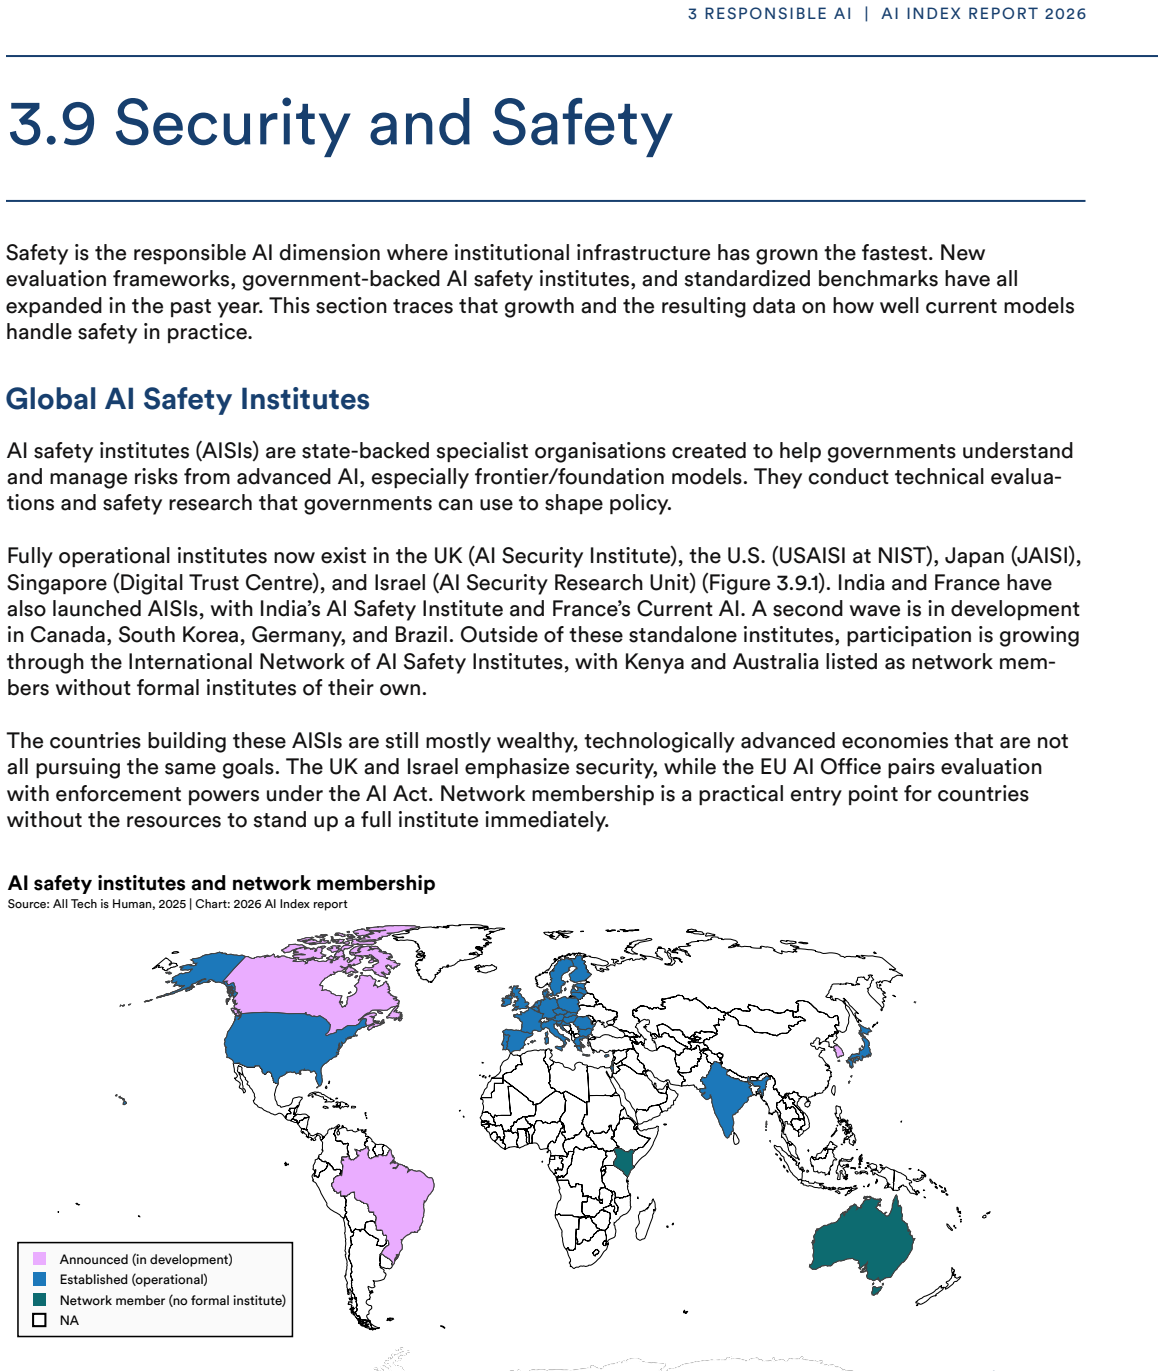
Figure 3.9. Figure 3.9: 118 18 Data source: https://alltechishuman.org/all-tech-is-human-blog/the-global-landscape-of-ai-safety-institutes [PITH_FULL_IMAGE:figures/full_fig_p165_3_9.png] view at source ↗
Figure 3.9
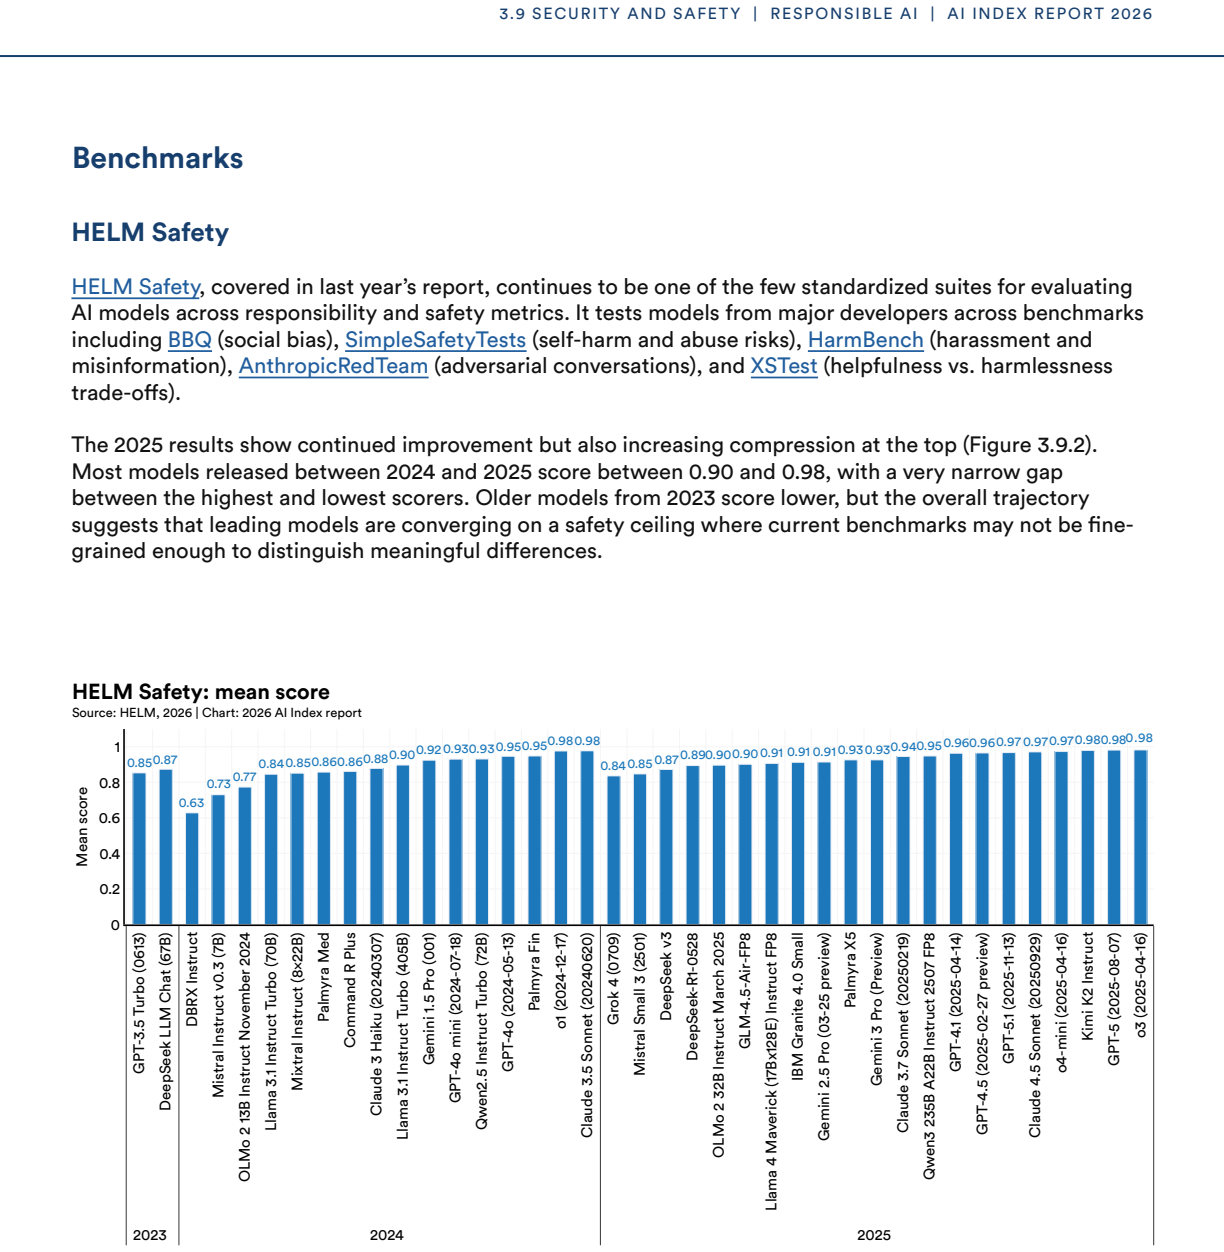
Figure 3.9. Figure 3.9: 2 [PITH_FULL_IMAGE:figures/full_fig_p166_3_9.png] view at source ↗
Figure 3.9
Figure 3.9. Figure 3.9: 3 AILuminate AILuminate v1.0 is a new benchmark designed to test how well AI systems resist prompts that could trigger dangerous, illegal, or undesirable behavior. It covers 12 hazard categories, including violent crimes and child exploitation, and employs a five-tier grading scale from “Poor” to “Excellent.” The benchmark includes two separate evaluations. The first tests safety under normal use, with m… view at source ↗
Figure 3.9
Figure 3.9. Figure 3.9: 4 [PITH_FULL_IMAGE:figures/full_fig_p168_3_9.png] view at source ↗
Figure 3.9
Figure 3.9. Figure 3.9: 5 [PITH_FULL_IMAGE:figures/full_fig_p169_3_9.png] view at source ↗
Figure 4.2
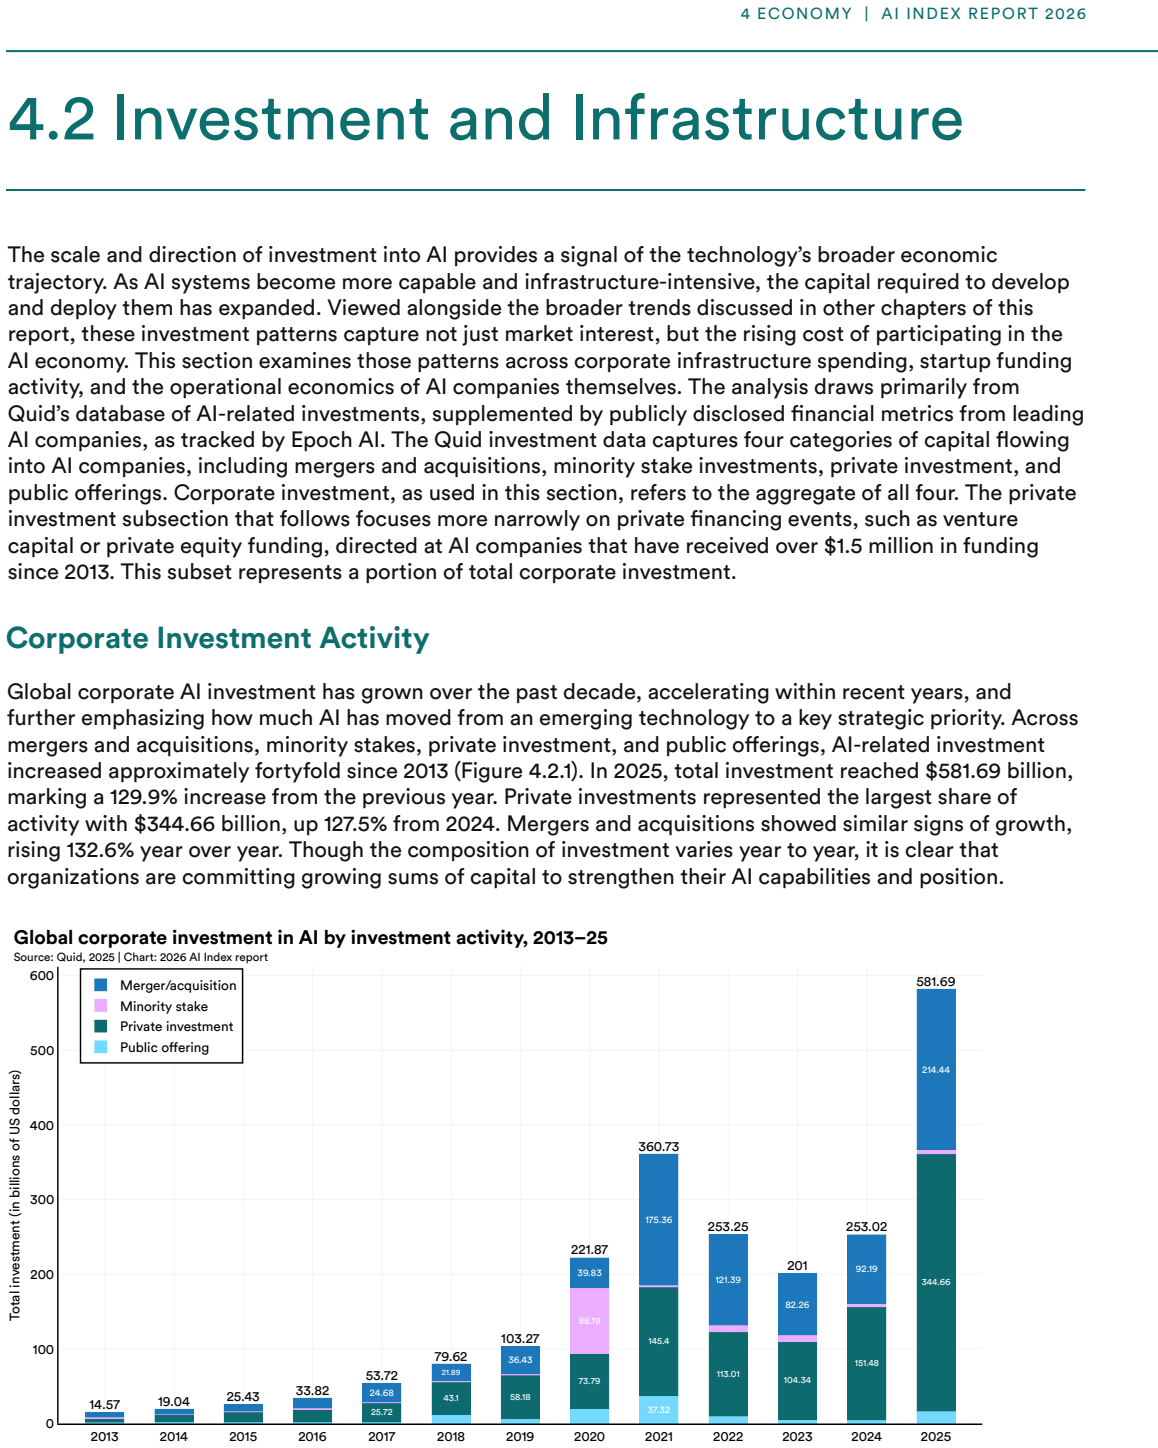
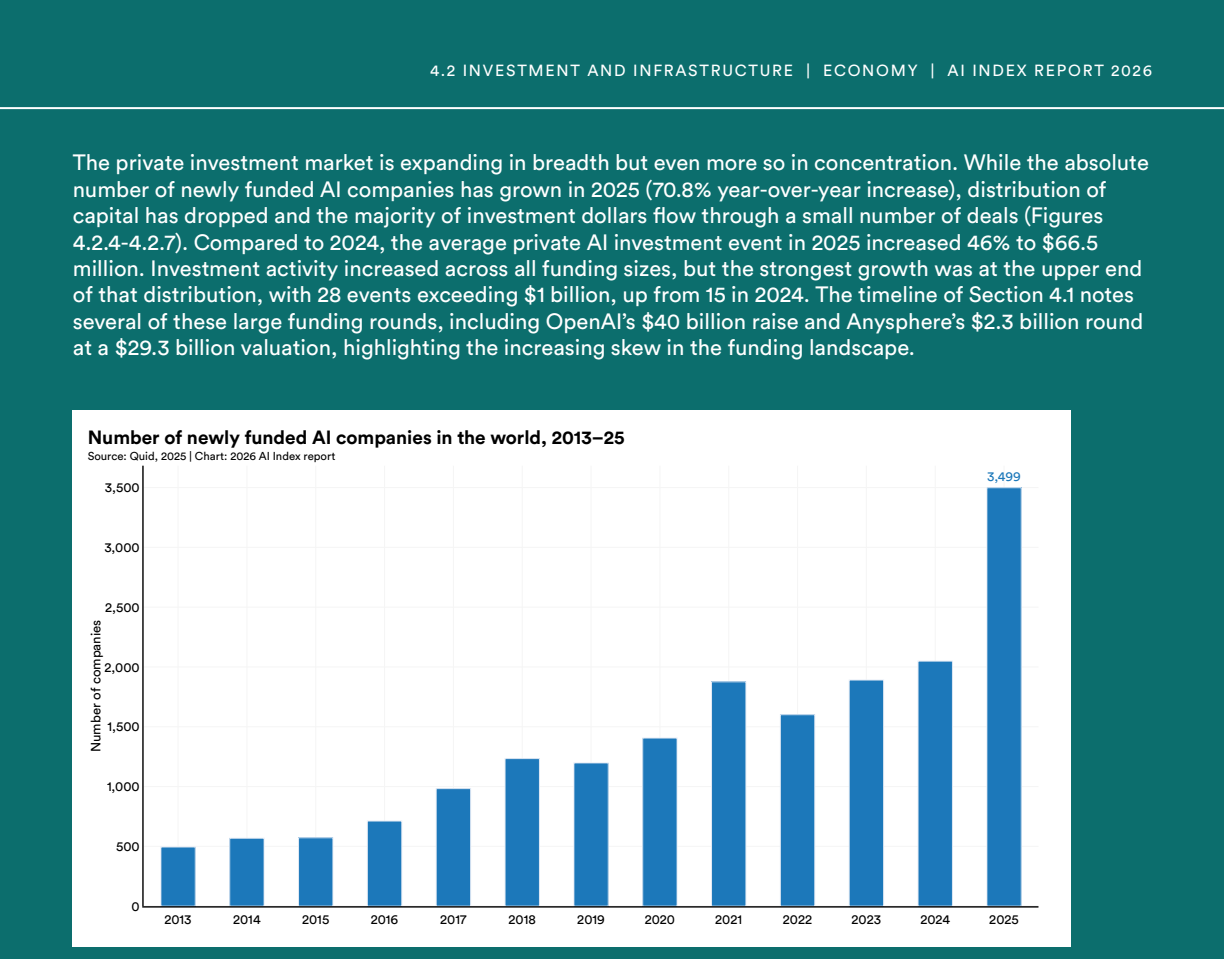
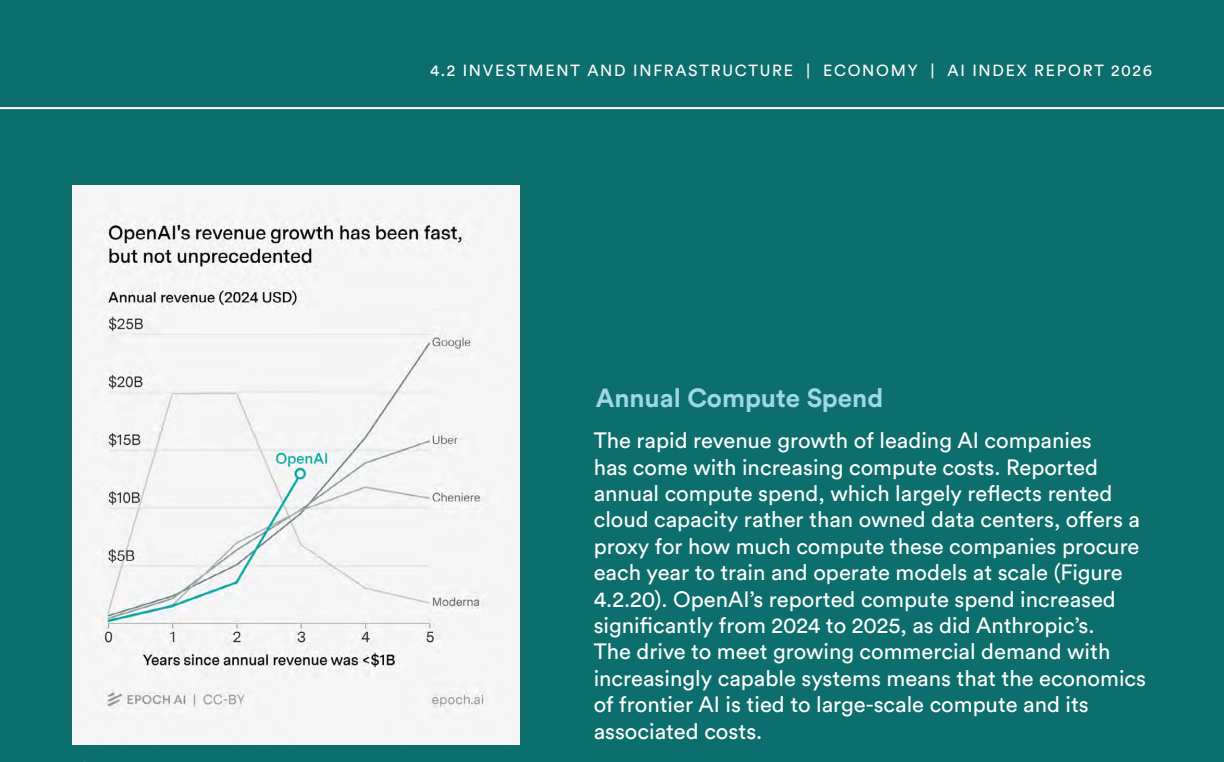
Figure 4.2. Figure 4.2: 1 [PITH_FULL_IMAGE:figures/full_fig_p178_4_2.png] view at source ↗
Figure 4.2
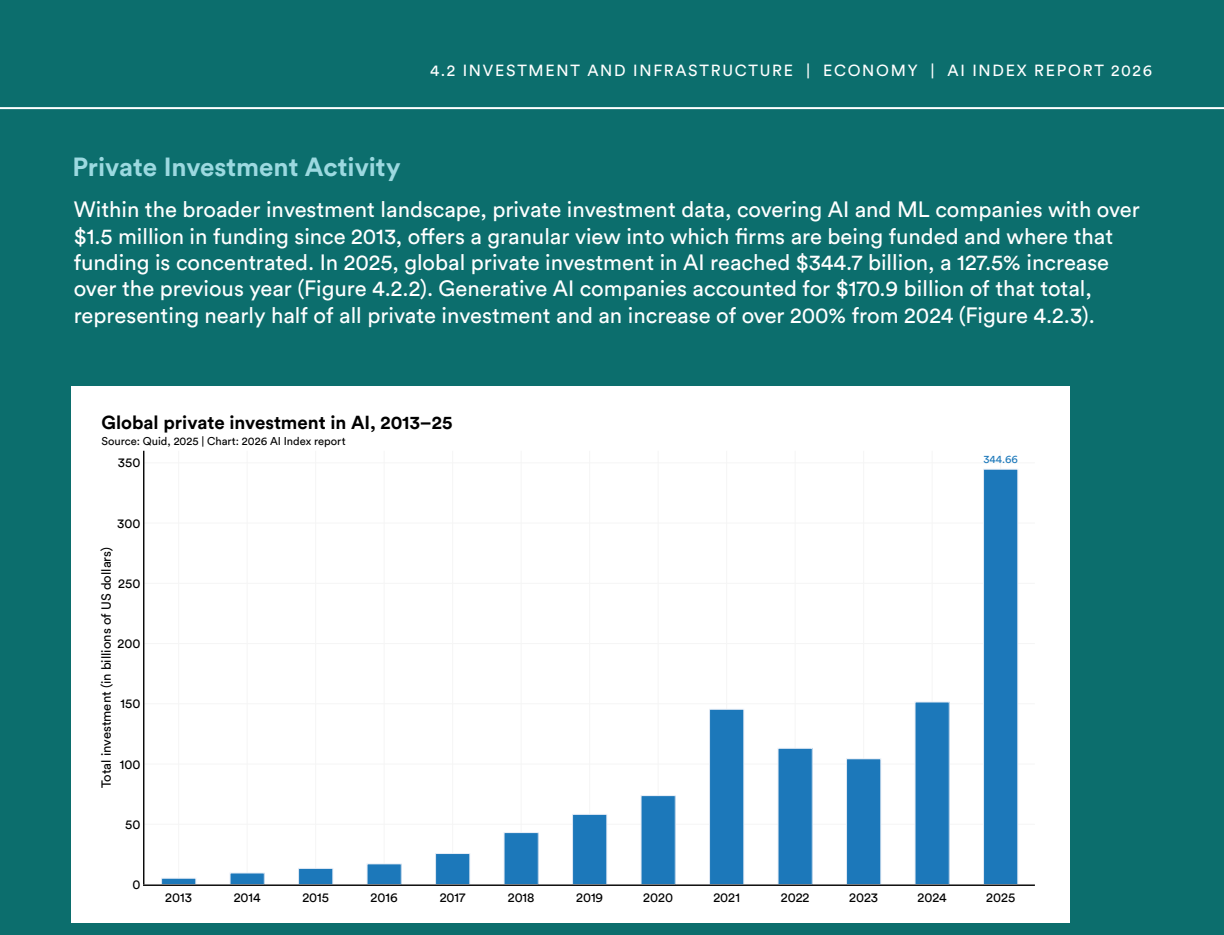
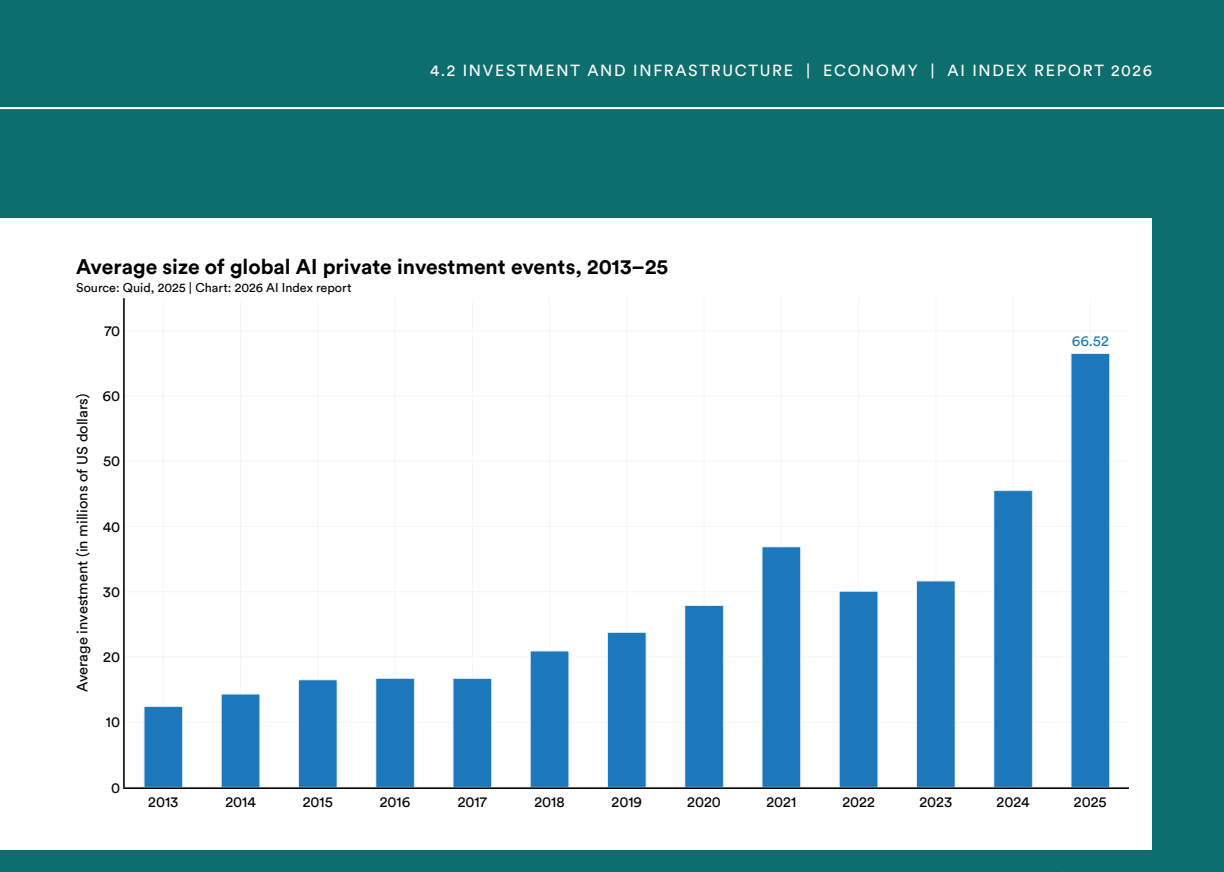
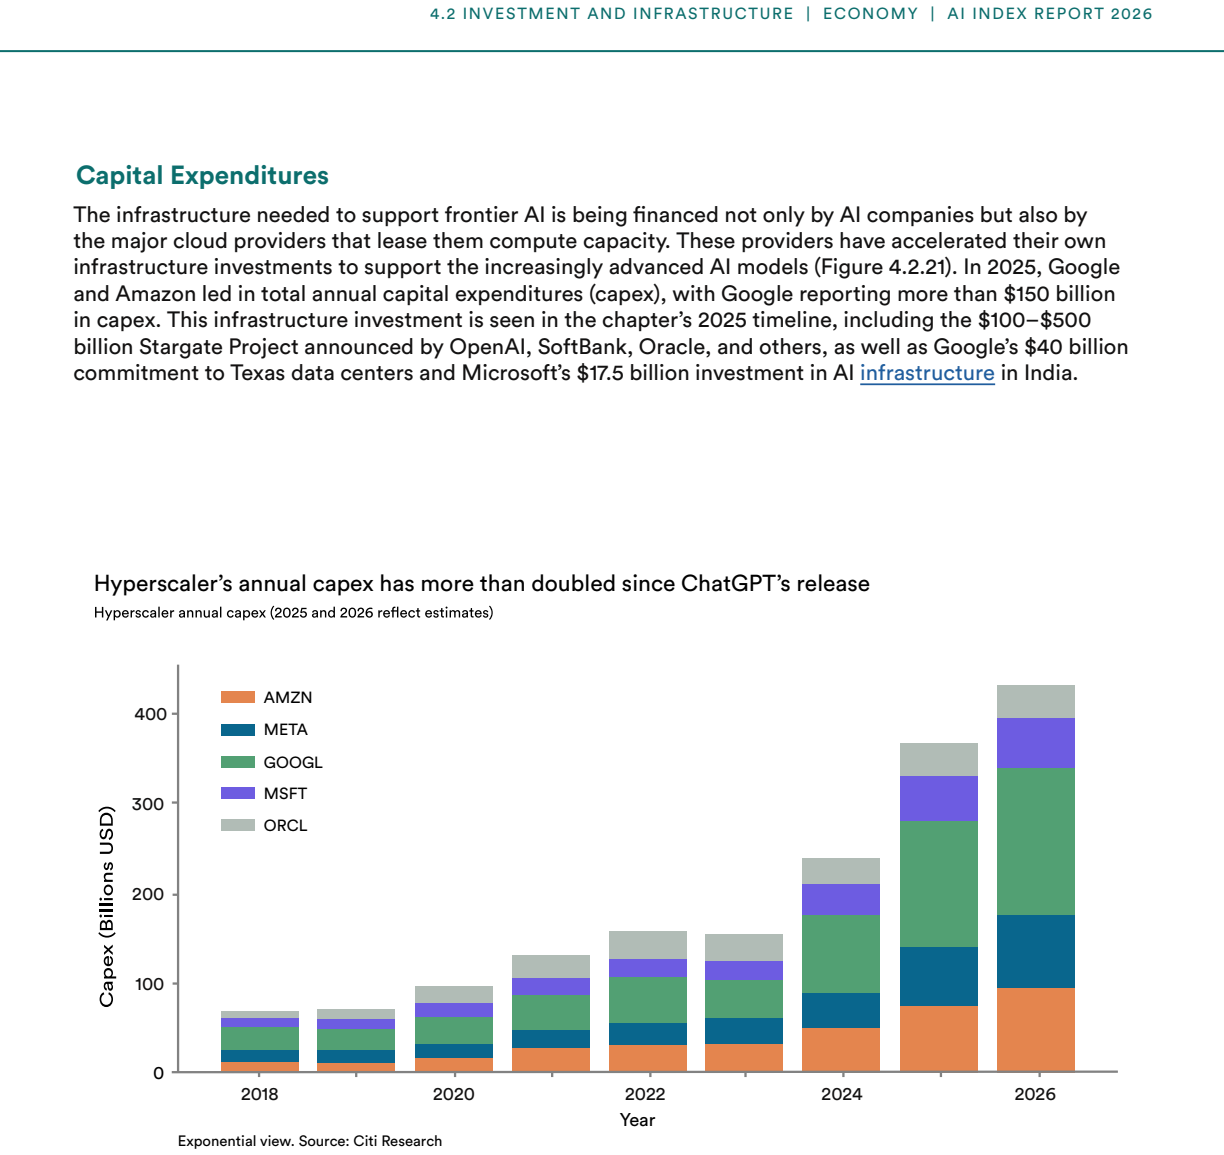
Figure 4.2. Figure 4.2: 2 [PITH_FULL_IMAGE:figures/full_fig_p179_4_2.png] view at source ↗
Figure 4.2
Figure 4.2. Figure 4.2: 4 [PITH_FULL_IMAGE:figures/full_fig_p180_4_2.png] view at source ↗
Figure 4.2
Figure 4.2. Figure 4.2: 6 [PITH_FULL_IMAGE:figures/full_fig_p181_4_2.png] view at source ↗
Figure 4.2
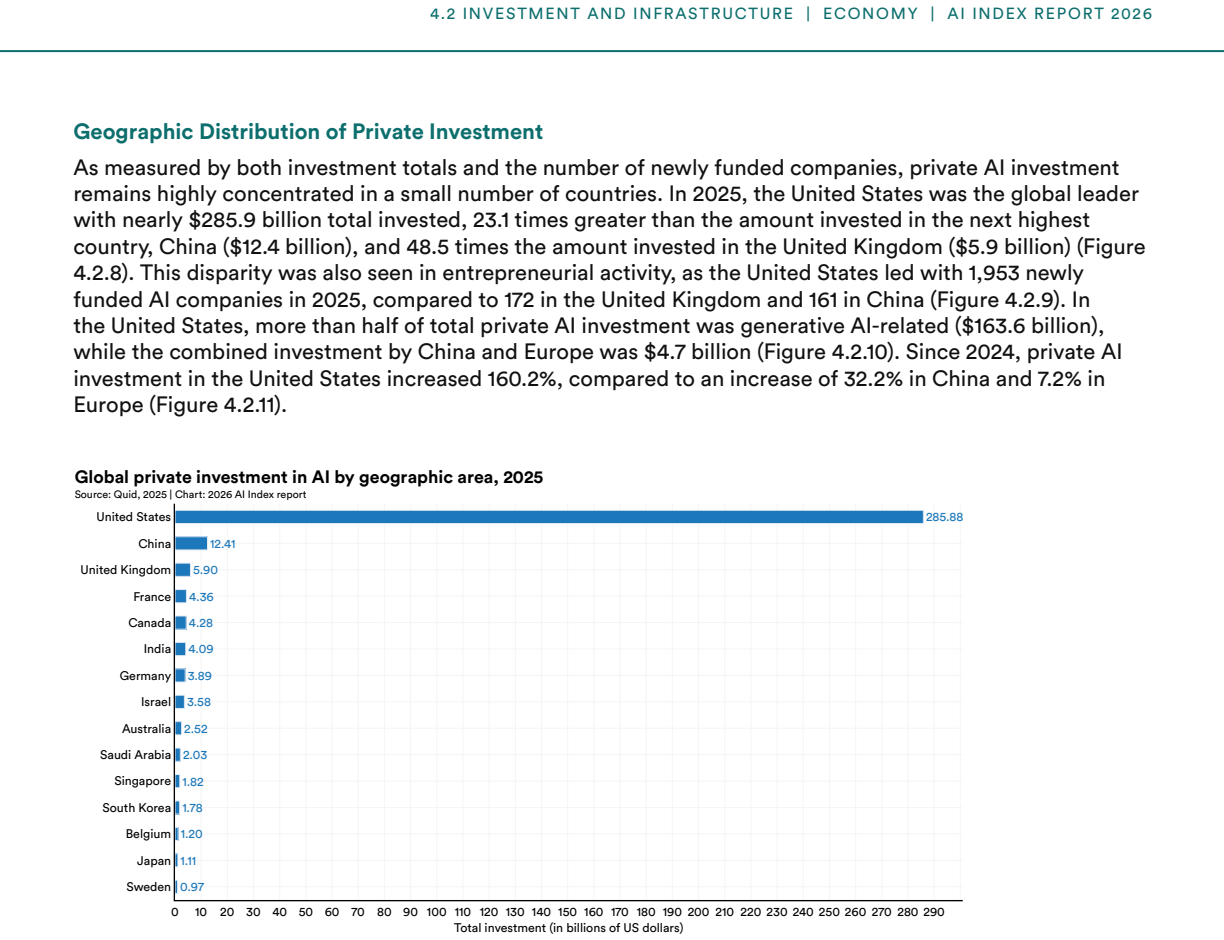
Figure 4.2. Figure 4.2: 8 [PITH_FULL_IMAGE:figures/full_fig_p182_4_2.png] view at source ↗
Figure 4.2
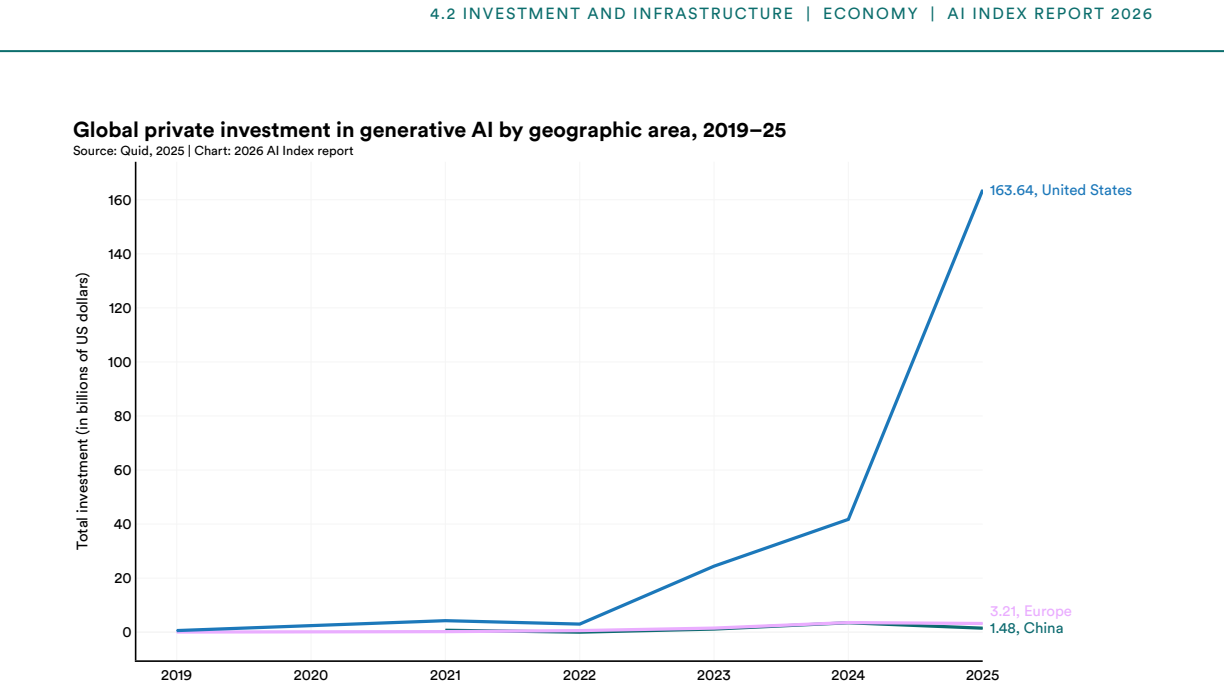
Figure 4.2. Figure 4.2: 10 [PITH_FULL_IMAGE:figures/full_fig_p183_4_2.png] view at source ↗
Figure 4.2
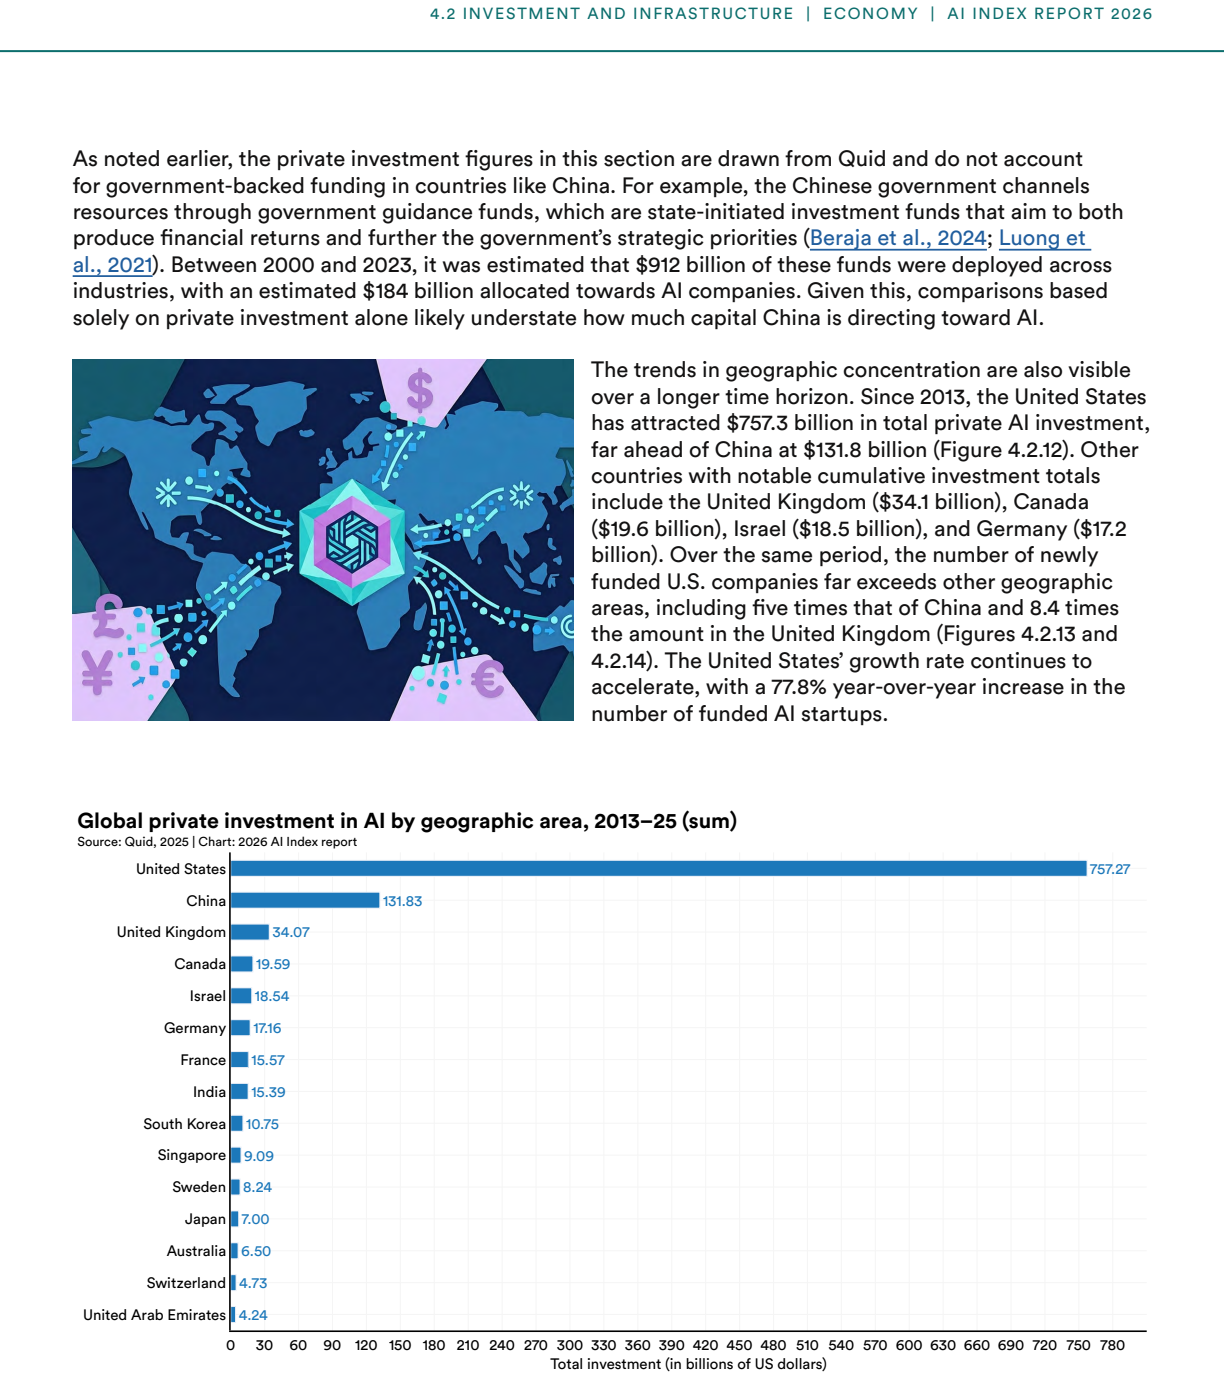
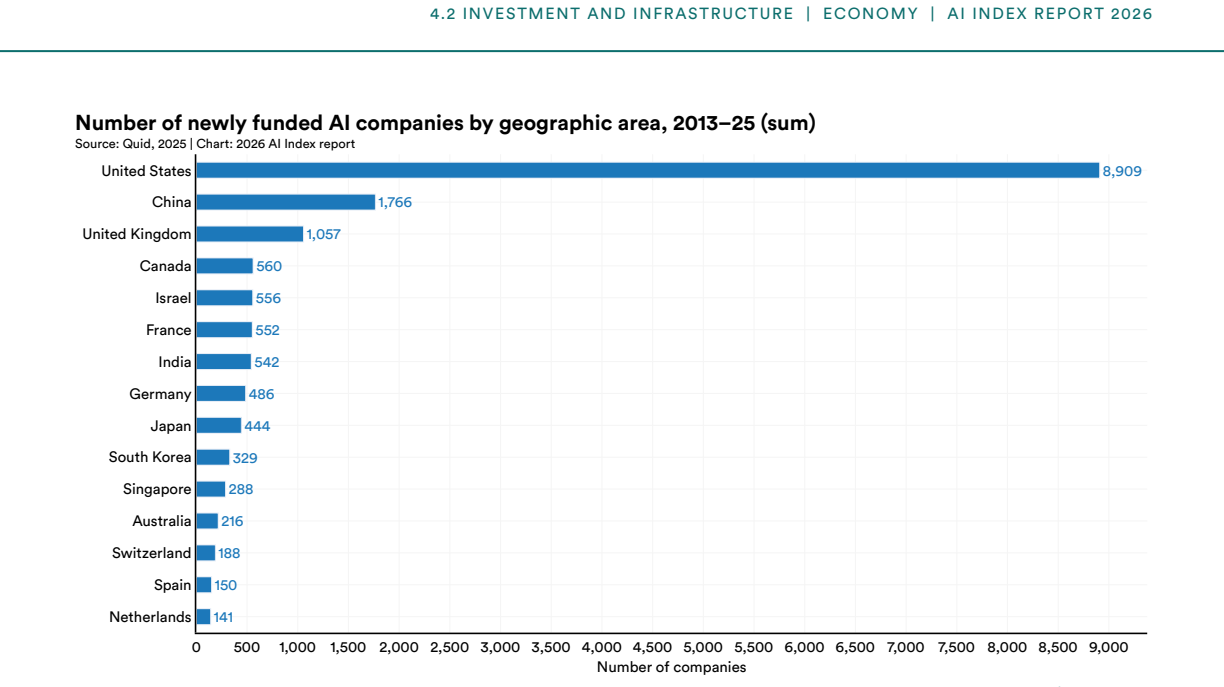
Figure 4.2. Figure 4.2: 12 As noted earlier, the private investment figures in this section are drawn from Quid and do not account for government-backed funding in countries like China. For example, the Chinese government channels resources through government guidance funds, which are state-initiated investment funds that aim to both produce financial returns and further the government’s strategic priorities (Beraja et al., 202… view at source ↗
Figure 4.2
Figure 4.2. Figure 4.2: 13 [PITH_FULL_IMAGE:figures/full_fig_p185_4_2.png] view at source ↗
Figure 4.2
Figure 4.2. Figure 4.2: 15 [PITH_FULL_IMAGE:figures/full_fig_p186_4_2.png] view at source ↗
Figure 4.2
Figure 4.2. Figure 4.2: 16 [PITH_FULL_IMAGE:figures/full_fig_p187_4_2.png] view at source ↗
Figure 4.2
Figure 4.2. Figure 4.2: 17 [PITH_FULL_IMAGE:figures/full_fig_p188_4_2.png] view at source ↗
Figure 4.2
Figure 4.2. Figure 4.2: 18 [PITH_FULL_IMAGE:figures/full_fig_p189_4_2.png] view at source ↗
Figure 4.2
Figure 4.2. Figure 4.2: 19 [PITH_FULL_IMAGE:figures/full_fig_p190_4_2.png] view at source ↗
Figure 4.2
Figure 4.2. Figure 4.2: 21 [PITH_FULL_IMAGE:figures/full_fig_p191_4_2.png] view at source ↗
Figure 4.2
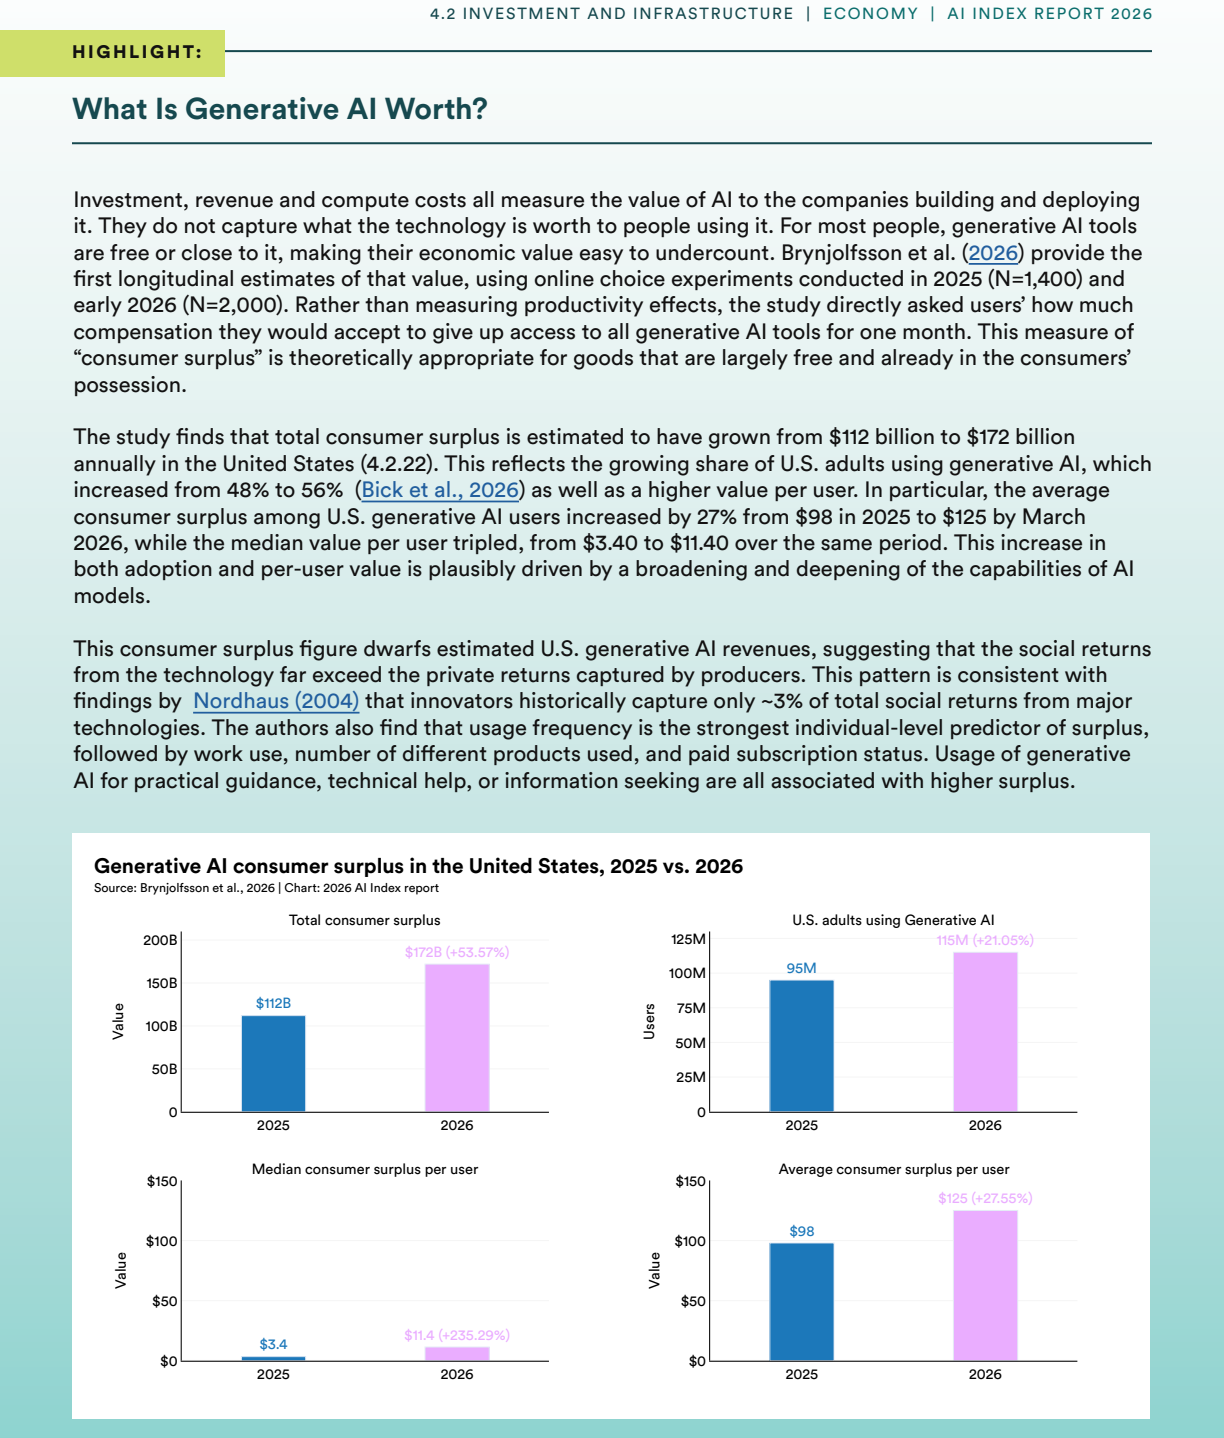
Figure 4.2. Figure 4.2: 22 [PITH_FULL_IMAGE:figures/full_fig_p192_4_2.png] view at source ↗
Figure 4.3
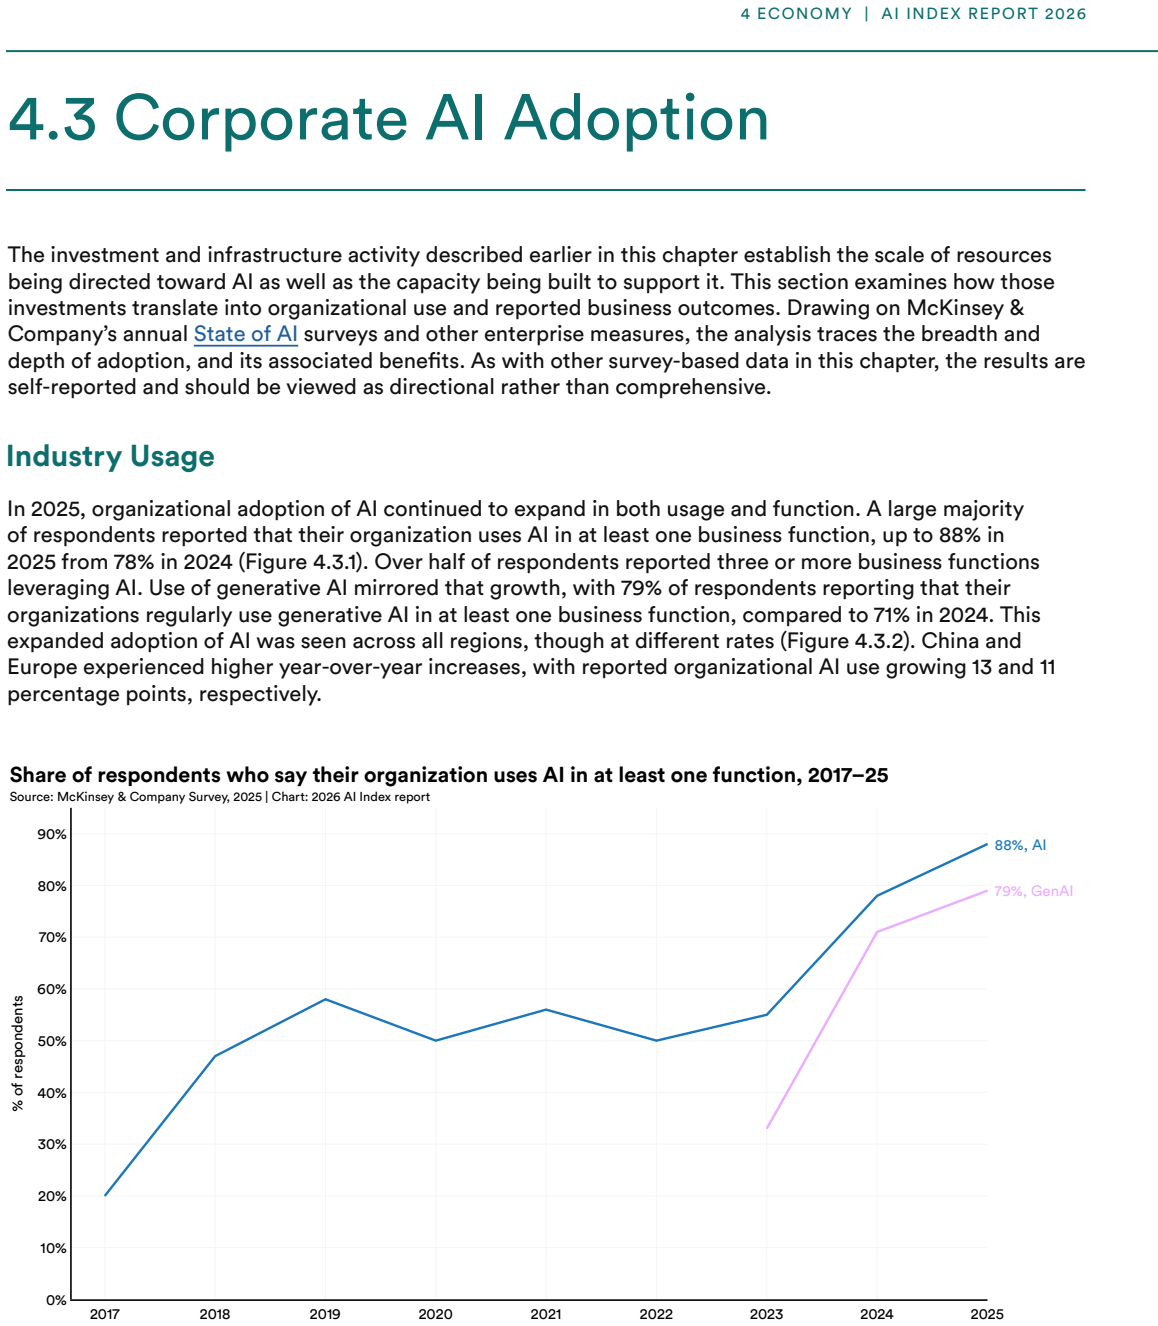
Figure 4.3. Figure 4.3: 1 [PITH_FULL_IMAGE:figures/full_fig_p193_4_3.png] view at source ↗
Figure 4.3
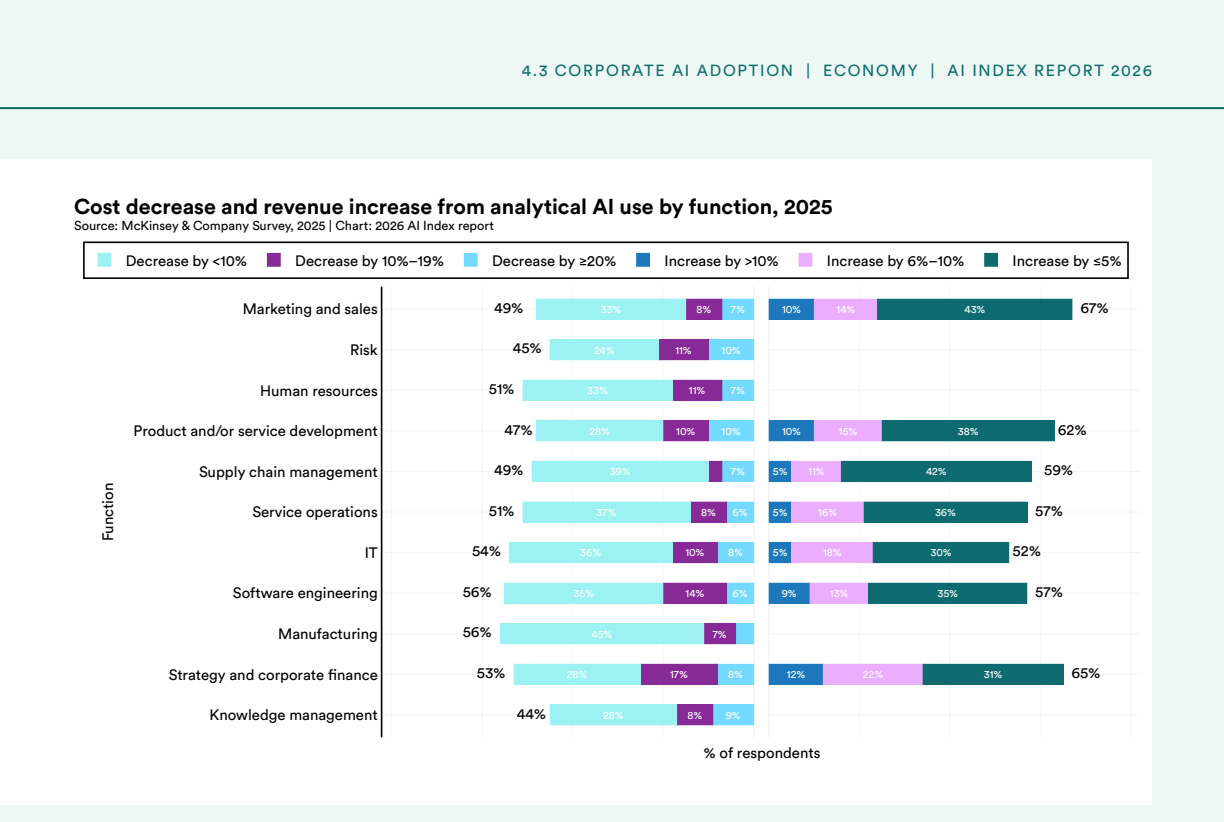
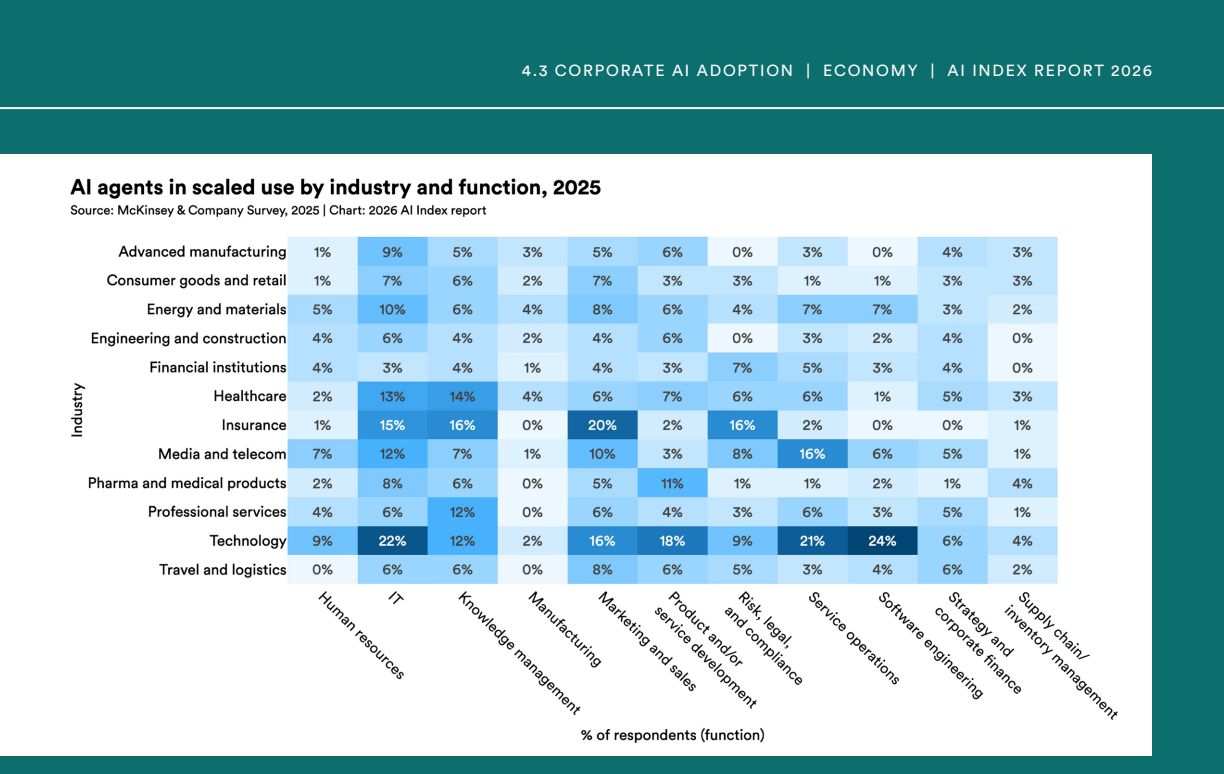
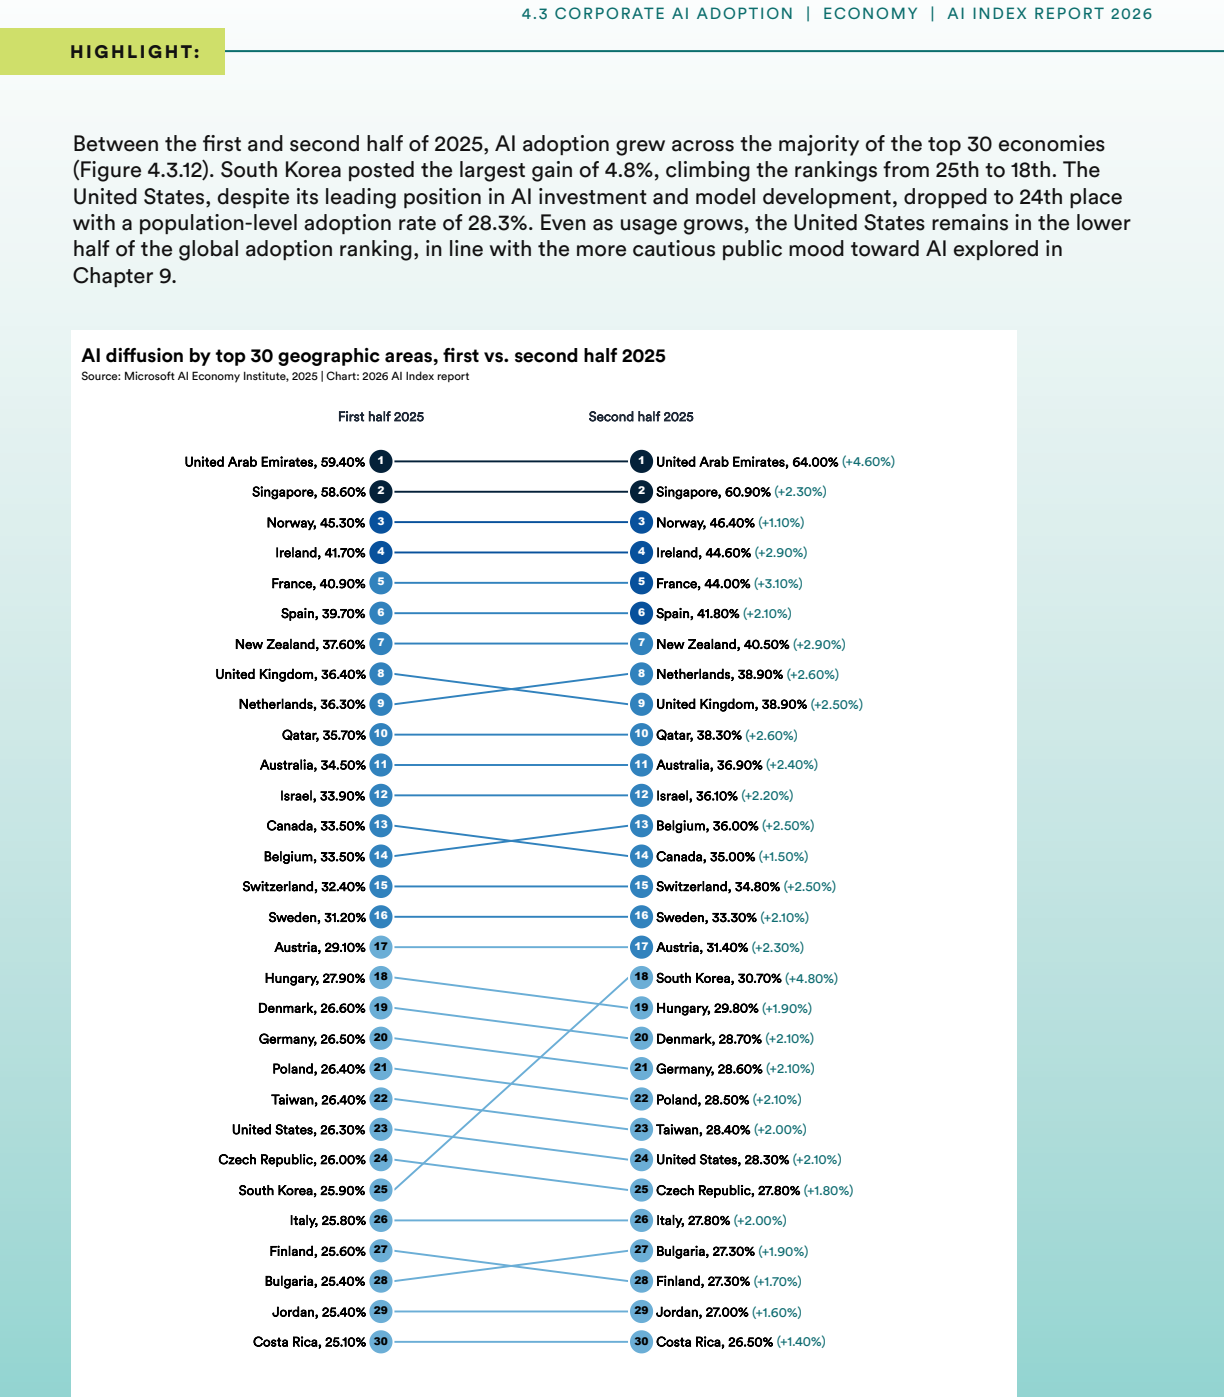
Figure 4.3. Figure 4.3: 2 Adoption patterns varied across industry and function, with some industry/function pairings showing higher rates of diffusion than others ( [PITH_FULL_IMAGE:figures/full_fig_p194_4_3.png] view at source ↗
Figure 4.3
Figure 4.3. Figure 4.3: 31 1 “Advanced industries” comprises respondents from sectors such as advanced electronics, aerospace and defense, automotive and assembly, and semiconductors. “Energy and materials” encompasses respondents from agriculture, chemicals, electric power and natural gas, metals and mining, oil and gas, as well as paper, forest products, and packaging. 4.3 CORPORATE AI ADOPTION | ECONOMY | AI INDEX REPORT 202… view at source ↗
Figure 4.3
Figure 4.3. Figure 4.3: 4 64% 45% 45% 45% 38% 36% 33% 33% 25% 21% 31% 32% 33% 31% 36% 39% 42% 49% 14% 19% 22% 20% 24% 26% 27% 23% 25% 4% 7% 0% 20% 40% 60% 80% Change in market share Attraction and retention of talent Organic revenue growth Pro�tability Cost Competitive di�erentiation Customer satisfaction Employee satisfaction Innovation Improved Had no e�ect Don’t know Worsened % of respondents Organizational measure AI impact… view at source ↗
Figure 4.3
Figure 4.3. Figure 4.3: 63 3 Figures may not add up to 100% because of rounding; respondents who said “I don’t know” were not shown but represent <1% of the total, which could also cause bars to not add up to 100% [PITH_FULL_IMAGE:figures/full_fig_p197_4_3.png] view at source ↗
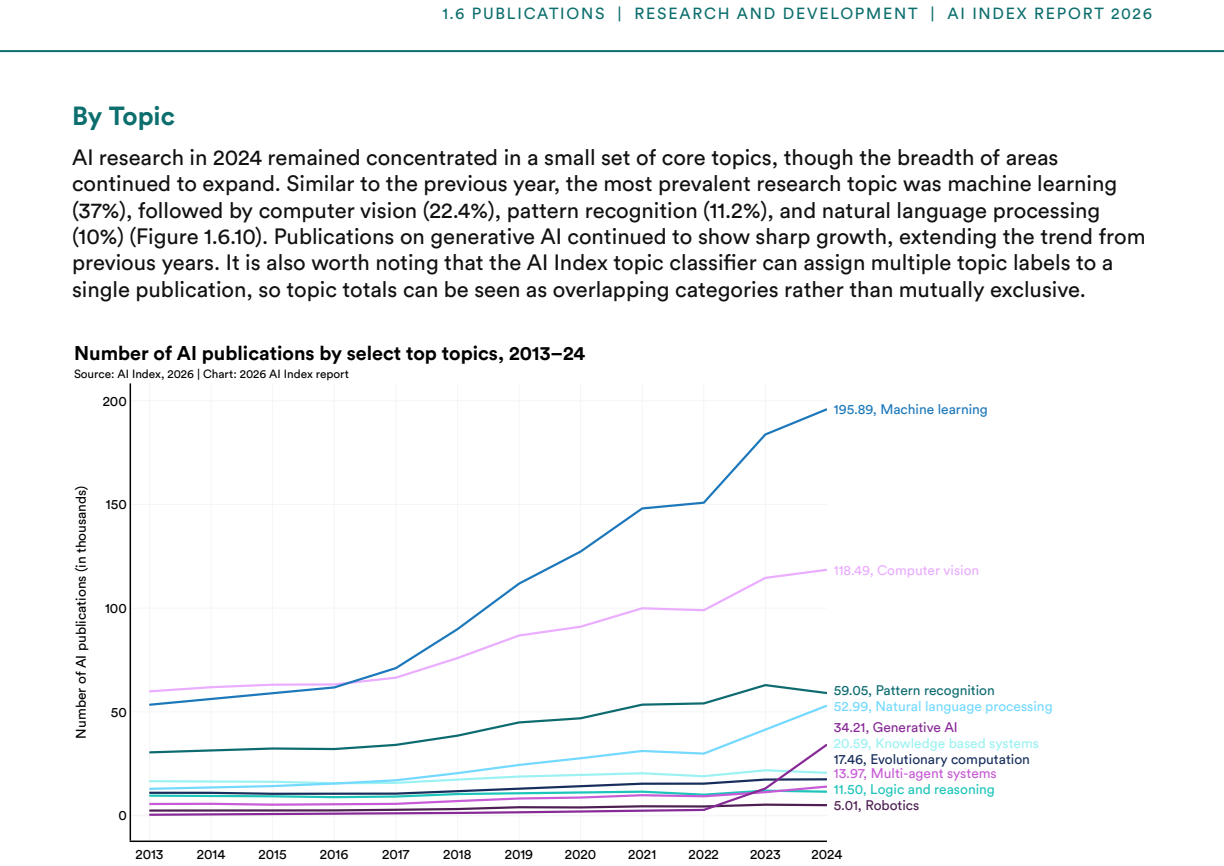
Figure 4.3
Figure 4.3. Figure 4.3: 7 4% 3% 69% 66% 68% 71% 73% 77% 85% 82% 85% 88% 91% 4% 5% 5% 5% 4% 3% 3% 7% 12% 11% 8% 9% 6% 5% 5% 4% 4% 3% 6% 6% 6% 7% 6% 5% 3% 3% 8% 7% 6% 6% 5% 5% 4% 3% 3% 0% 10% 20% 30% 40% 50% 60% 70% 80% 90% 100% Manufacturing Supply chain/inventory management Strategy and corporate LJnance Human resources Risk Software engineering Product and/or service development Service operations Marketing and sales Knowledge … view at source ↗
Figure 4.3
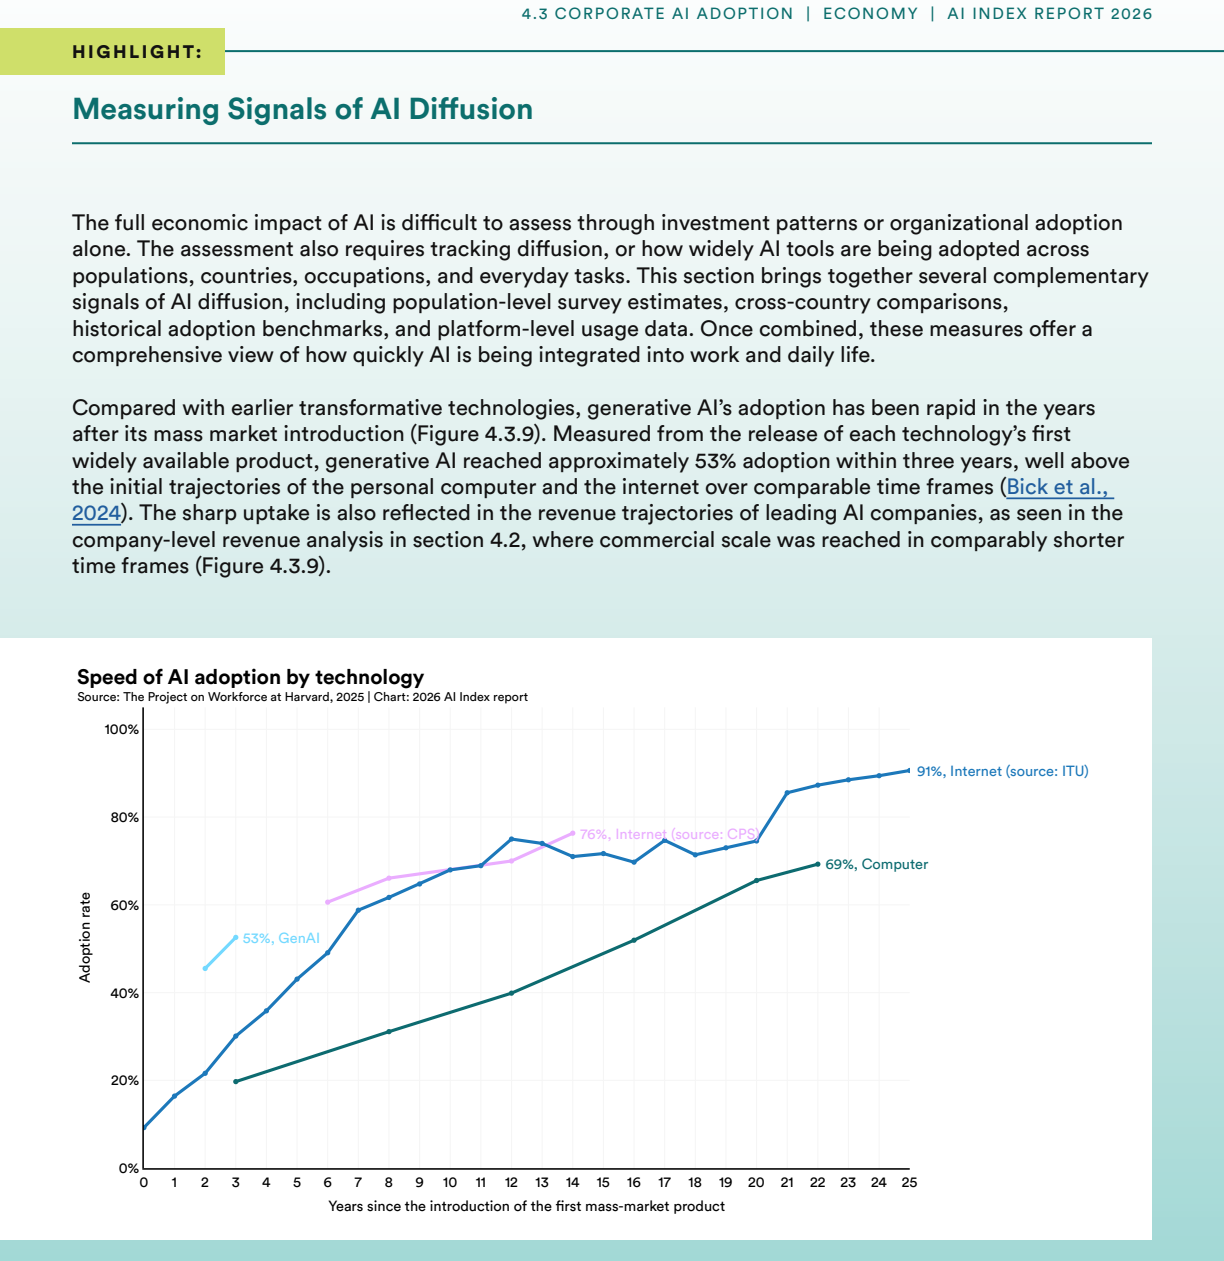
Figure 4.3. Figure 4.3: 95 5 Source: https://www.genaiadoptiontracker.com. The figure shows overall usage rates for three technologies: generative AI, computers, and the internet. The horizontal axis represents years since the introduction of the first mass-market product for each technology. We use 1981 as the introduc￾tion year for computers, which was the year the IBM PC was released. We use 1995 as the introduction year for… view at source ↗
Figure 4.3
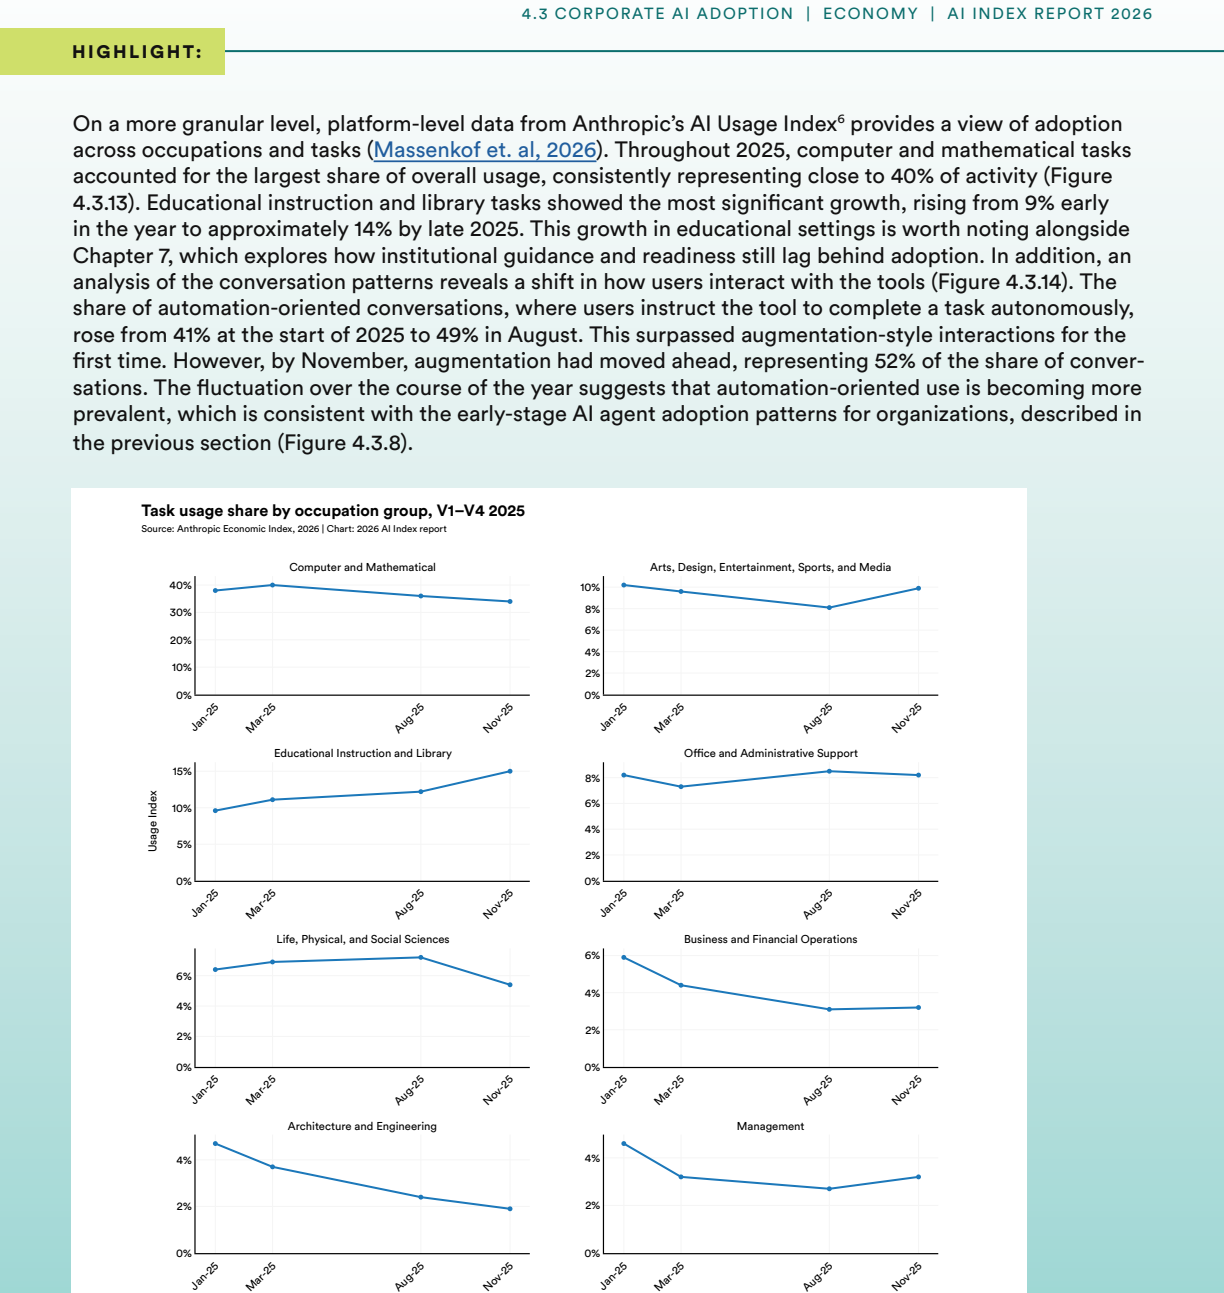
Figure 4.3. Figure 4.3: 10 [PITH_FULL_IMAGE:figures/full_fig_p200_4_3.png] view at source ↗
Figure 4.3
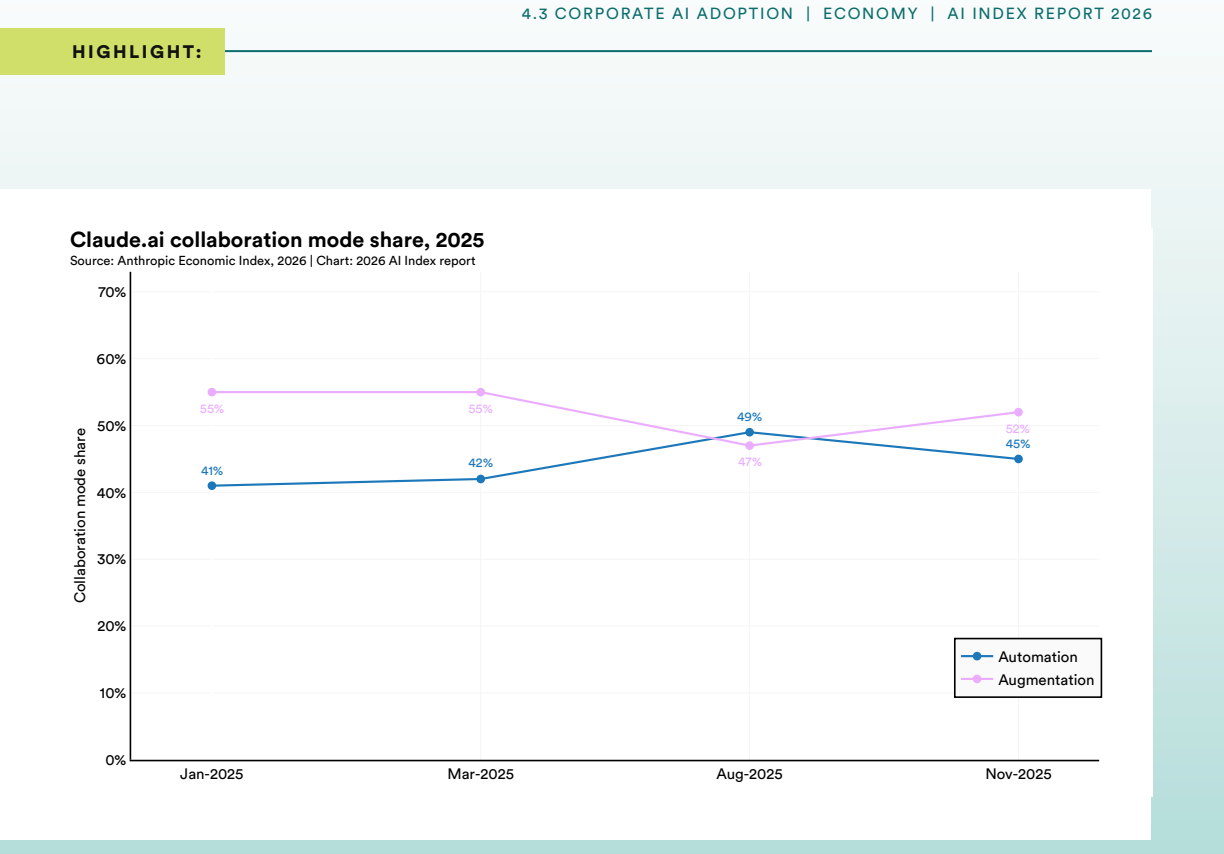
Figure 4.3. Figure 4.3: 12 [PITH_FULL_IMAGE:figures/full_fig_p201_4_3.png] view at source ↗
Figure 4.3
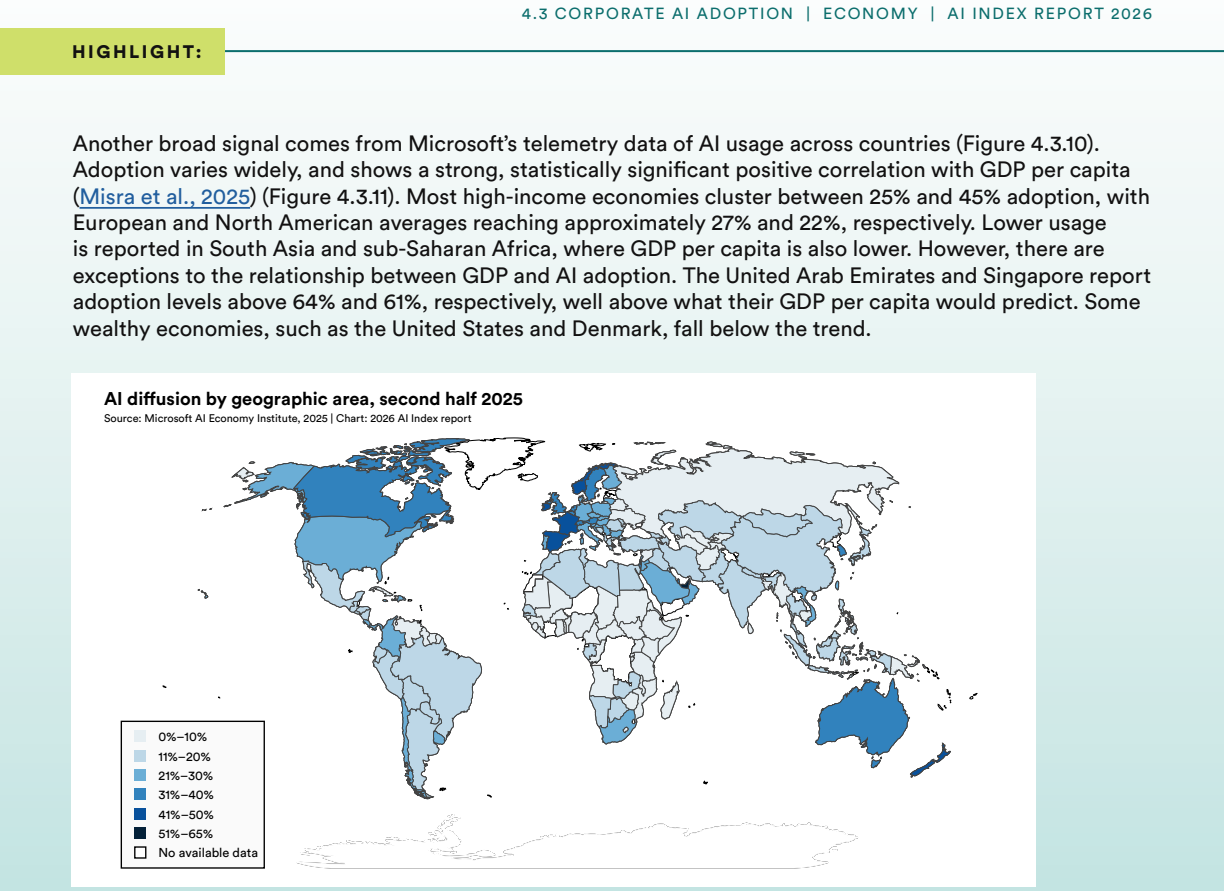
Figure 4.3. Figure 4.3: 137 6 The Anthropic AI Usage Index (AUI) measures Claude usage relative to the working-age population by calculating each geography’s share of Claude usage divided by its share of the working-age population (ages 15–64). Countries with an AUI greater than 1 use Claude more often than ex￾pected based on their working-age population alone, while those with an AUI less than 1 use it less. 7 V1–V4 refer to t… view at source ↗
Figure 4.3
Figure 4.3. Figure 4.3: 14 AI diffusion is also shaped by broader societal attitudes, including public trust and optimism about the technology. Chapter 9 studies these trends to determine how excitement for and exposure to AI vary across countries and what they suggest about the societal experience of increasing adoption [PITH_FULL_IMAGE:figures/full_fig_p203_4_3.png] view at source ↗
Figure 4.4
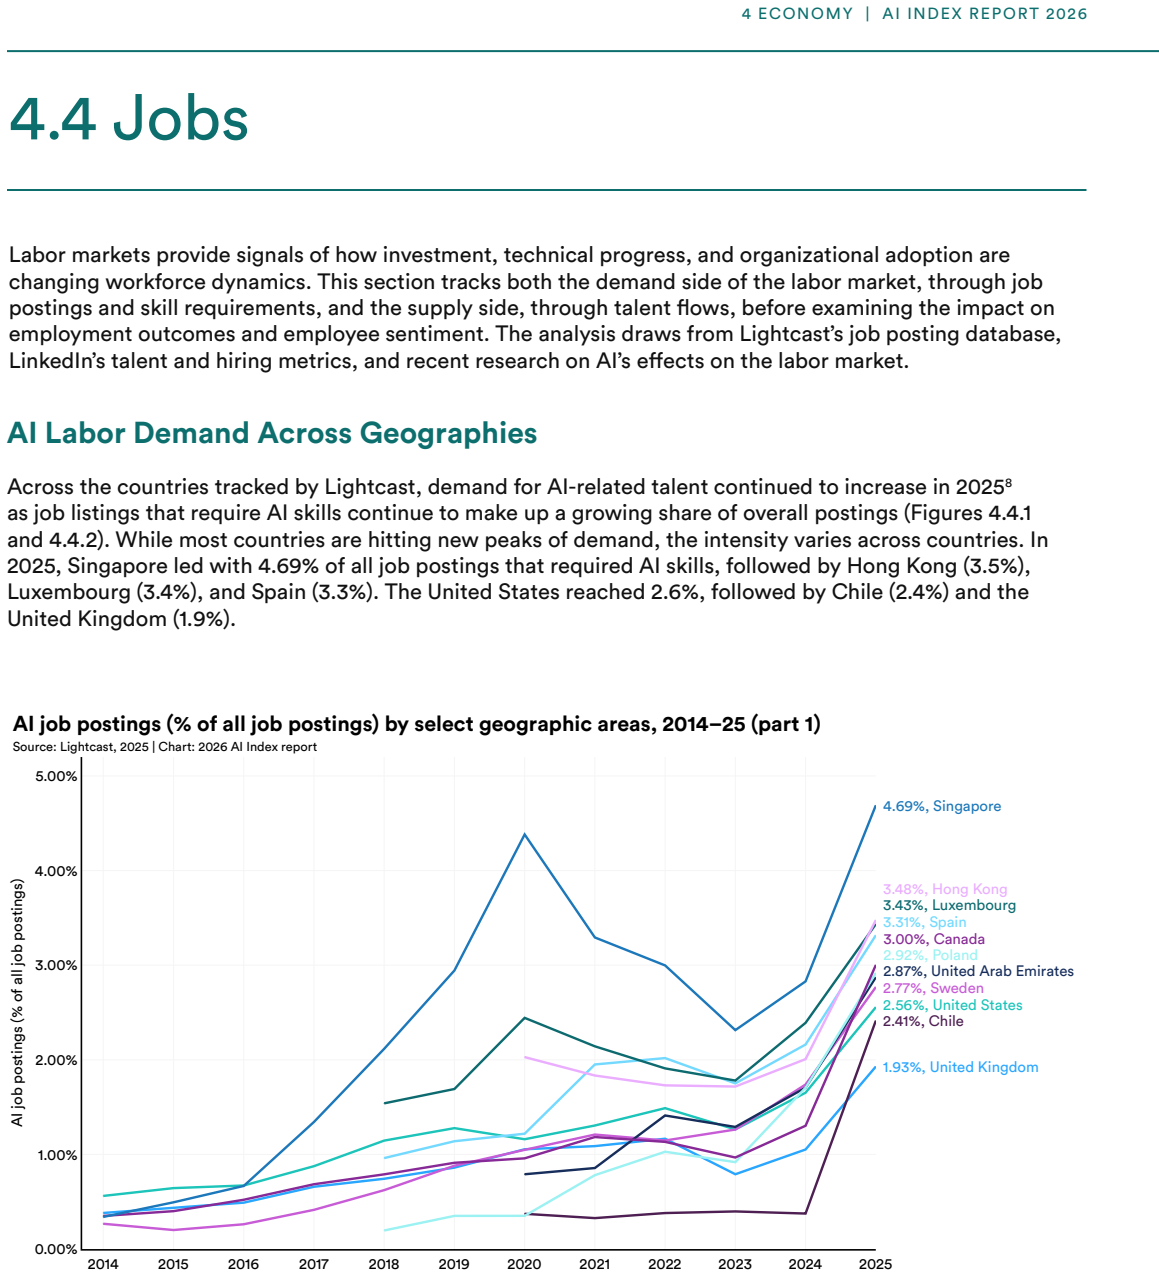
Figure 4.4. Figure 4.4: 1 [PITH_FULL_IMAGE:figures/full_fig_p204_4_4.png] view at source ↗
Figure 4.4
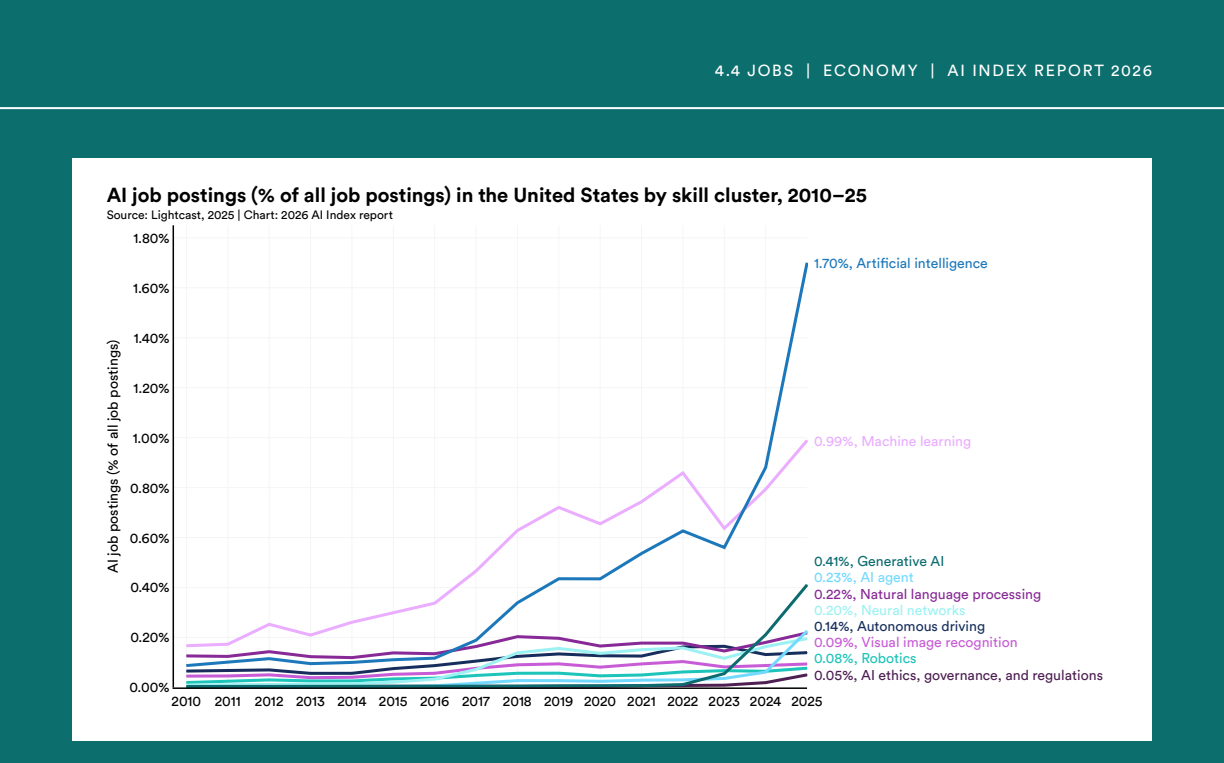
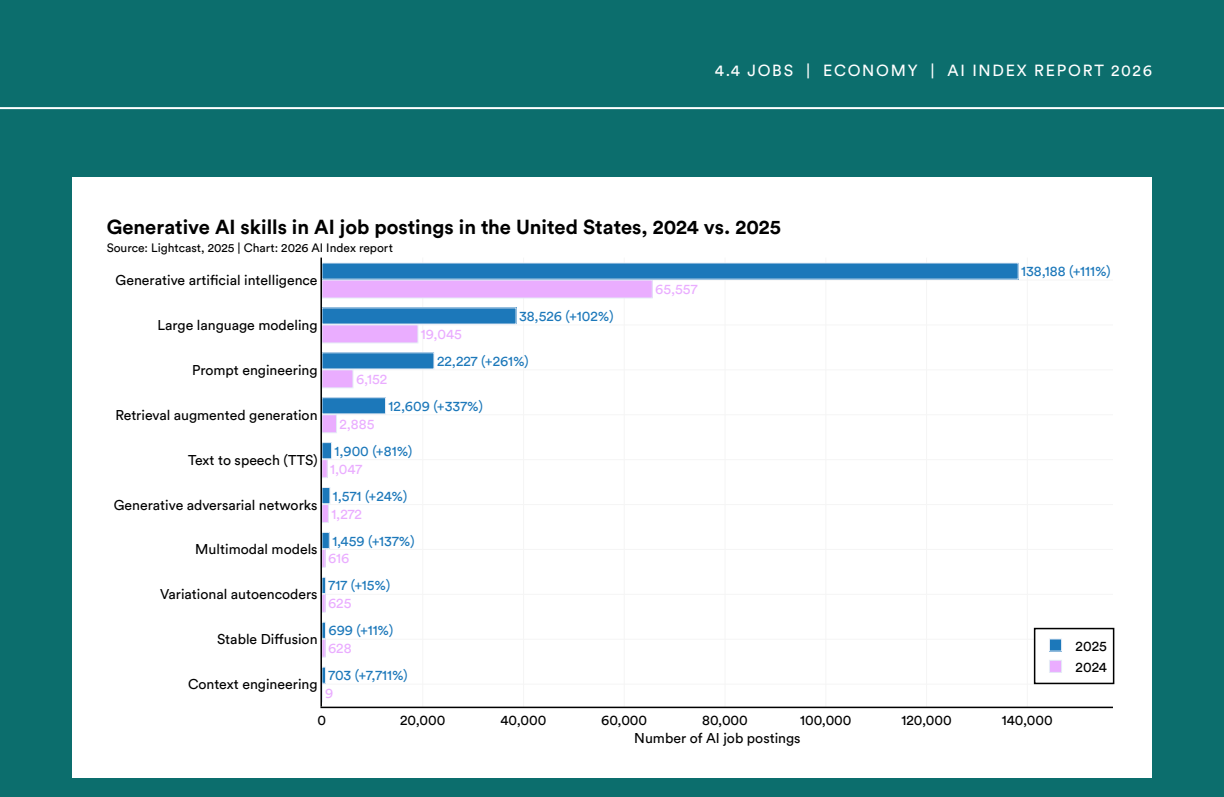
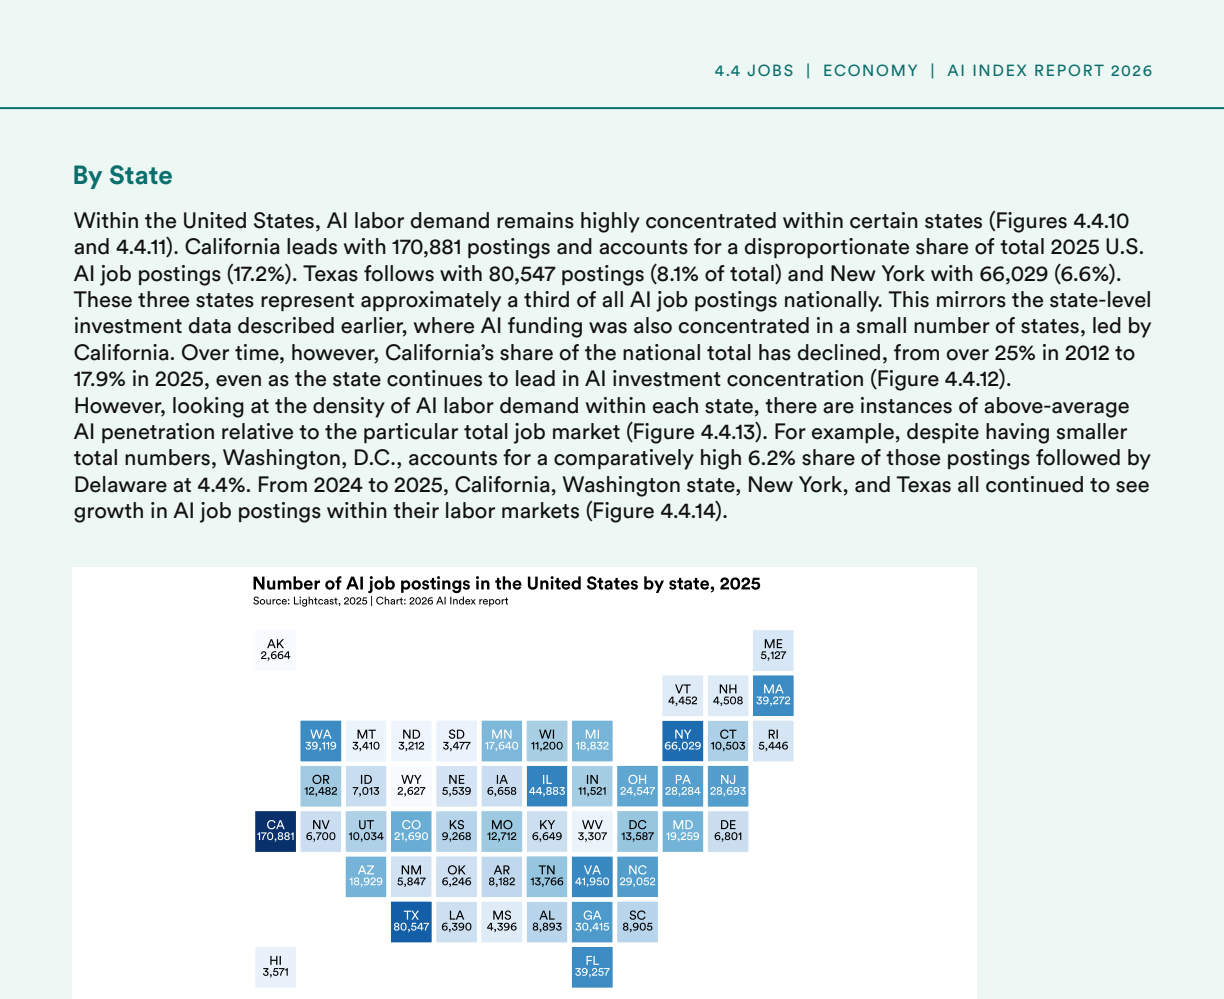
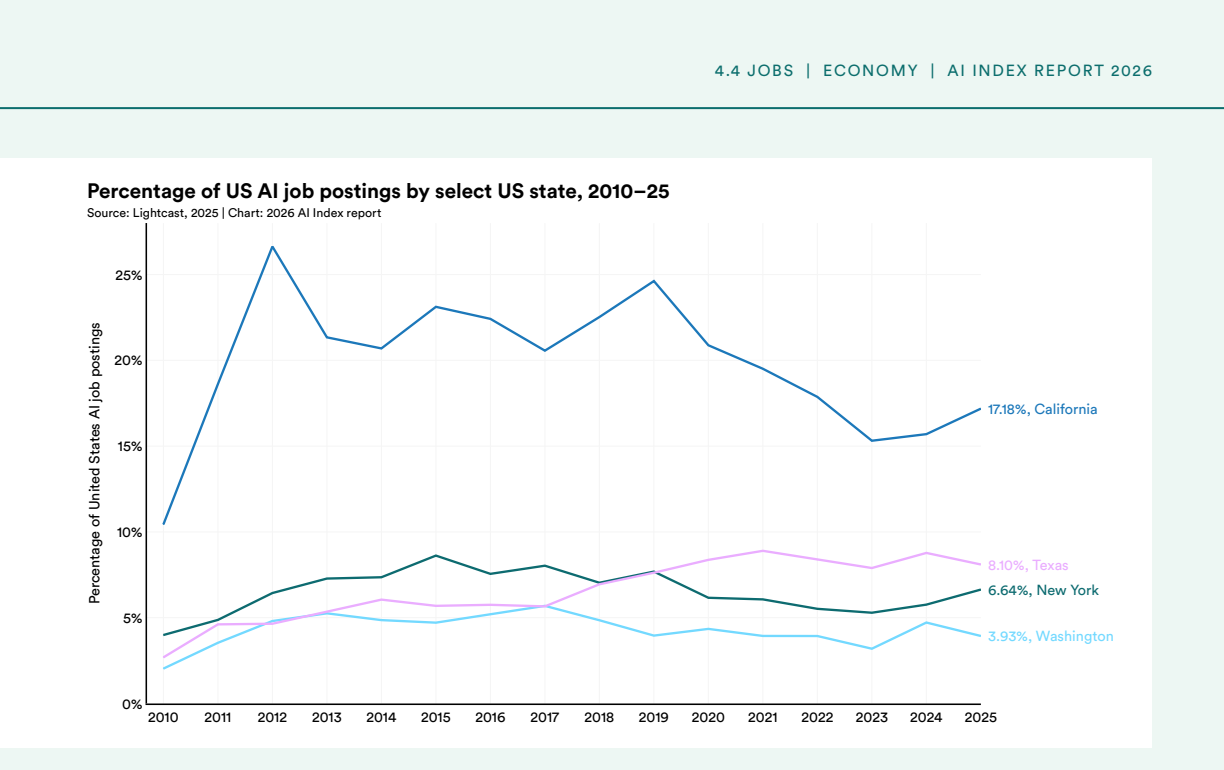
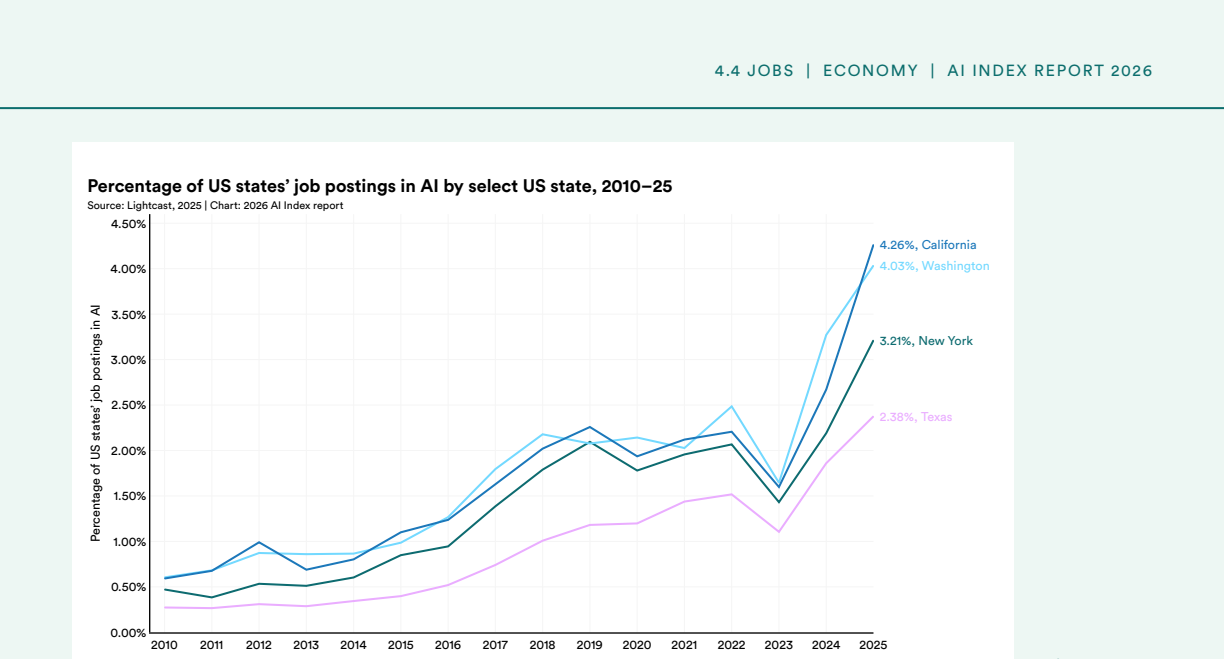
Figure 4.4. Figure 4.4: 2 Within the United States, AI labor demand can be disaggregated by skillset to reveal how the workforce footprint is evolving (Figures 4.4.3–4.4.8). In 2025, broad AI and machine learning skill clusters remain the most frequently cited categories in AI job posting, accounting for 1.7% and 1.0% of all job postings. Among the top specialized skills, Python appeared the most often, in 258,674 posts, a 391%… view at source ↗
Figure 4.4
Figure 4.4. Figure 4.4: 39 9 A single job posting can list multiple AI skills. 2010 2011 2012 2013 2014 2015 2016 2017 2018 2019 2020 2021 2022 2023 2024 2025 0.00% 0.20% 0.40% 0.60% 0.80% 1.00% 1.20% 1.40% 1.60% 1.80% AI job postings (% of all job postings) 0.05%, AI ethics, governance, and regulations 0.08%, Robotics 0.09%, Visual image recognition 0.14%, Autonomous driving 0.20%, Neural networks 0.22%, Natural language proce… view at source ↗
Figure 4.4
Figure 4.4. Figure 4.4: 5 [PITH_FULL_IMAGE:figures/full_fig_p207_4_4.png] view at source ↗
Figure 4.4
Figure 4.4. Figure 4.4: 710 10 For definitions of each skill category, see the Lightcast taxonomy at https://lightcast.io/open-skills or the Appendix. 151 1,310 5,535 5,430 1,416 1,635 2,316 194 549 192 16,541 (+10,854%) 15,217 (+1,062%) 14,376 (+160%) 6,976 (+28%) 6,395 (+352%) 5,461 (+234%) 4,596 (+98%) 4,294 (+2,113%) 3,366 (+513%) 2,850 (+1,384%) 0 2,000 4,000 6,000 8,000 10,000 12,000 14,000 16,000 18,000 Agentic systems M… view at source ↗
Figure 4.4
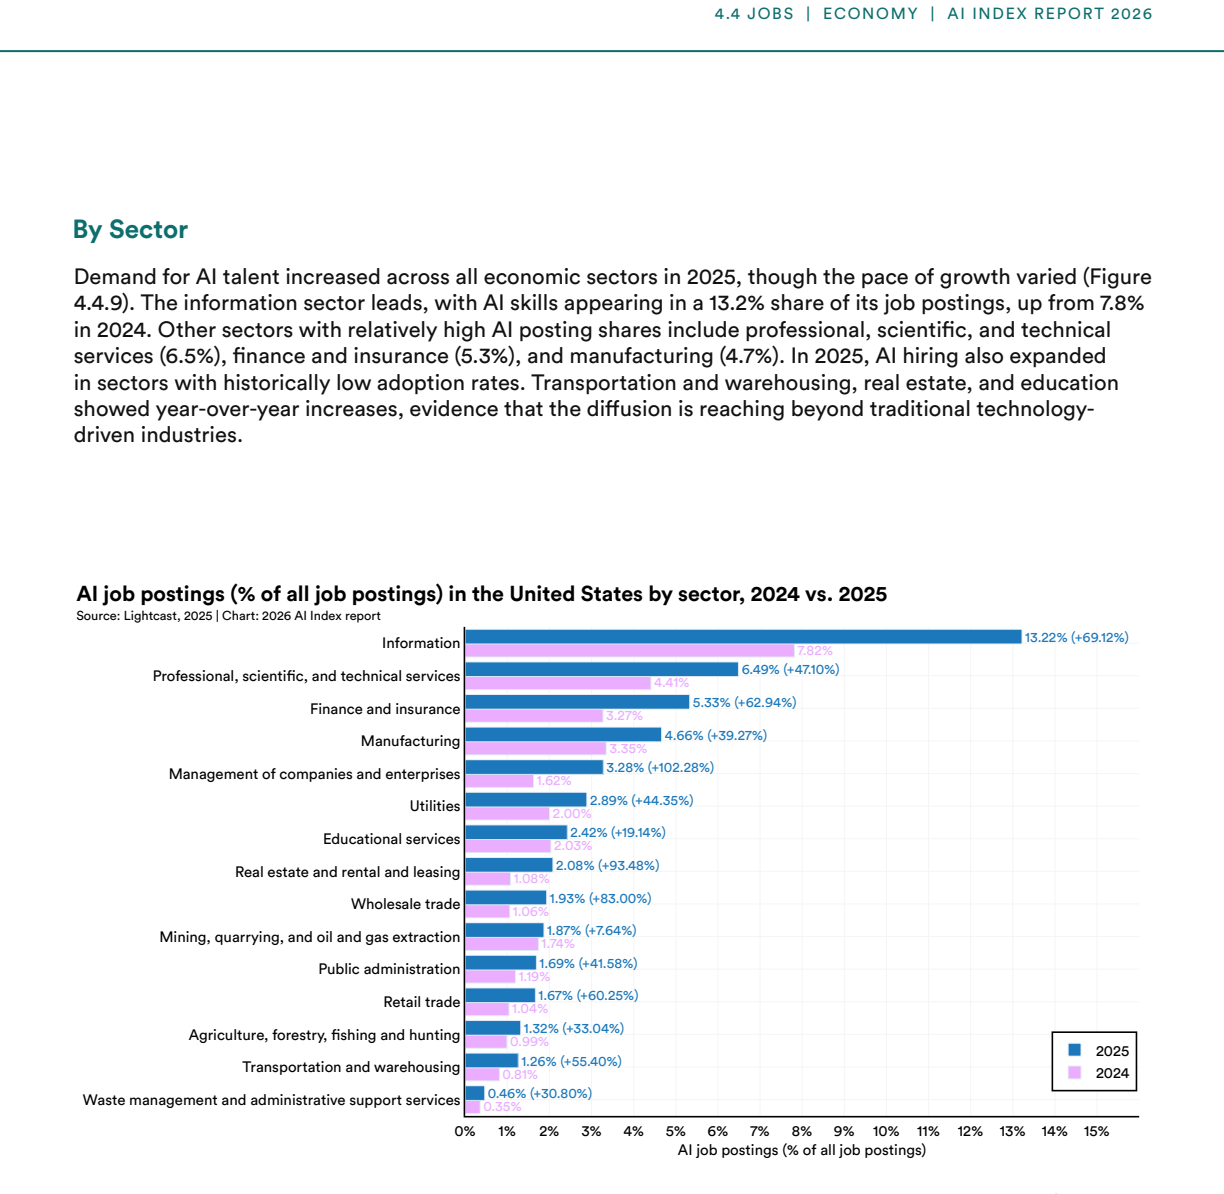
Figure 4.4. Figure 4.4: 911 11 The sector classifications in [PITH_FULL_IMAGE:figures/full_fig_p209_4_4.png] view at source ↗
Figure 4.4
Figure 4.4. Figure 4.4: 10 [PITH_FULL_IMAGE:figures/full_fig_p210_4_4.png] view at source ↗
Figure 4.4
Figure 4.4. Figure 4.4: 12 [PITH_FULL_IMAGE:figures/full_fig_p211_4_4.png] view at source ↗
Figure 4.4
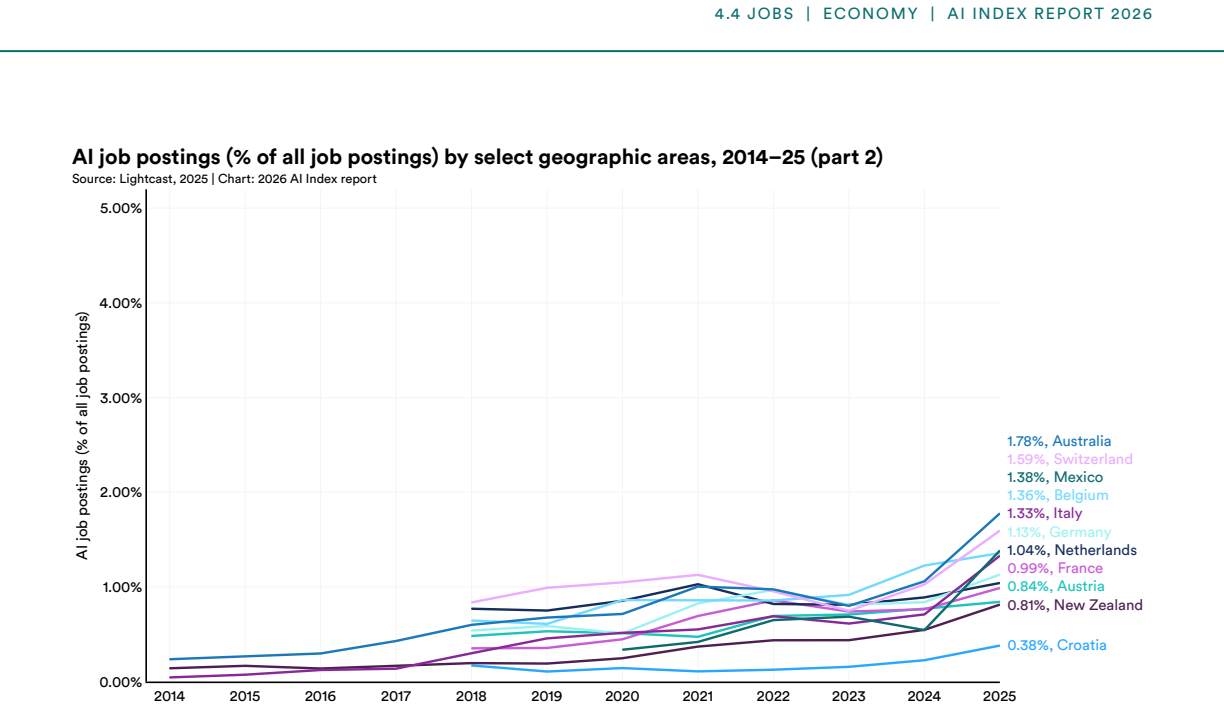
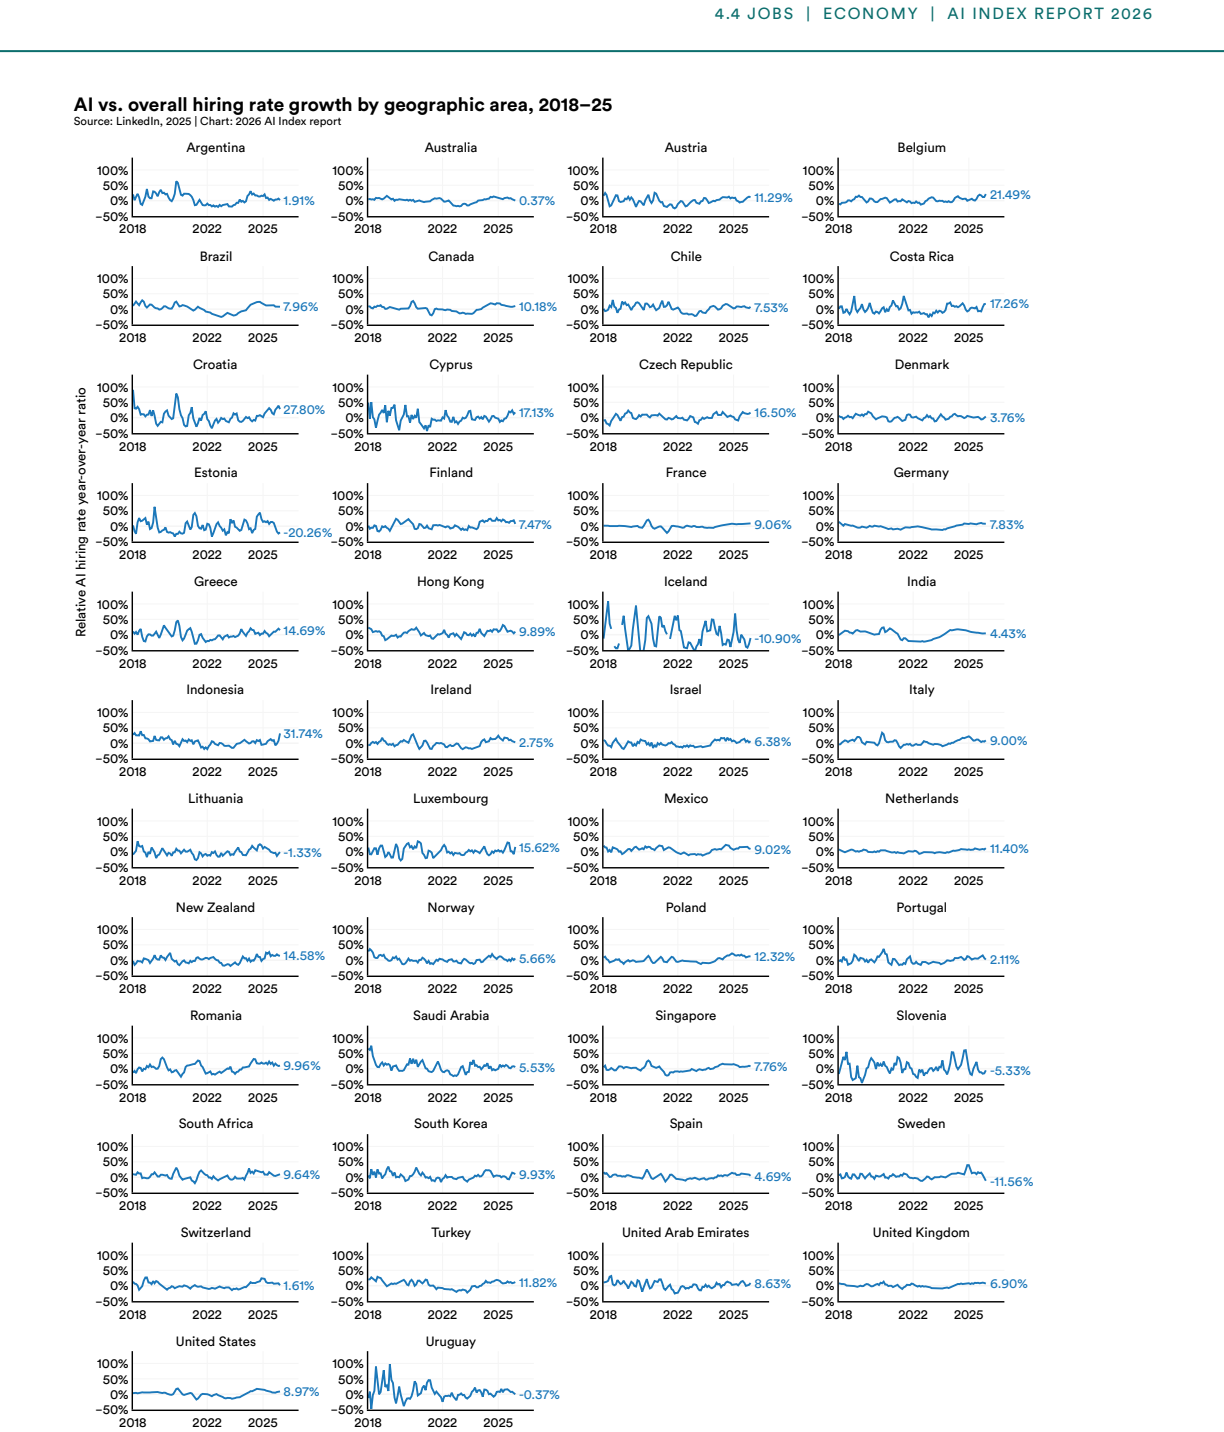
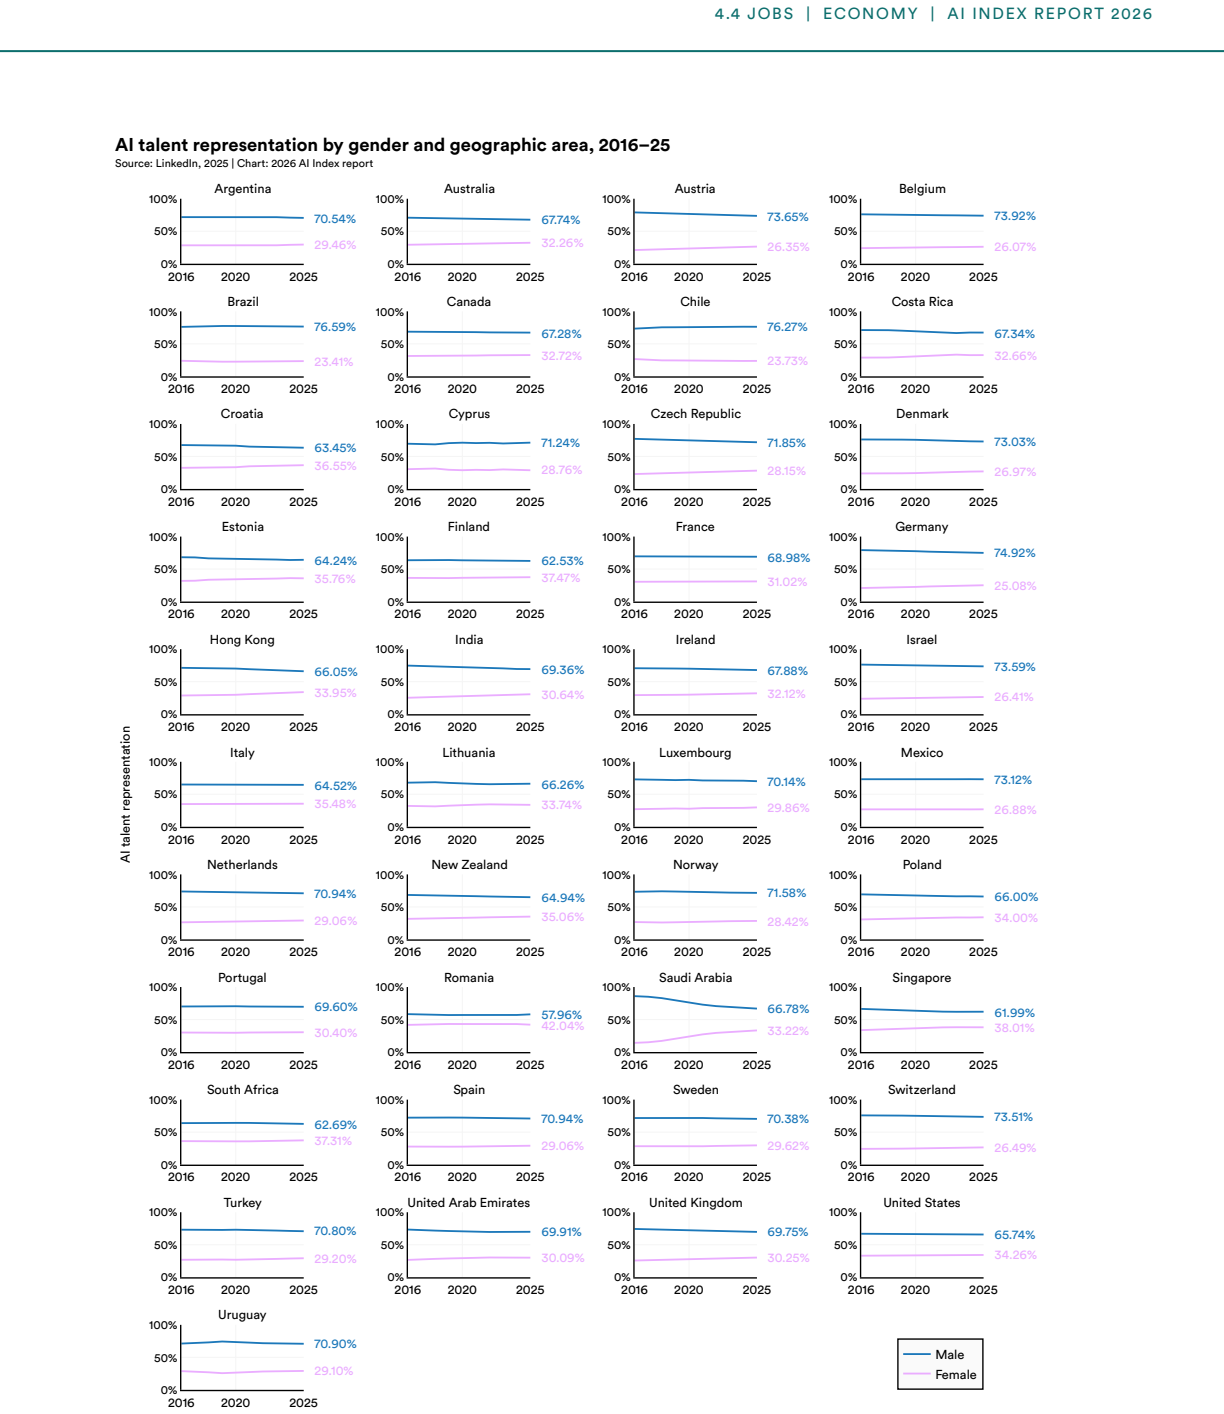
Figure 4.4. Figure 4.4: 14 LinkedIn’s hiring and talent data provides a view of how AI labor demand is changing the actual workforce in practice. In most countries, AI hiring rates outpaced overall hiring growth in 2025 (Figures 4.4.15 and 4.4.16). Indonesia recorded the highest relative AI hiring growth at 31.7%, followed by Croatia (27.8%) and Belgium (21.5%). Since 2018, many countries show a sustained pattern of AI hiring r… view at source ↗
Figure 4.4
Figure 4.4. Figure 4.4: 16 [PITH_FULL_IMAGE:figures/full_fig_p213_4_4.png] view at source ↗
Figure 4.4
Figure 4.4. Figure 4.4: 2113 [PITH_FULL_IMAGE:figures/full_fig_p214_4_4.png] view at source ↗
Figure 4.4
Figure 4.4. Figure 4.4: 2315 15 For the sake of brevity, the visualization includes only the top 15 countries for this metric [PITH_FULL_IMAGE:figures/full_fig_p215_4_4.png] view at source ↗
Figure 4.4
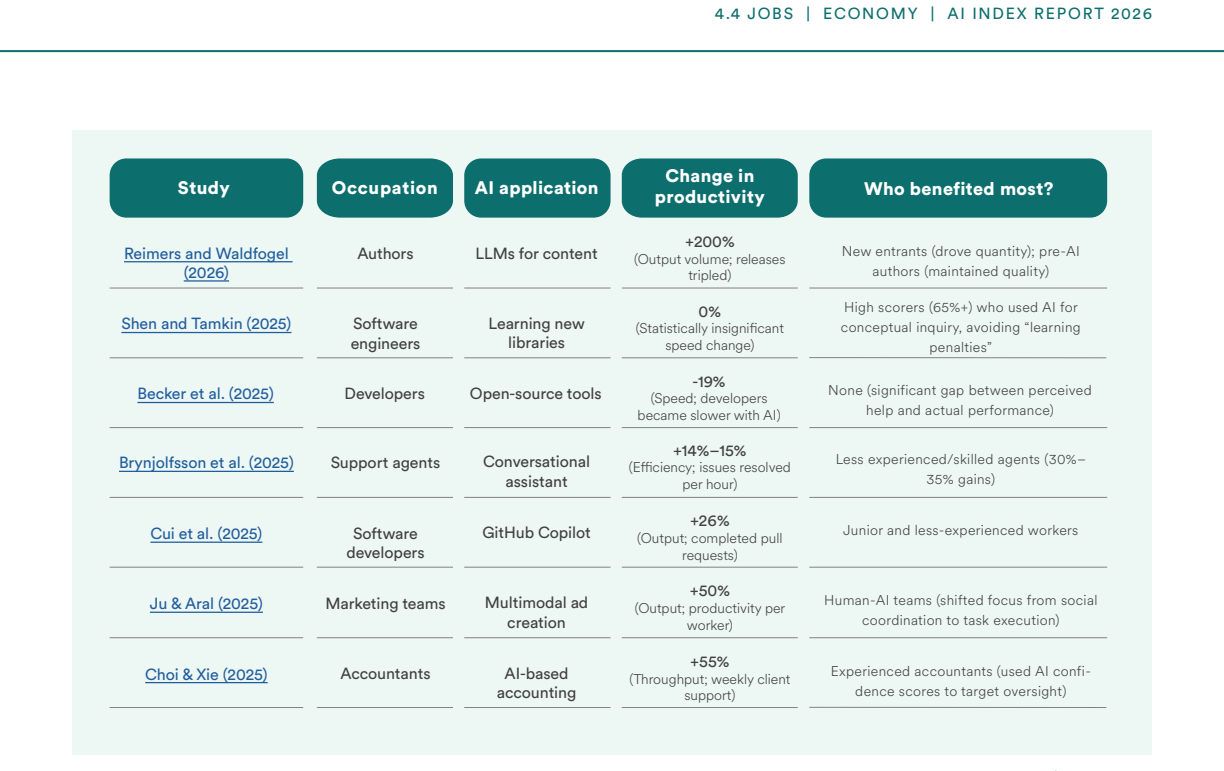
Figure 4.4. Figure 4.4: 2416 16 Asterisks indicate that a country’s y-axis label is scaled differently than the y-axis label for the other countries. 4.4 JOBS | ECONOMY | AI INDEX REPORT 2026 [PITH_FULL_IMAGE:figures/full_fig_p216_4_4.png] view at source ↗
Figure 4.4
Figure 4.4. Figure 4.4: 25 4.4 JOBS | ECONOMY | AI INDEX REPORT 2026 [PITH_FULL_IMAGE:figures/full_fig_p217_4_4.png] view at source ↗
Figure 4.4
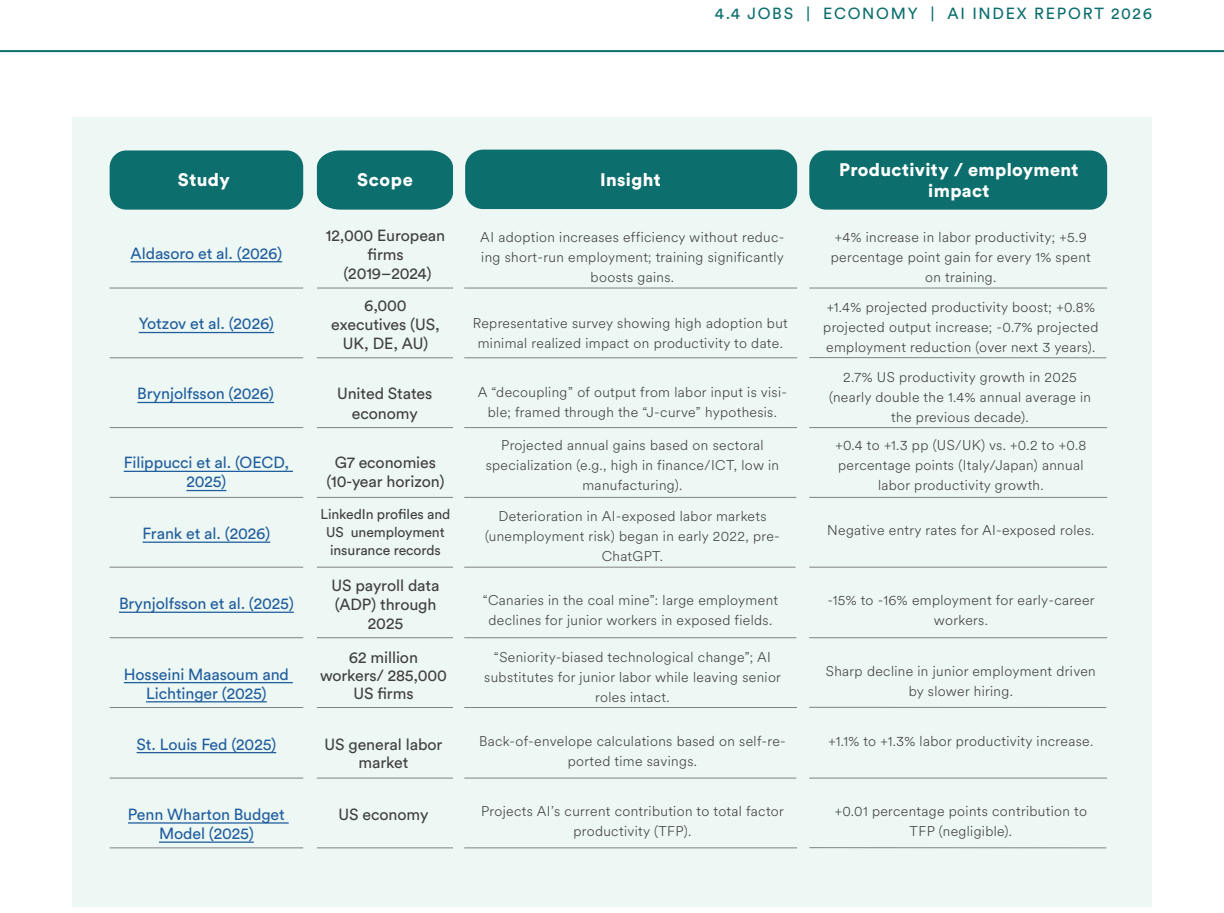
Figure 4.4. Figure 4.4: 26 4.4 JOBS | ECONOMY | AI INDEX REPORT 2026 [PITH_FULL_IMAGE:figures/full_fig_p218_4_4.png] view at source ↗
Figure 4.4
Figure 4.4. Figure 4.4: 27 Macro-level Studies At the macro level, the evidence is earlier and less conclusive, but there are indicators that AI is starting to register in aggregate productivity data ( [PITH_FULL_IMAGE:figures/full_fig_p220_4_4.png] view at source ↗
Figure 4.4
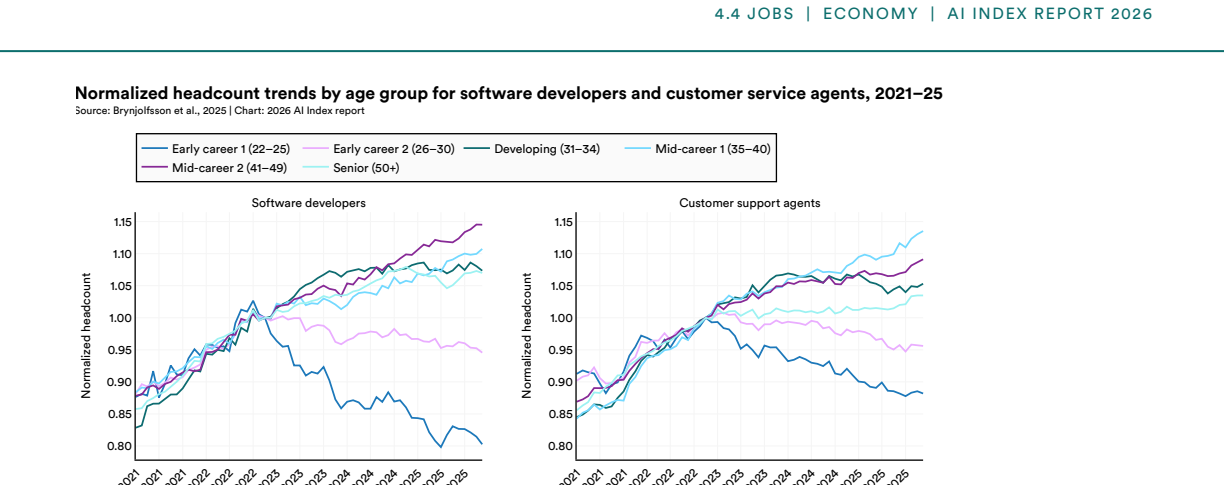
Figure 4.4. Figure 4.4: 28 It is challenging to measure AI’s impact on employment, particularly because the technology is still in the early stages of widespread deployment. So far, effects on the workforce appear to be uneven, initially showing up in hiring pipelines, among younger workers, and within specific business functions. The evidence does not point to broad, uniform displacement. Firm-level survey data does suggest th… view at source ↗
Figure 4.4
Figure 4.4. Figure 4.4: 29 When occupations are grouped by their exposure to AI, the age-based pattern holds ( [PITH_FULL_IMAGE:figures/full_fig_p222_4_4.png] view at source ↗
Figure 4.4
Figure 4.4. Figure 4.4: 31 [PITH_FULL_IMAGE:figures/full_fig_p223_4_4.png] view at source ↗
Figure 4.4
Figure 4.4. Figure 4.4: 32 However, employer expectations seem to indicate that the pace may accelerate ( [PITH_FULL_IMAGE:figures/full_fig_p224_4_4.png] view at source ↗
Figure 4.4
Figure 4.4. Figure 4.4: 33 [PITH_FULL_IMAGE:figures/full_fig_p225_4_4.png] view at source ↗
Figure 4.4
Figure 4.4. Figure 4.4: 35 [PITH_FULL_IMAGE:figures/full_fig_p226_4_4.png] view at source ↗
Figure 4.5
Figure 4.5. Figure 4.5: 1 [PITH_FULL_IMAGE:figures/full_fig_p227_4_5.png] view at source ↗
Figure 4.5
Figure 4.5. Figure 4.5: 2 [PITH_FULL_IMAGE:figures/full_fig_p228_4_5.png] view at source ↗
Figure 4.5
Figure 4.5. Figure 4.5: 4 [PITH_FULL_IMAGE:figures/full_fig_p229_4_5.png] view at source ↗
Figure 4.5
Figure 4.5. Figure 4.5: 6 [PITH_FULL_IMAGE:figures/full_fig_p230_4_5.png] view at source ↗
Figure 5.1
Figure 5.1. Figure 5.1: 12 2 The natural sciences count may be slightly lower than the sum of the individual domain counts. This is because a single publication can be assigned to more than one domain. For example, a biochemistry paper may be categorized under both physical sciences and life sciences. To avoid dou￾ble-counting, these publications are counted only once in the natural sciences total [PITH_FULL_IMAGE:figures/full… view at source ↗
Figure 5.2
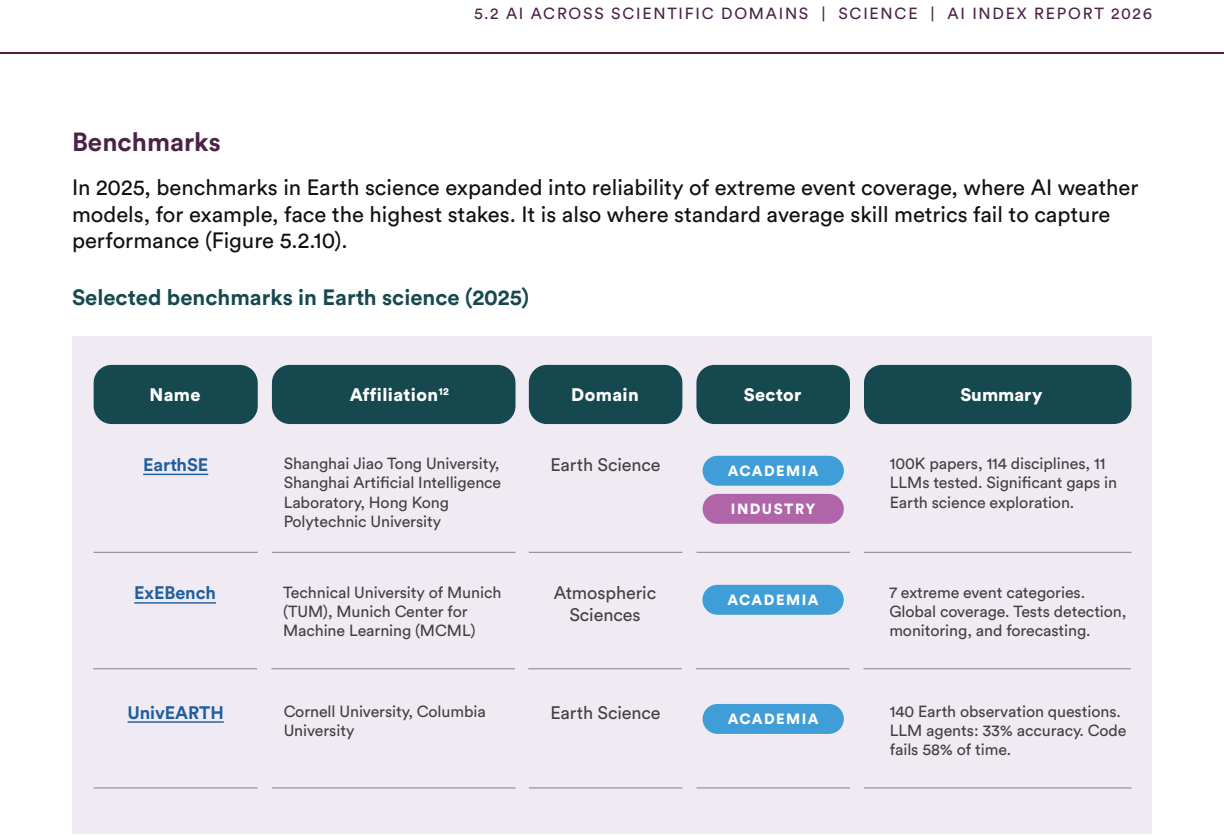
Figure 5.2. Figure 5.2: 1 Benchmarks In these particular domains, benchmarks have been newly introduced and therefore do not offer longitudinal data across multiple years. It is interesting to see how general-purpose frontier models, discussed in Chapter 2, perform on scientific tasks ( [PITH_FULL_IMAGE:figures/full_fig_p237_5_2.png] view at source ↗
Figure 5.2
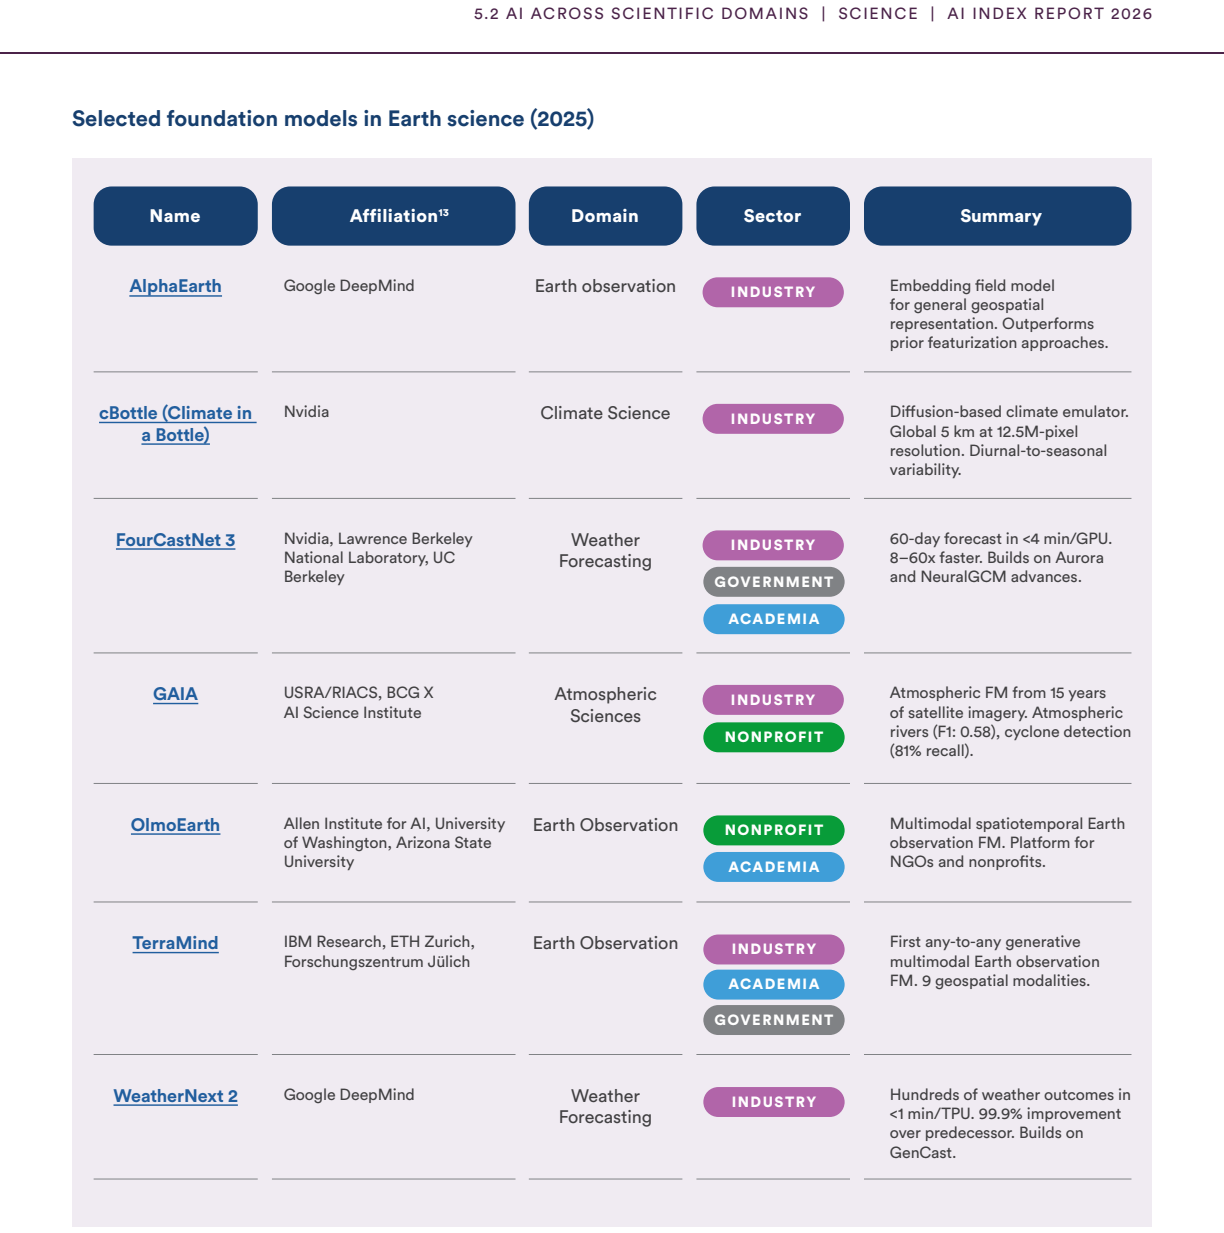
Figure 5.2. Figure 5.2: 2 Affiliation5 Summary 5 Full references are provided in the Appendix. Name Domain Sector Selected foundation models in physics, astronomy, chemistry, and materials science (2025) AION-1 UC Berkeley, Flatiron Institute, New York University Astronomy FM: 300M–3.1B parameters, 200M-plus celestial objects from 5 major surveys. Open release. Astronomy ACADEMIA ChemDFM Shanghai Jiao Tong University, Suzhou La… view at source ↗
Figure 5.2
Figure 5.2. Figure 5.2: 3 [PITH_FULL_IMAGE:figures/full_fig_p240_5_2.png] view at source ↗
Figure 5.2
Figure 5.2. Figure 5.2: 4 [PITH_FULL_IMAGE:figures/full_fig_p241_5_2.png] view at source ↗
Figure 5.2
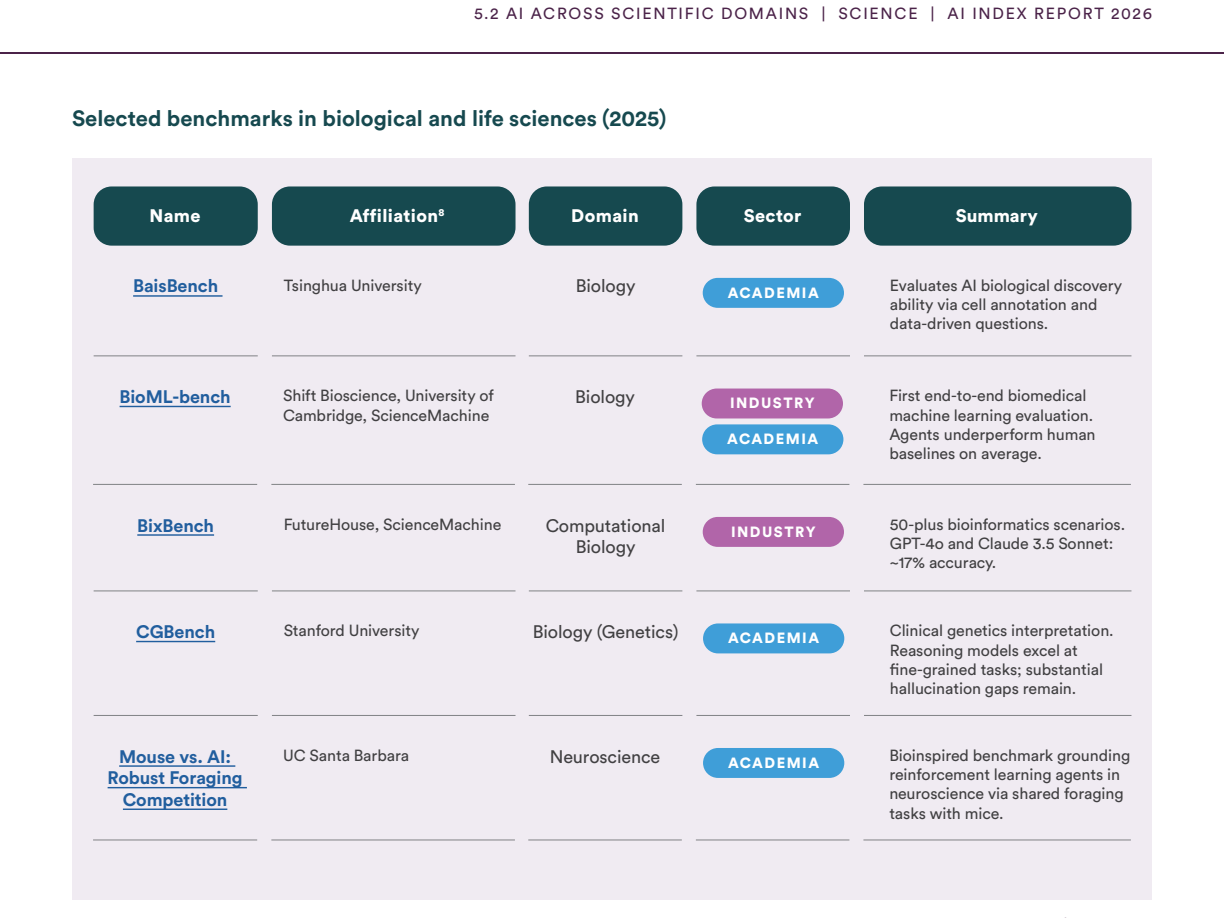
Figure 5.2. Figure 5.2: 5 Benchmarks Life-science benchmarks have moved to testing workflow execution and tool-integrated analysis, rather than static knowledge. BixBench reports that frontier models achieve roughly 17% accuracy on real￾world bioinformatics analysis tasks, highlighting challenges in chaining tools, file handling and domain interpretation. BioML-bench provides the first end-to-end evaluation of AI agents on biom… view at source ↗
Figure 5.2
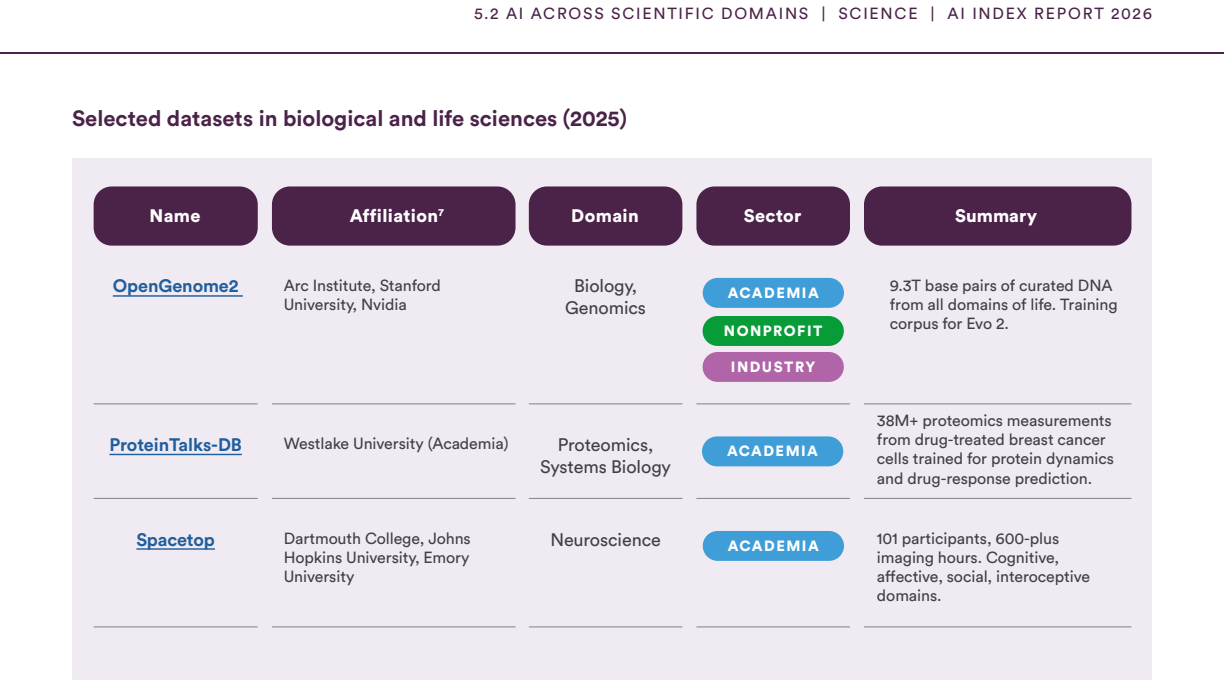
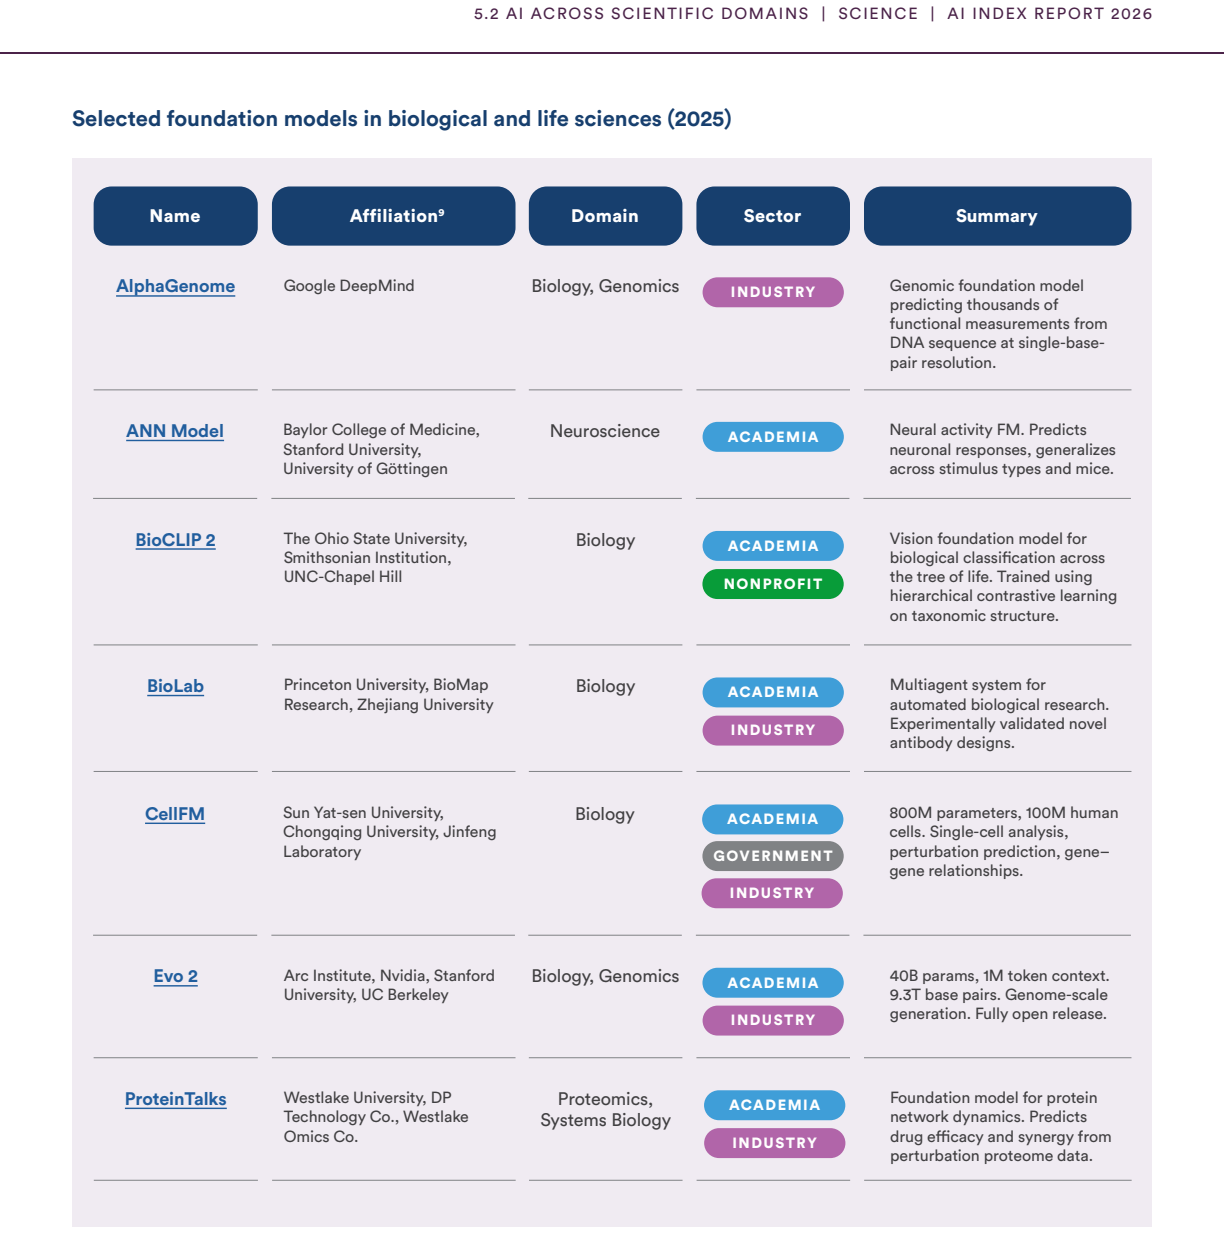
Figure 5.2. Figure 5.2: 6 INDUSTRY INDUSTRY Foundation Models In 2025, foundation model releases in the biological and life sciences domains expanded across genomics and cellular modeling. Genomic foundation model Evo 2, which trained on OpenGenome2, trained on 9.3 trillion DNA base pairs from all domains of life. It operates at up to 40 billion parameters with a 1 million token context window and was released with fully open w… view at source ↗
Figure 5.2
Figure 5.2. Figure 5.2: 7 [PITH_FULL_IMAGE:figures/full_fig_p245_5_2.png] view at source ↗
Figure 5.2
Figure 5.2. Figure 5.2: 8 [PITH_FULL_IMAGE:figures/full_fig_p246_5_2.png] view at source ↗
Figure 5.2
Figure 5.2. Figure 5.2: 9 [PITH_FULL_IMAGE:figures/full_fig_p247_5_2.png] view at source ↗
Figure 5.2
Figure 5.2. Figure 5.2: 10 [PITH_FULL_IMAGE:figures/full_fig_p248_5_2.png] view at source ↗
Figure 5.2
Figure 5.2. Figure 5.2: 11 [PITH_FULL_IMAGE:figures/full_fig_p249_5_2.png] view at source ↗
Figure 5.2
Figure 5.2. Figure 5.2: 12 Mathematics Mathematical reasoning is another active testing ground for AI capabilities. Systems such as Goedel-Prover are moving toward automated formal proof generation in languages like Lean. Competition-level problem￾solving and formal verification of known results are advancing quickly, but major open problems, such as long-standing Erdos conjectures, remain well beyond current capabilities. Chap… view at source ↗
Figure 5.3
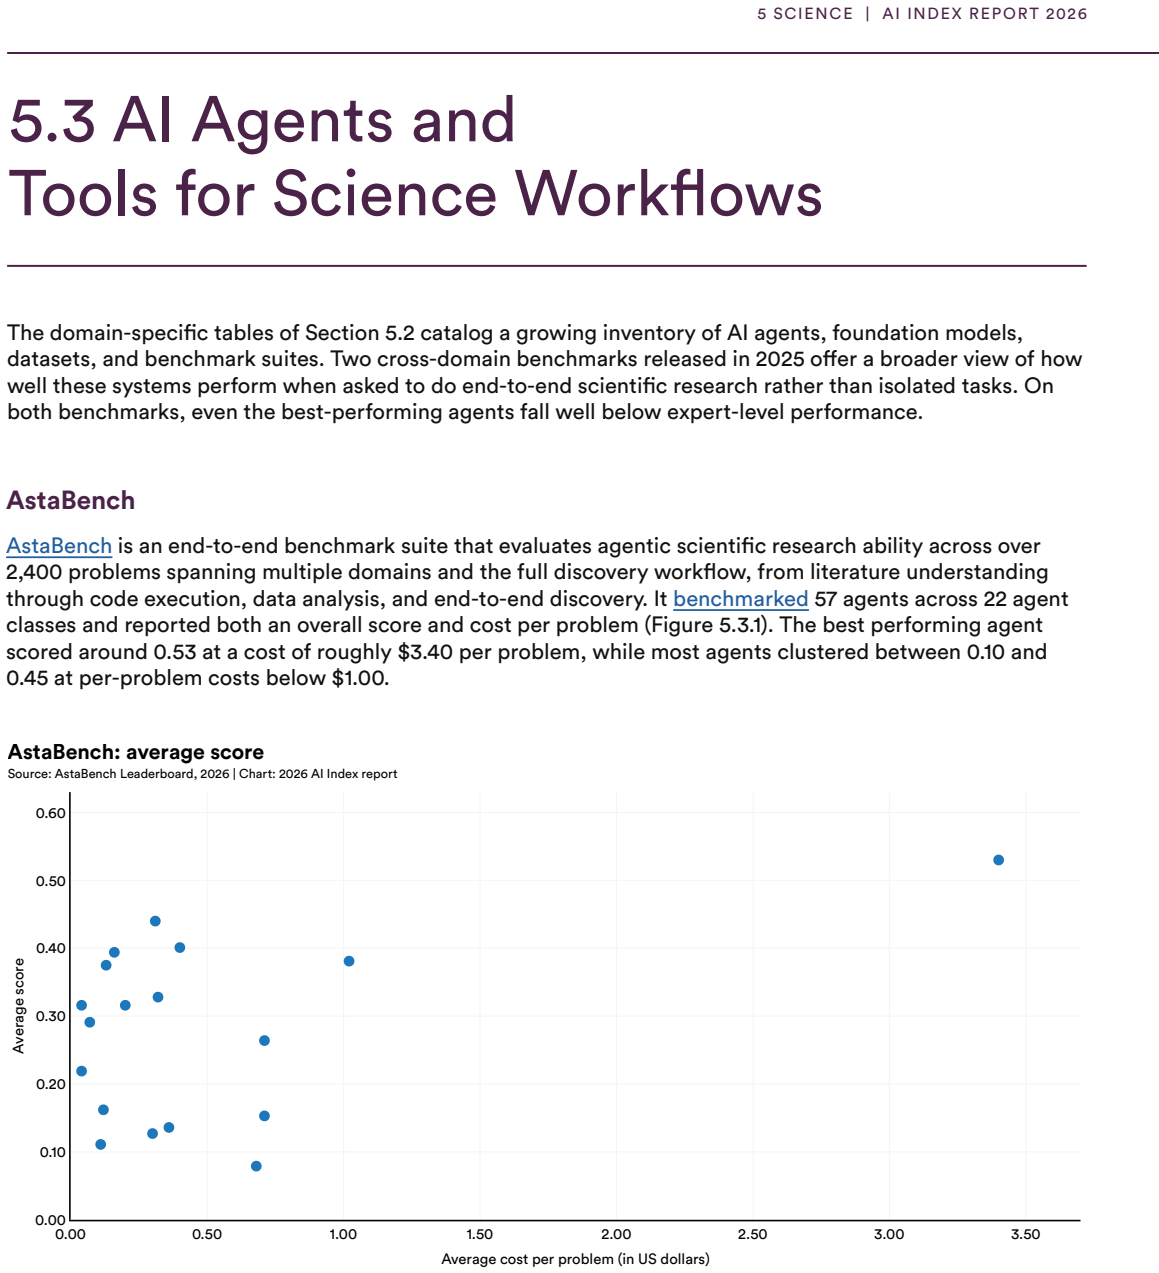
Figure 5.3. Figure 5.3: 1 [PITH_FULL_IMAGE:figures/full_fig_p251_5_3.png] view at source ↗
Figure 5.3
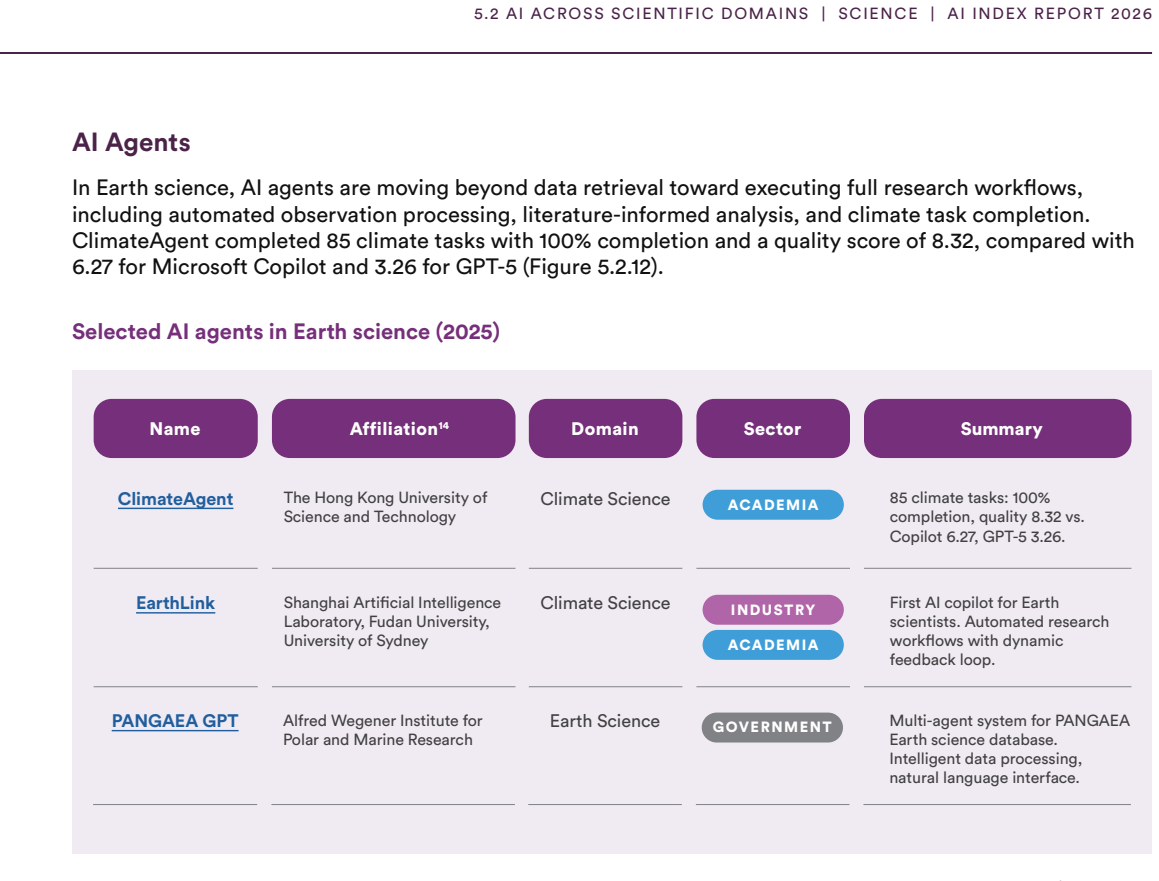
Figure 5.3. Figure 5.3: 2 AI Agents [PITH_FULL_IMAGE:figures/full_fig_p252_5_3.png] view at source ↗
Figure 5.3
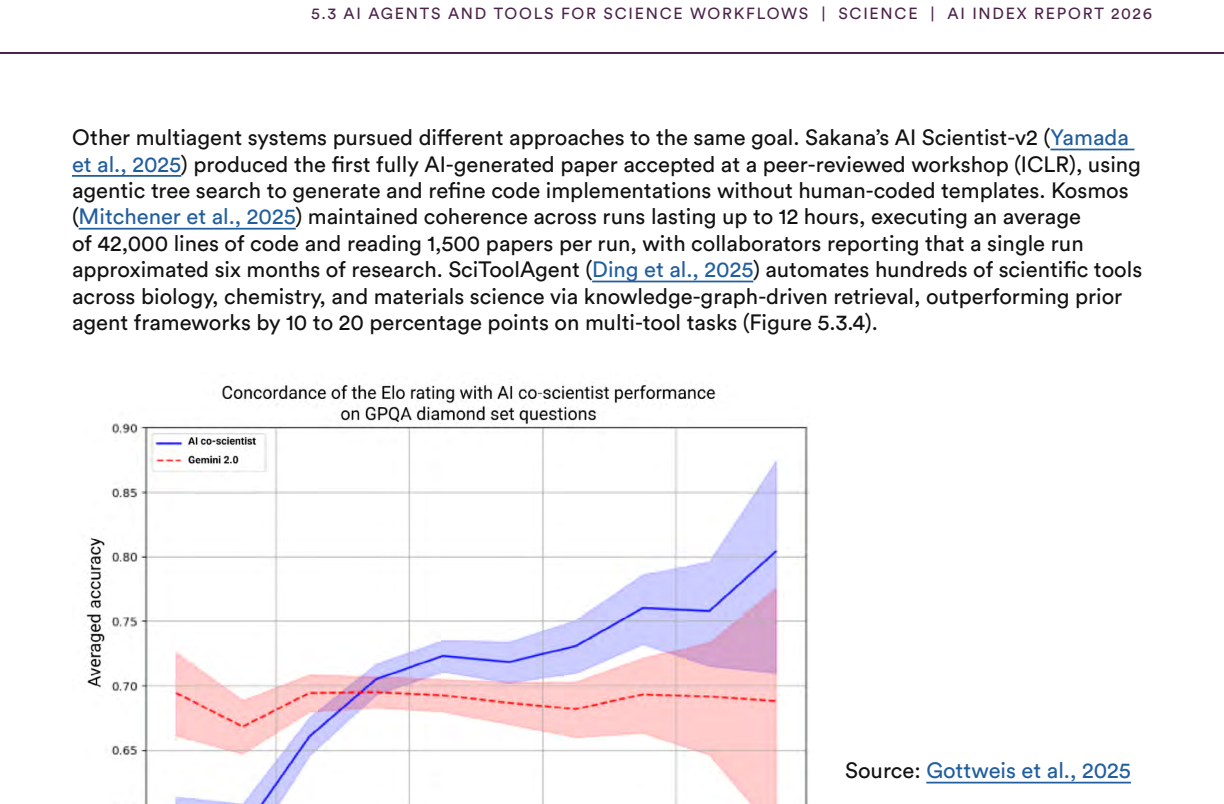
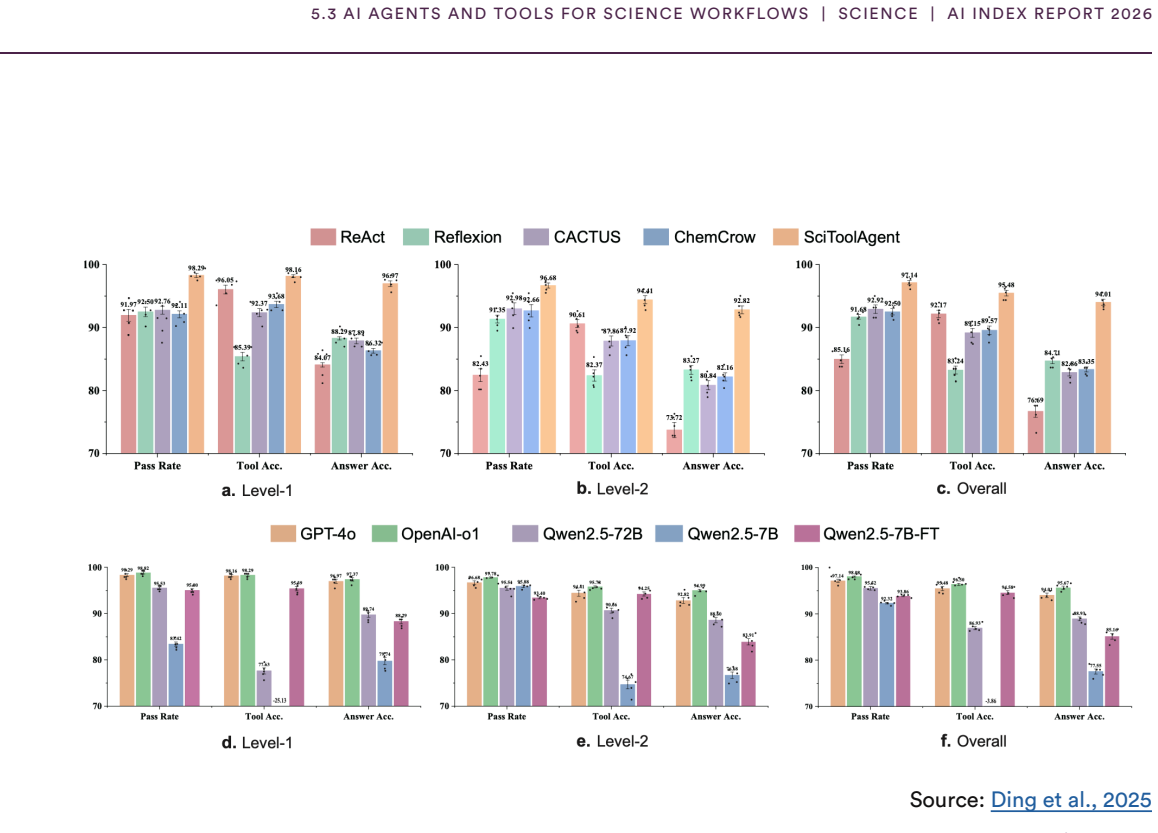
Figure 5.3. Figure 5.3: 2 5.3 AI AGENTS AND TOOLS FOR SCIENCE WORKFLOWS | SCIENCE | AI INDEX REPORT 2026 [PITH_FULL_IMAGE:figures/full_fig_p253_5_3.png] view at source ↗
Figure 5.3
Figure 5.3. Figure 5.3: 2 [PITH_FULL_IMAGE:figures/full_fig_p254_5_3.png] view at source ↗
Figure 6.1
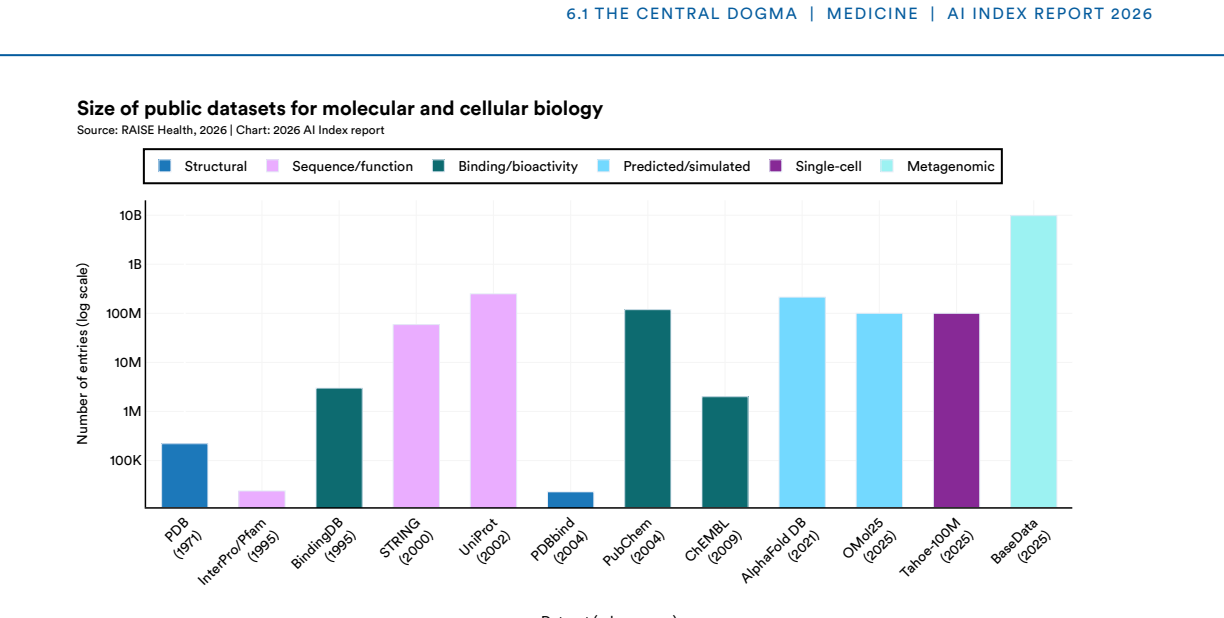
Figure 6.1. Figure 6.1: 1 [PITH_FULL_IMAGE:figures/full_fig_p258_6_1.png] view at source ↗
Figure 6.1
Figure 6.1. Figure 6.1: 2 Demand for training data has continued to grow as AI models have gained further adoption in biology. Rapidly collecting new biological data is typically time-consuming and expensive. In 2025, biological AI models increasingly trained on multiple datasets with different types of experimental measurements. Several cofolding methods (where two or more molecules are modeled simultaneously), for example, be… view at source ↗
Figure 6.1
Figure 6.1. Figure 6.1: 3 [PITH_FULL_IMAGE:figures/full_fig_p260_6_1.png] view at source ↗
Figure 6.1
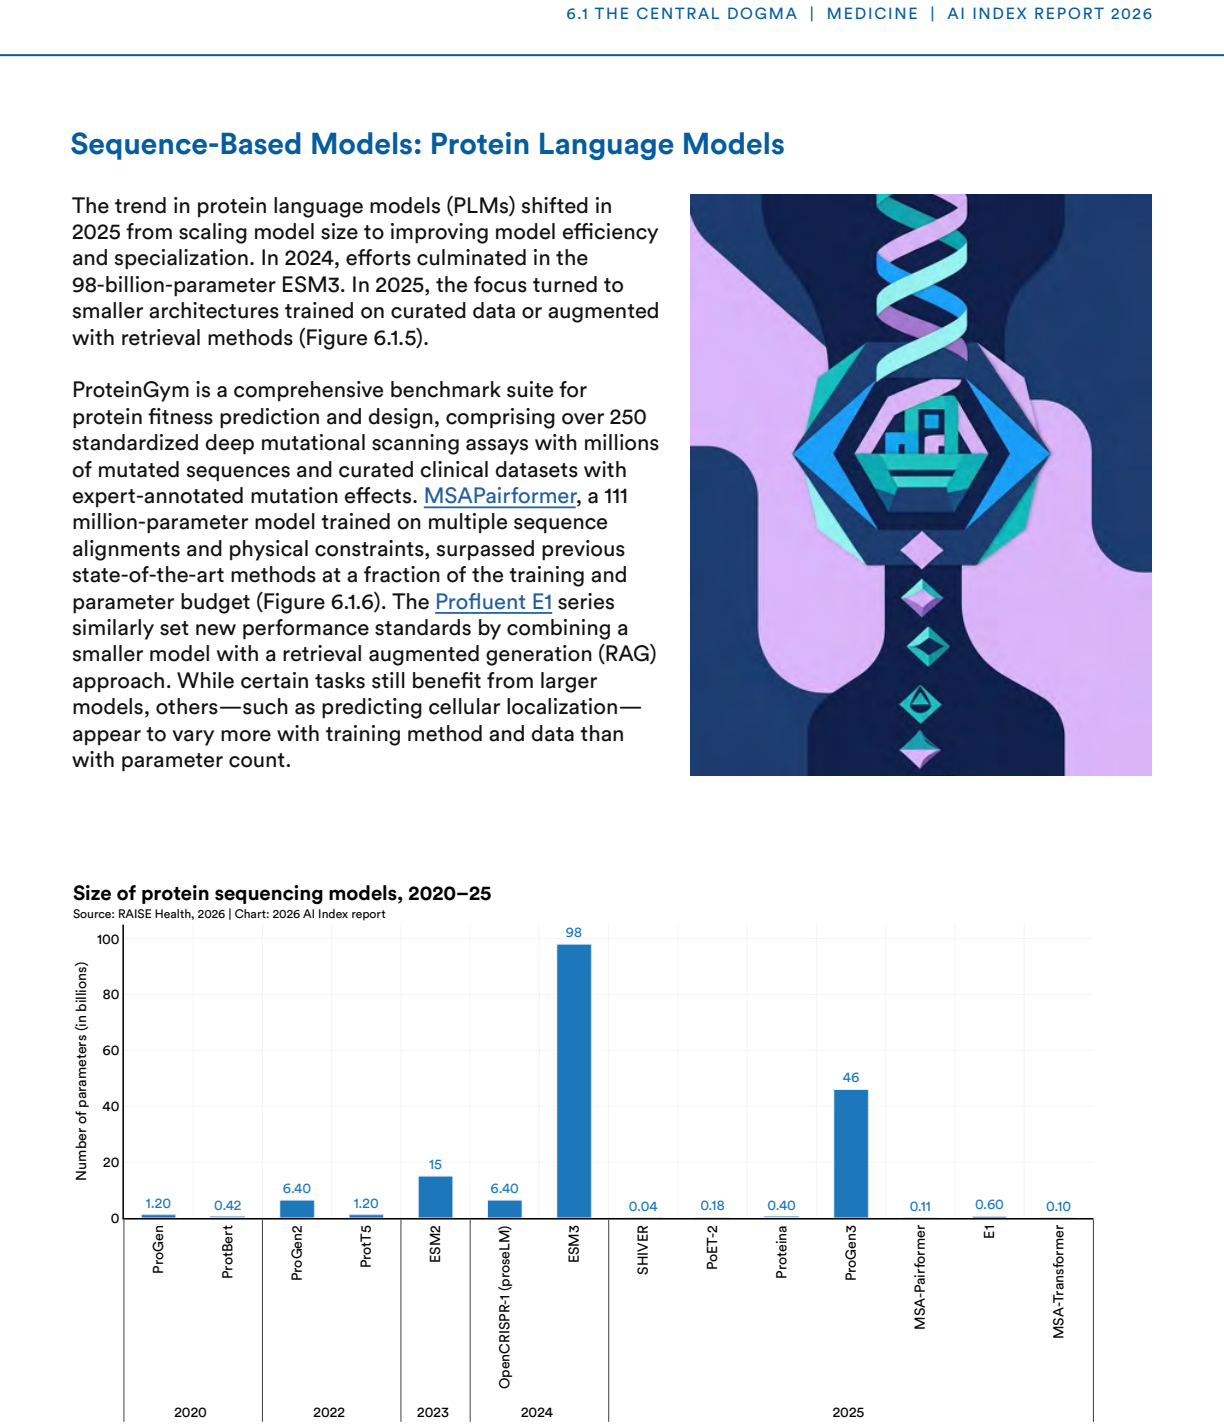
Figure 6.1. Figure 6.1: 5 [PITH_FULL_IMAGE:figures/full_fig_p261_6_1.png] view at source ↗
Figure 6.1
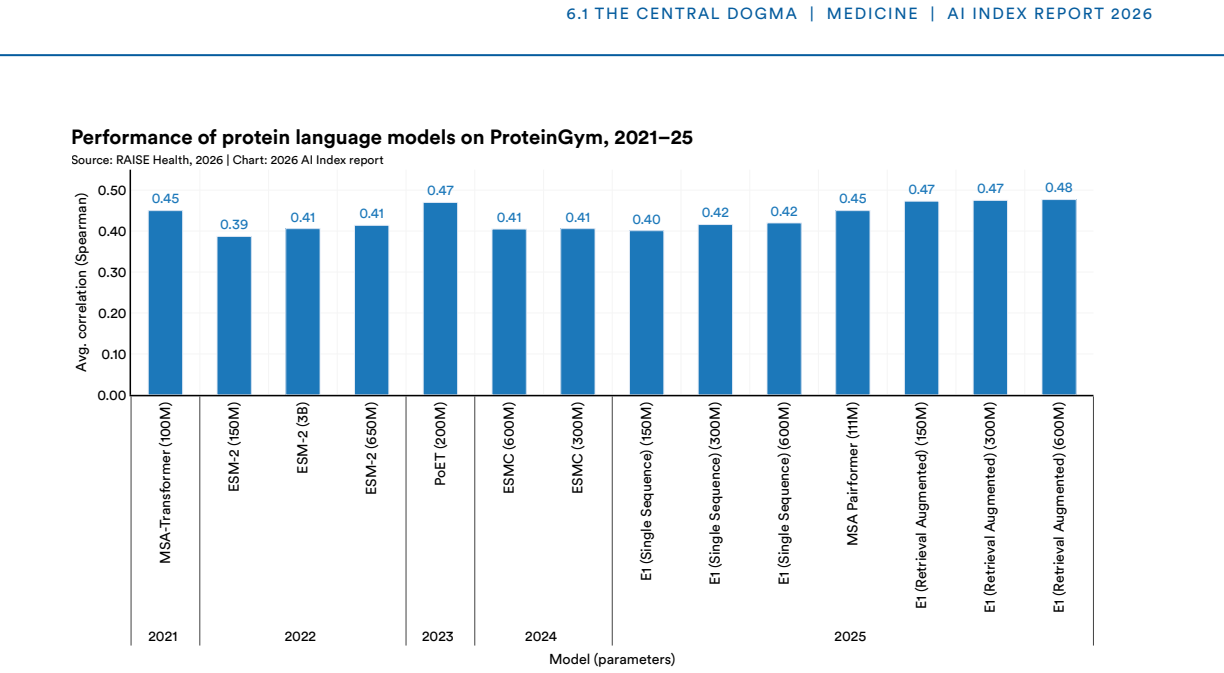
Figure 6.1. Figure 6.1: 6 Beyond benchmark performance, PLMs have also become more task-specific. The ESM-C series demonstrated that smaller models geared toward a single task, such as representation learning, could be successful without the full feature set of the ESM3 family. A fine-tuned ProGen model (6 billion parameters) was used to design a novel CRISPR-Cas protein, OpenCRISPR-1, which demonstrated improved specificity re… view at source ↗
Figure 6.1
Figure 6.1. Figure 6.1: 61 1 Rows represent individual cofolding models. Columns indicate whether each model incorporated a given data type during training, including ex￾perimentally determined and distilled protein structures, molecular dynamics simulations, binding affinity measurements, and RNA structural data. A check mark indicates that the data type was used. Similar to trends in other areas of AI, bigger models have not … view at source ↗
Figure 6.1
Figure 6.1. Figure 6.1: 8 [PITH_FULL_IMAGE:figures/full_fig_p264_6_1.png] view at source ↗
Figure 6.1
Figure 6.1. Figure 6.1: 10 [PITH_FULL_IMAGE:figures/full_fig_p265_6_1.png] view at source ↗
Figure 6.1
Figure 6.1. Figure 6.1: 11 [PITH_FULL_IMAGE:figures/full_fig_p266_6_1.png] view at source ↗
Figure 6.1
Figure 6.1. Figure 6.1: 13 [PITH_FULL_IMAGE:figures/full_fig_p267_6_1.png] view at source ↗
Figure 6.2
Figure 6.2. Figure 6.2: 1 [PITH_FULL_IMAGE:figures/full_fig_p269_6_2.png] view at source ↗
Figure 6.2
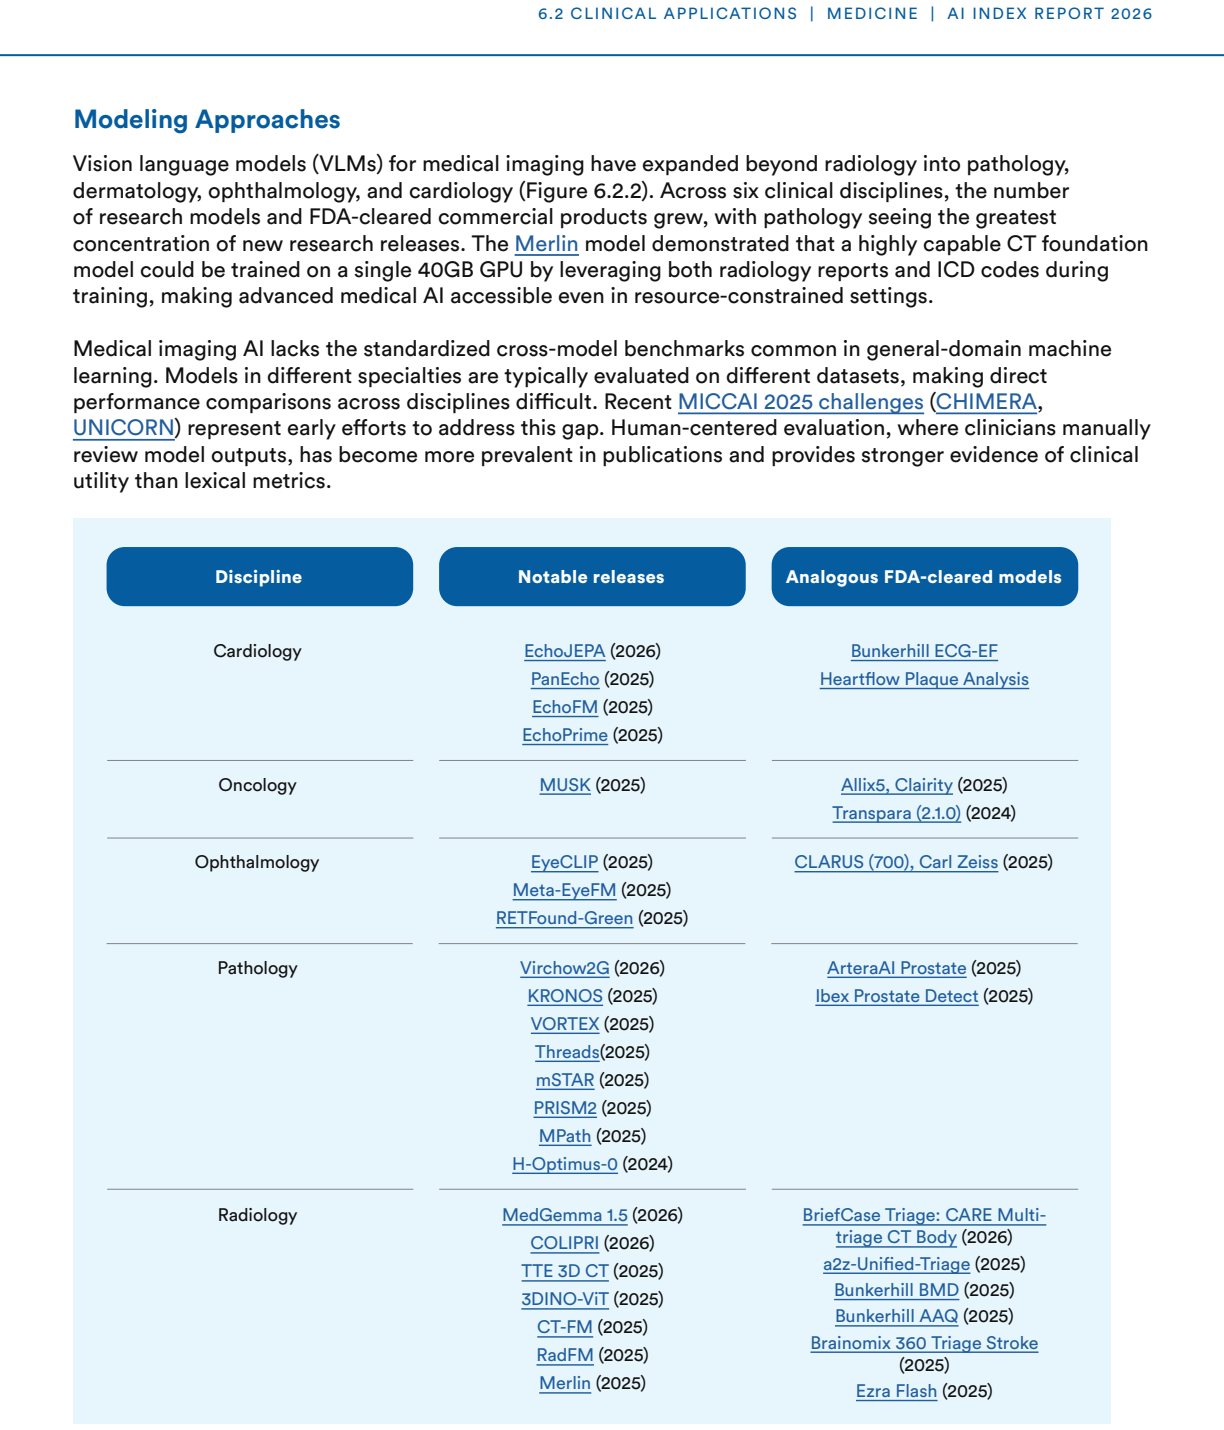
Figure 6.2. Figure 6.2: 2 [PITH_FULL_IMAGE:figures/full_fig_p270_6_2.png] view at source ↗
Figure 6.2
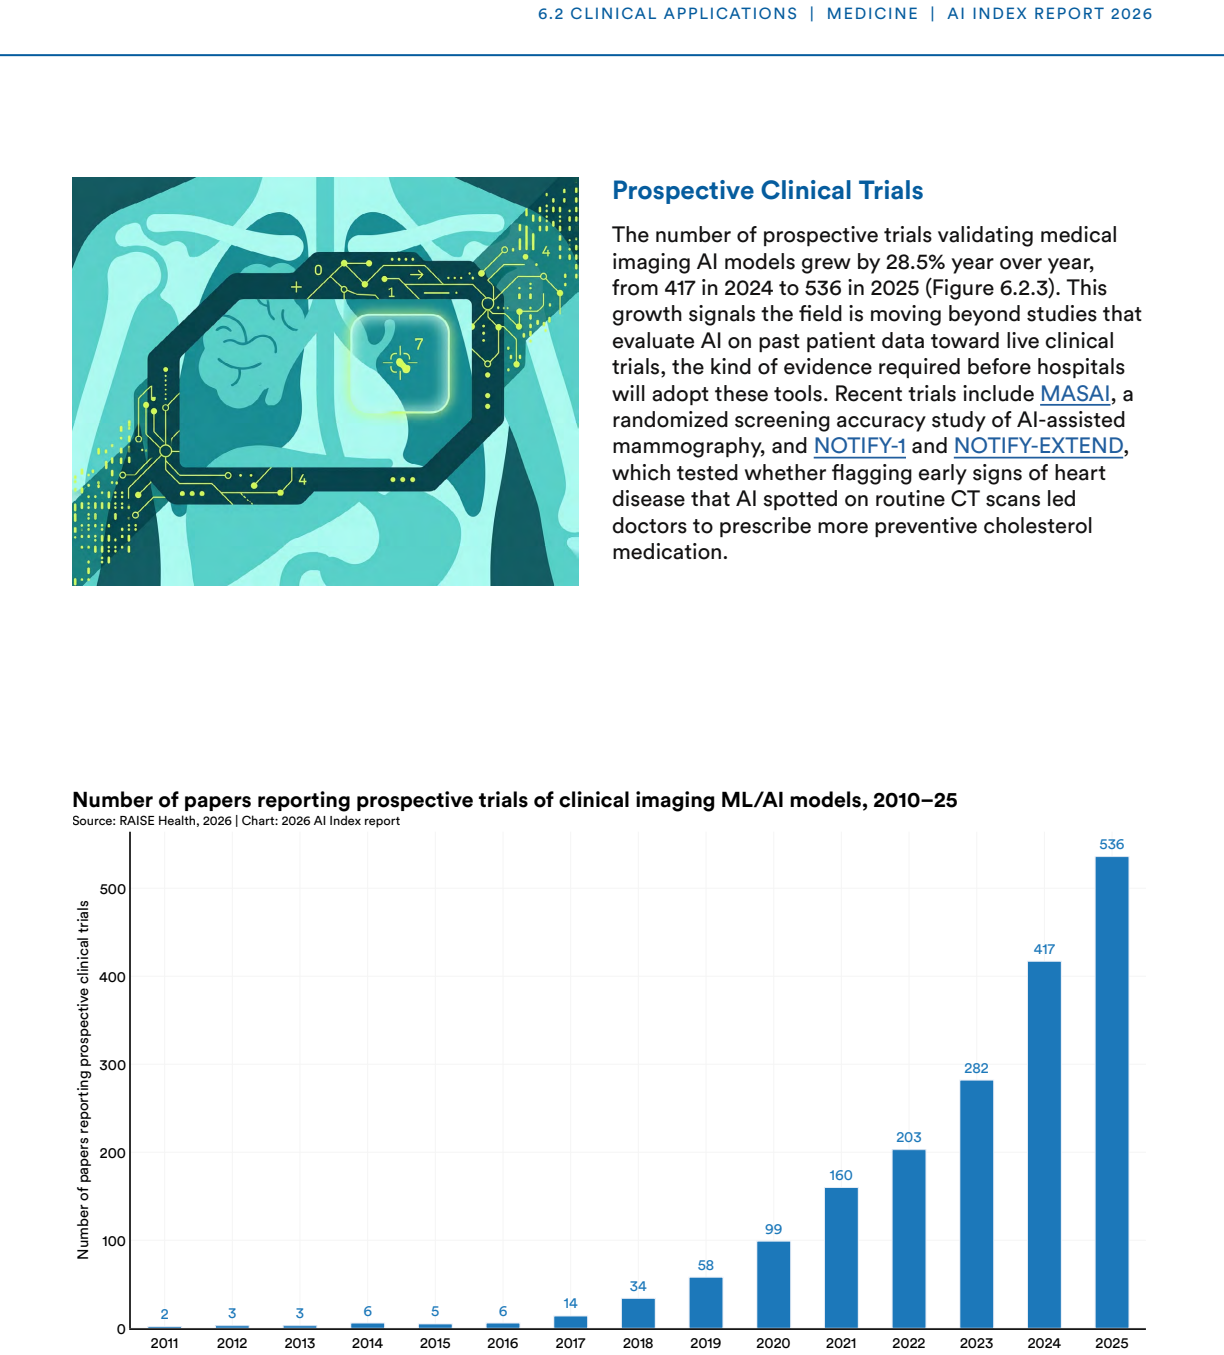
Figure 6.2. Figure 6.2: 3 [PITH_FULL_IMAGE:figures/full_fig_p271_6_2.png] view at source ↗
Figure 6.2
Figure 6.2. Figure 6.2: 42 2 Box plot of normalized management reasoning points by LLMs and physicians on Gray Matters management cases. Five cases were included. Three o1-preview responses were generated for each case. The prior study collected five GPT-4 responses to each case, 176 responses from physicians with access to GPT-4, and 199 responses from physicians with access to conventional resources. HIGHLIGHT: HIGHLIGHT: LLM… view at source ↗
Figure 6.2
Figure 6.2. Figure 6.2: 5 [PITH_FULL_IMAGE:figures/full_fig_p274_6_2.png] view at source ↗
Figure 6.2
Figure 6.2. Figure 6.2: 7 [PITH_FULL_IMAGE:figures/full_fig_p275_6_2.png] view at source ↗
Figure 6.2
Figure 6.2. Figure 6.2: 9 Clinical AI moved from pilot-stage initiatives to enterprise-scale deployments in 2025, with health systems reporting measurable outcomes across clinical and operational domains. The most published evidence was from ambient AI documentation, AI-powered sepsis prediction, and generative AI integration into clinical workflows. Enterprise-Scale Deployments in 2025 [PITH_FULL_IMAGE:figures/full_fig_p276_6… view at source ↗
Figure 6.2
Figure 6.2. Figure 6.2: 113 3 The bar in 2025 appears lower than in 2024 because not all patents filed in 2025 have been published or become publicly available yet [PITH_FULL_IMAGE:figures/full_fig_p279_6_2.png] view at source ↗
Figure 6.3
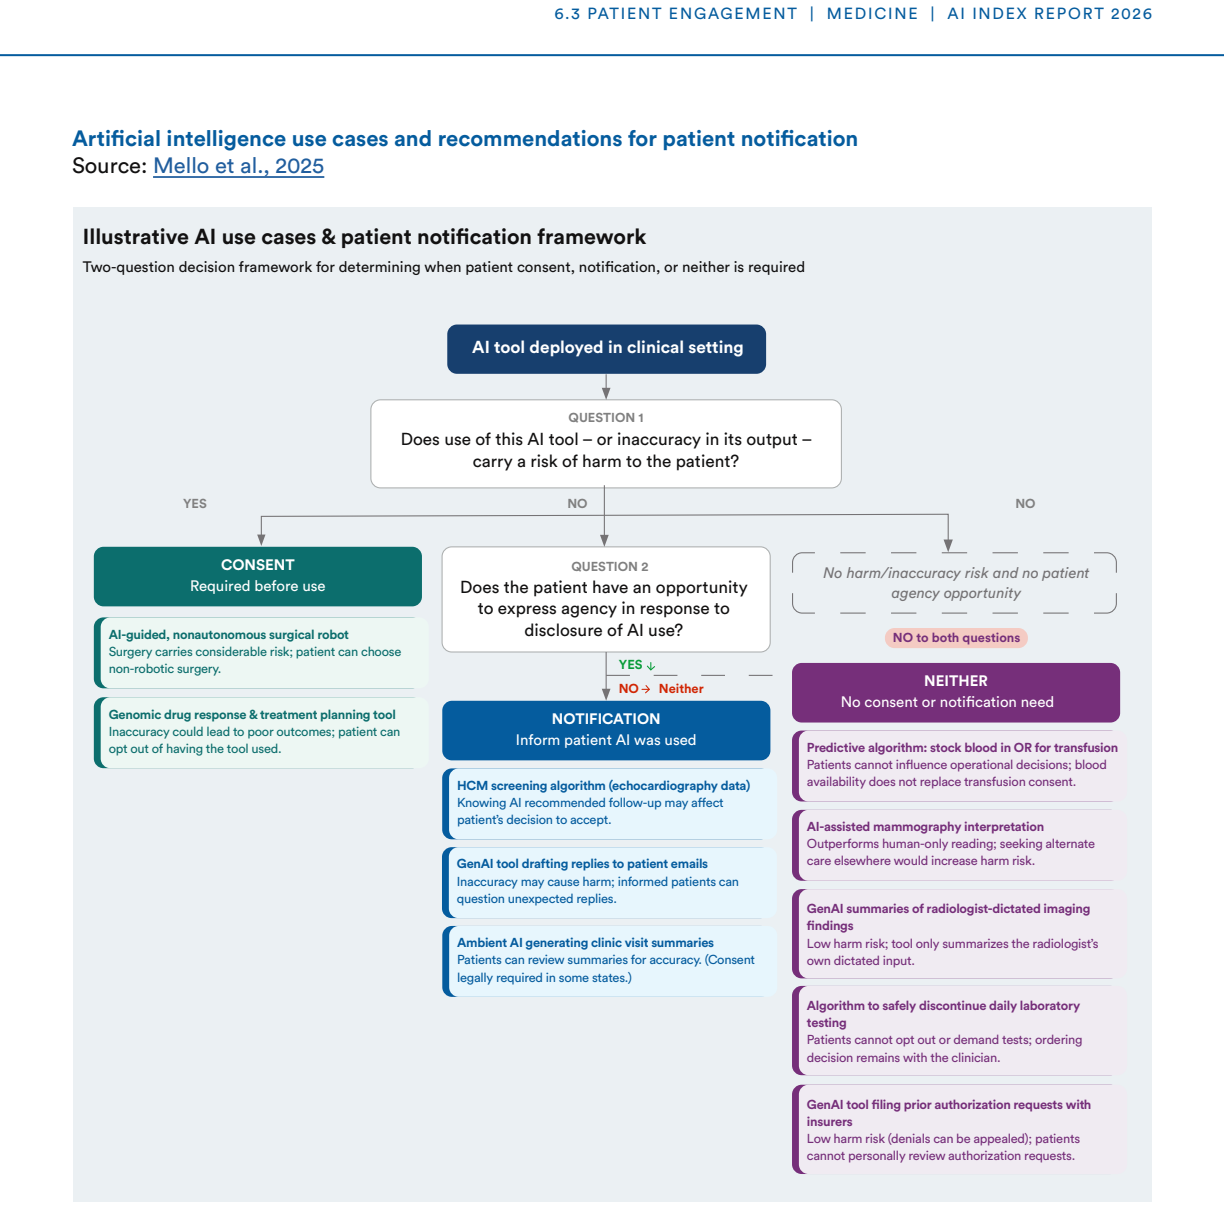
Figure 6.3. Figure 6.3: 1 [PITH_FULL_IMAGE:figures/full_fig_p280_6_3.png] view at source ↗
Figure 6.3
Figure 6.3. Figure 6.3: 2 [PITH_FULL_IMAGE:figures/full_fig_p281_6_3.png] view at source ↗
Figure 6.3
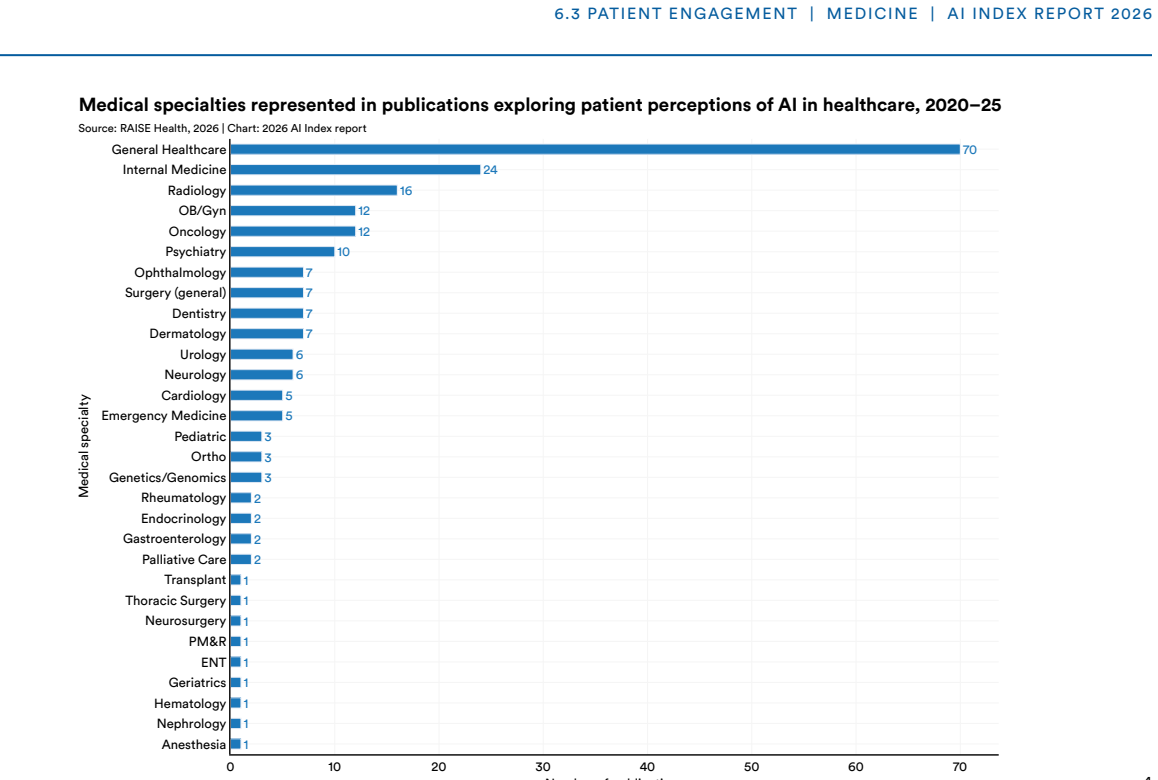
Figure 6.3. Figure 6.3: 3 Internal medicine, radiology, and oncology were the most frequently represented specialties in this literature ( [PITH_FULL_IMAGE:figures/full_fig_p282_6_3.png] view at source ↗
Figure 6.3
Figure 6.3. Figure 6.3: 4 4 [PITH_FULL_IMAGE:figures/full_fig_p283_6_3.png] view at source ↗
Figure 6.4
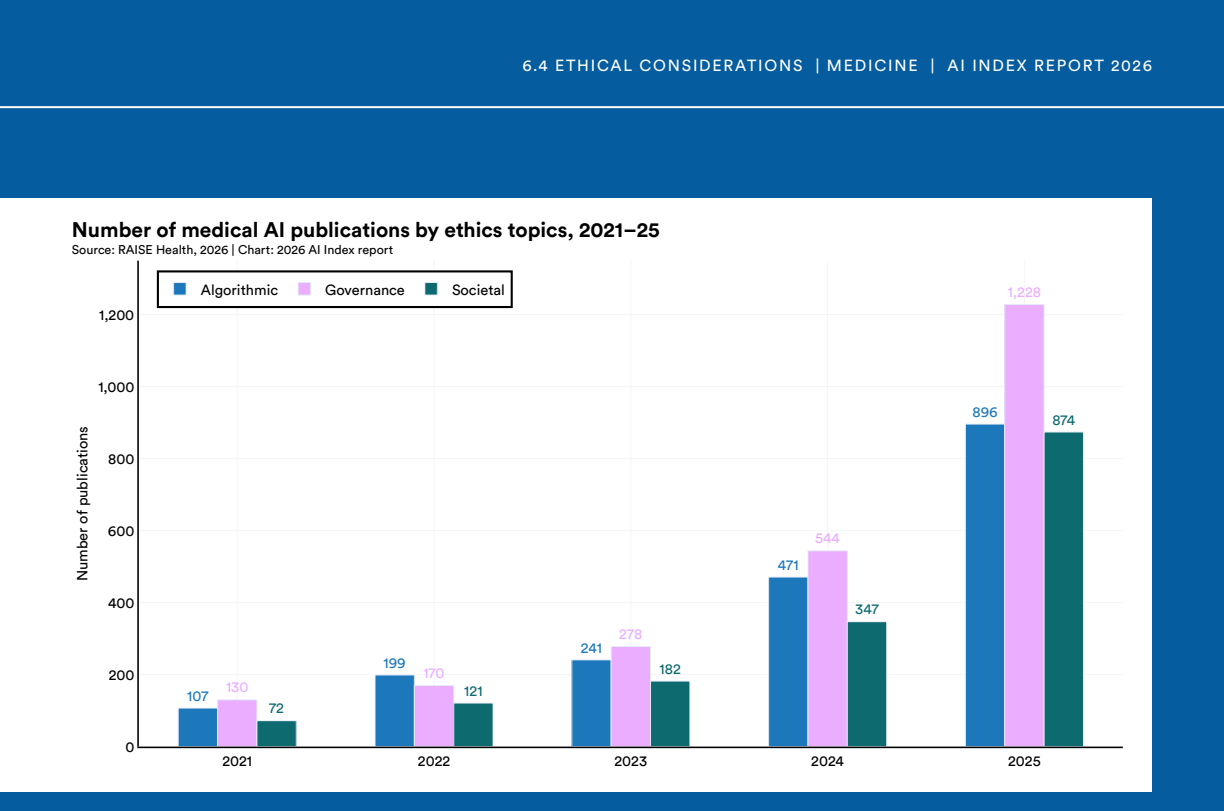
Figure 6.4. Figure 6.4: 1 [PITH_FULL_IMAGE:figures/full_fig_p284_6_4.png] view at source ↗
Figure 6.4
Figure 6.4. Figure 6.4: 2 [PITH_FULL_IMAGE:figures/full_fig_p285_6_4.png] view at source ↗
Figure 6.4
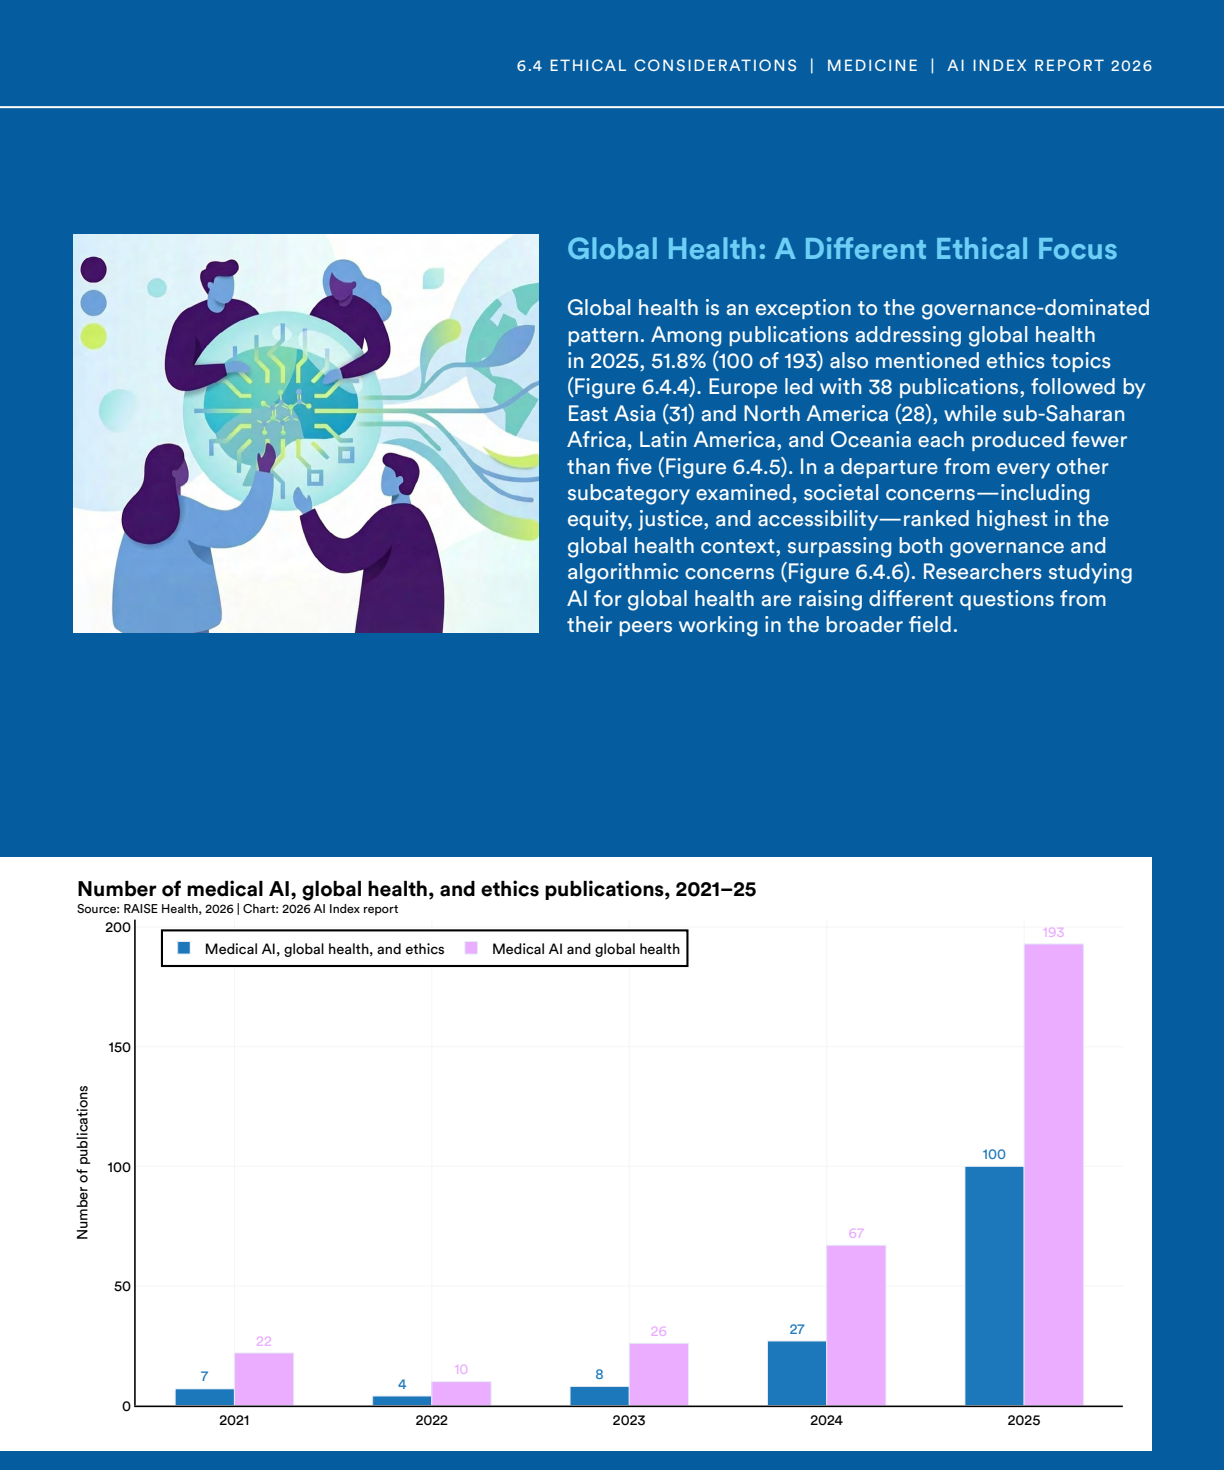
Figure 6.4. Figure 6.4: 4 [PITH_FULL_IMAGE:figures/full_fig_p286_6_4.png] view at source ↗
Figure 6.4
Figure 6.4. Figure 6.4: 5 [PITH_FULL_IMAGE:figures/full_fig_p287_6_4.png] view at source ↗
Figure 7.1
Figure 7.1. Figure 7.1: 1 [PITH_FULL_IMAGE:figures/full_fig_p291_7_1.png] view at source ↗
Figure 7.2
Figure 7.2. Figure 7.2: 1 [PITH_FULL_IMAGE:figures/full_fig_p293_7_2.png] view at source ↗
Figure 7.2
Figure 7.2. Figure 7.2: 3 [PITH_FULL_IMAGE:figures/full_fig_p294_7_2.png] view at source ↗
Figure 7.2
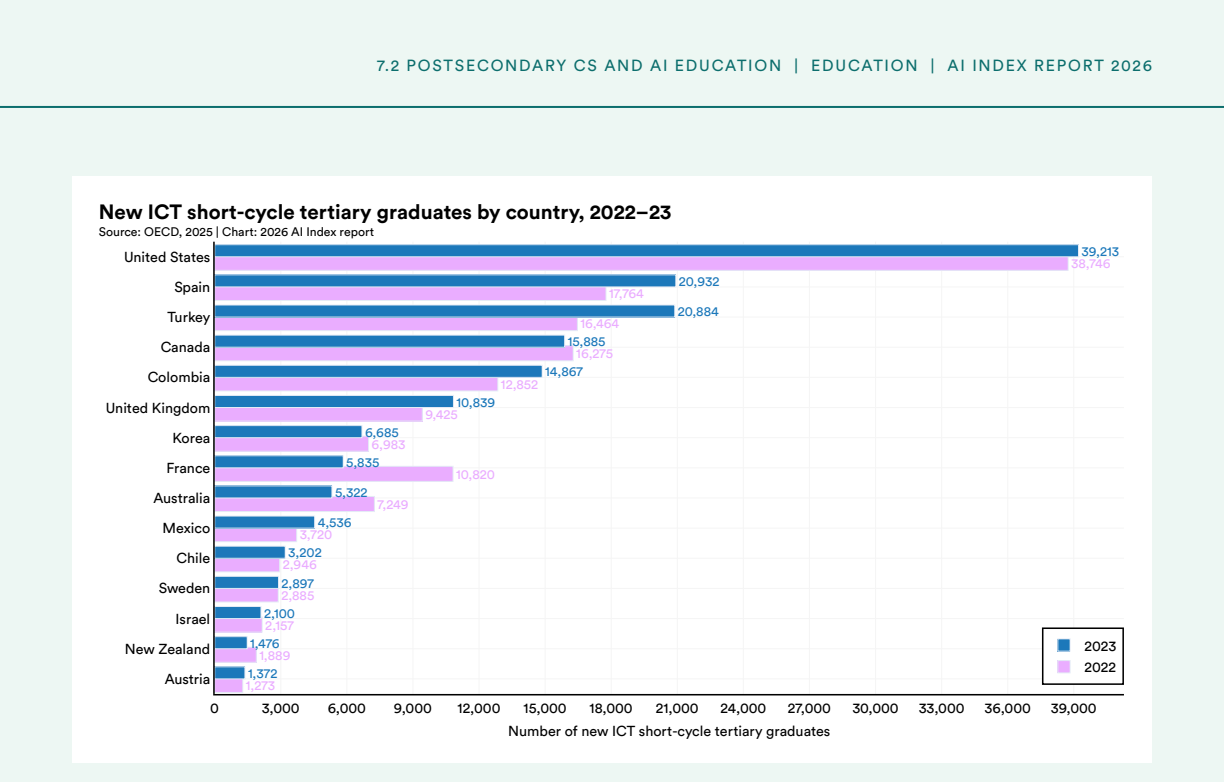
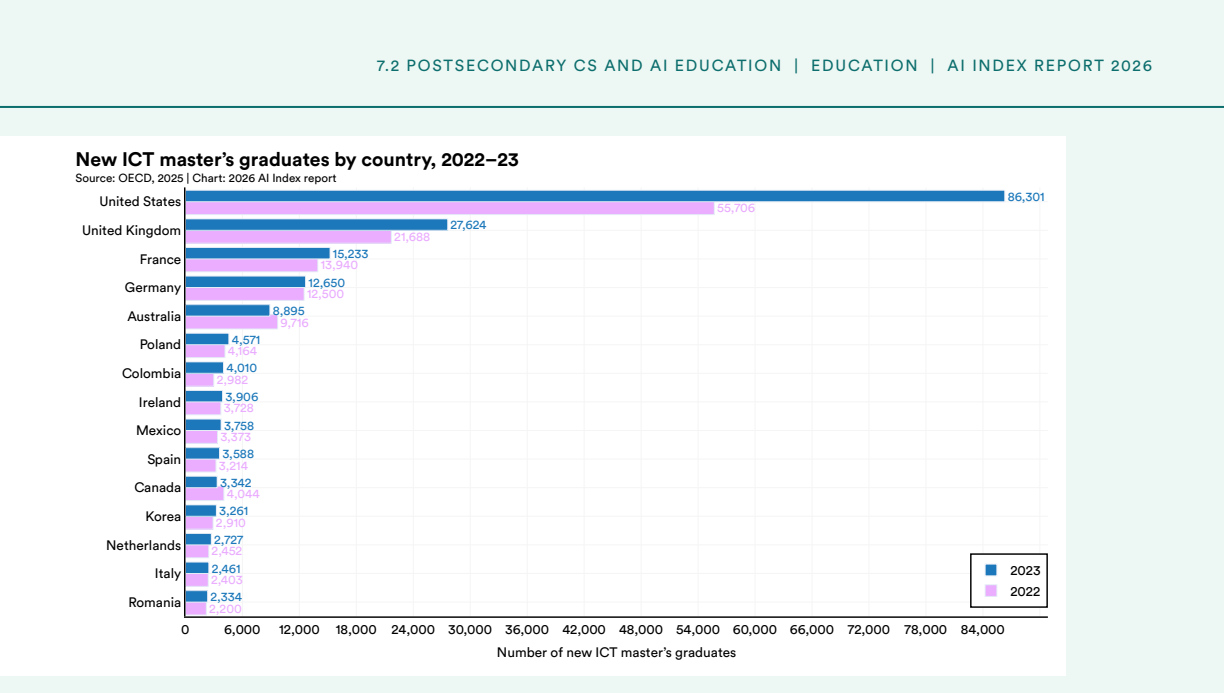
Figure 7.2. Figure 7.2: 5 A range of institutions produce the highest number of graduates in AI-related fields5 , including both public and private universities ( [PITH_FULL_IMAGE:figures/full_fig_p295_7_2.png] view at source ↗
Figure 7.2
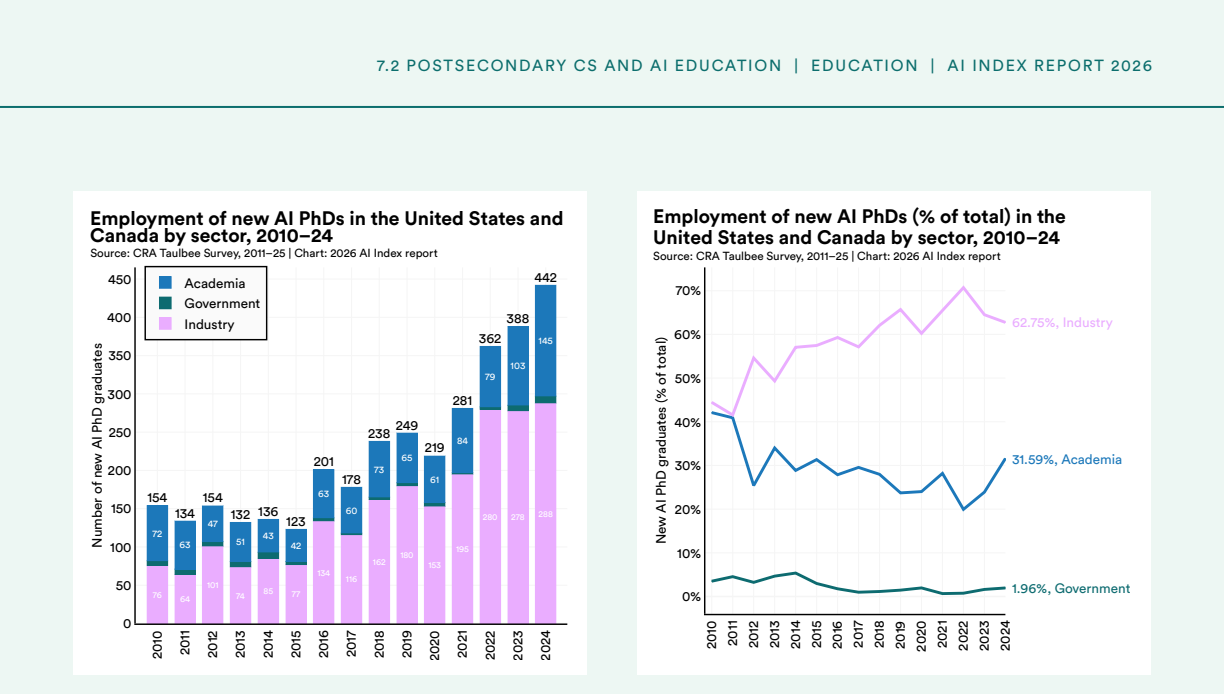
Figure 7.2. Figure 7.2: 6 AI PhD graduates continue to choose industry jobs and lucrative salaries more often than academic jobs, with 65% going into industry after graduation ( [PITH_FULL_IMAGE:figures/full_fig_p297_7_2.png] view at source ↗
Figure 7.2
Figure 7.2. Figure 7.2: 7 [PITH_FULL_IMAGE:figures/full_fig_p298_7_2.png] view at source ↗
Figure 7.2
Figure 7.2. Figure 7.2: 9 [PITH_FULL_IMAGE:figures/full_fig_p299_7_2.png] view at source ↗
Figure 7.2
Figure 7.2. Figure 7.2: 11 [PITH_FULL_IMAGE:figures/full_fig_p300_7_2.png] view at source ↗
Figure 7.2
Figure 7.2. Figure 7.2: 13 [PITH_FULL_IMAGE:figures/full_fig_p301_7_2.png] view at source ↗
Figure 7.2
Figure 7.2. Figure 7.2: 14 [PITH_FULL_IMAGE:figures/full_fig_p302_7_2.png] view at source ↗
Figure 7.2
Figure 7.2. Figure 7.2: 16 53% 49% 62% 62% 52% 23% 44% 63% 33% 33% 54% 33% 30% 20% 19% 95% (+42 pp) 90% (+41 pp) 89% (+27 pp) 87% (+25 pp) 84% (+32 pp) 84% (+61 pp) 84% (+40 pp) 83% (+20 pp) 83% (+50 pp) 81% (+48 pp) 79% (+25 pp) 77% (+44 pp) 68% (+38 pp) 67% (+47 pp) 67% (+48 pp) 0% 20% 40% 60% 80% 100% United Kingdom United States Turkey Australia Canada South Africa Mexico Kenya India South Korea Brazil Spain Saudi Arabia Ma… view at source ↗
Figure 7.2
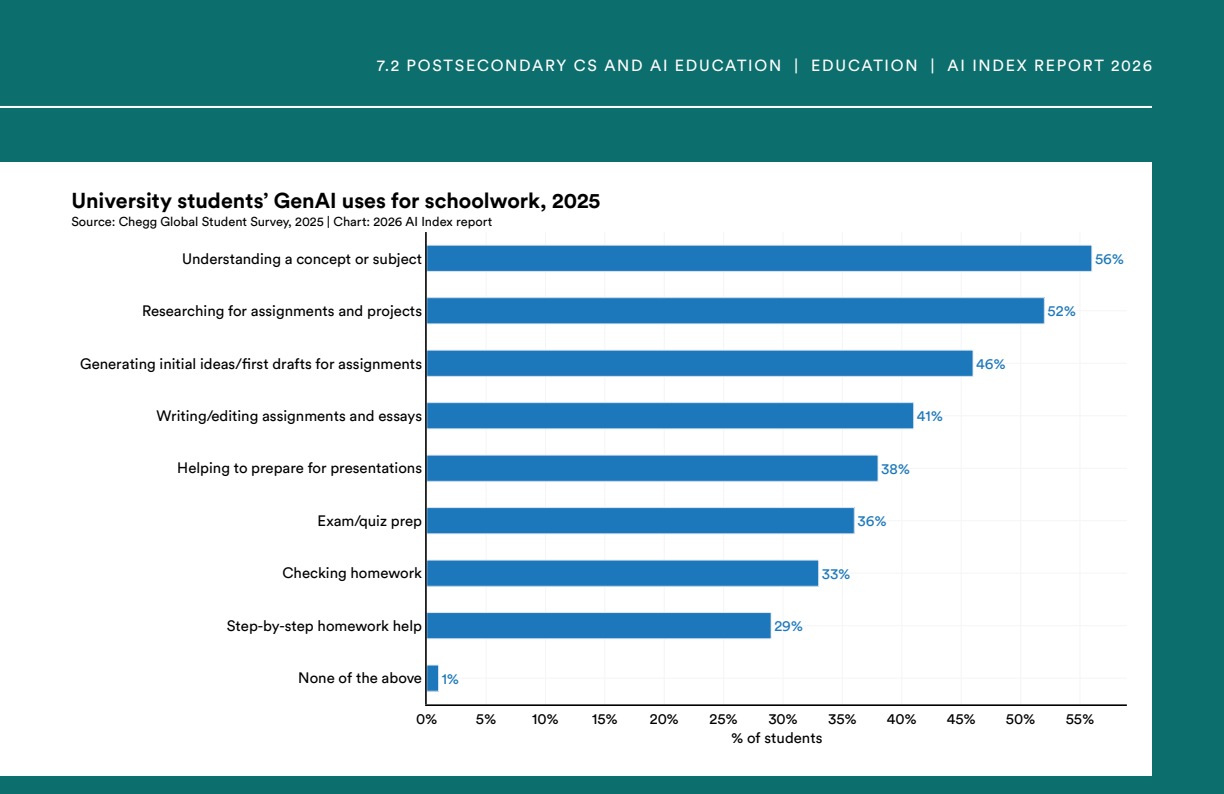
Figure 7.2. Figure 7.2: 17 1% 29% 33% 36% 38% 41% 46% 52% 56% 0% 5% 10% 15% 20% 25% 30% 35% 40% 45% 50% 55% None of the above Step-by-step homework help Checking homework Exam/quiz prep Helping to prepare for presentations Writing/editing assignments and essays Generating initial ideas/LJrst drafts for assignments Researching for assignments and projects Understanding a concept or subject % of students University students’ GenAI… view at source ↗
Figure 7.3
Figure 7.3. Figure 7.3: 1 [PITH_FULL_IMAGE:figures/full_fig_p305_7_3.png] view at source ↗
Figure 7.3
Figure 7.3. Figure 7.3: 2 [PITH_FULL_IMAGE:figures/full_fig_p306_7_3.png] view at source ↗
Figure 7.3
Figure 7.3. Figure 7.3: 4 [PITH_FULL_IMAGE:figures/full_fig_p307_7_3.png] view at source ↗
Figure 7.3
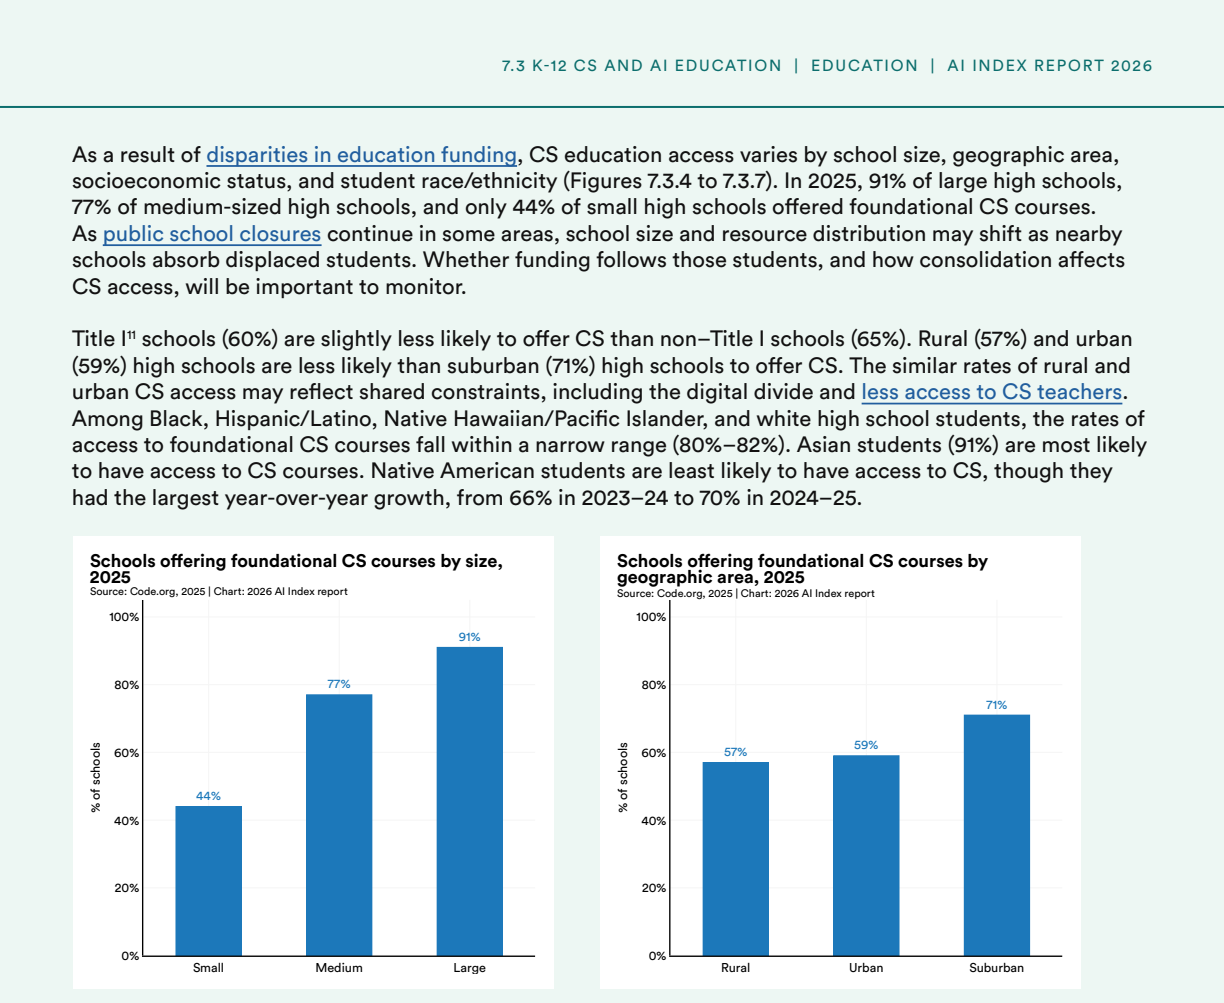
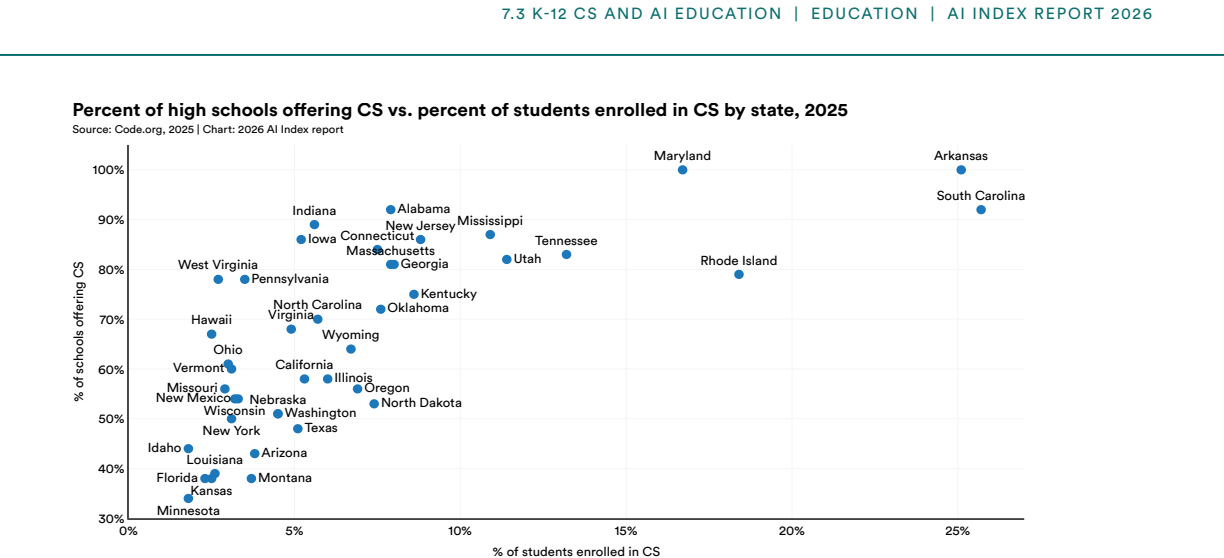
Figure 7.3. Figure 7.3: 7 Based on participation data from 42 states, 6.1% of students were enrolled in CS in 2024–25, but student participation in CS varies by state ( [PITH_FULL_IMAGE:figures/full_fig_p308_7_3.png] view at source ↗
Figure 7.3
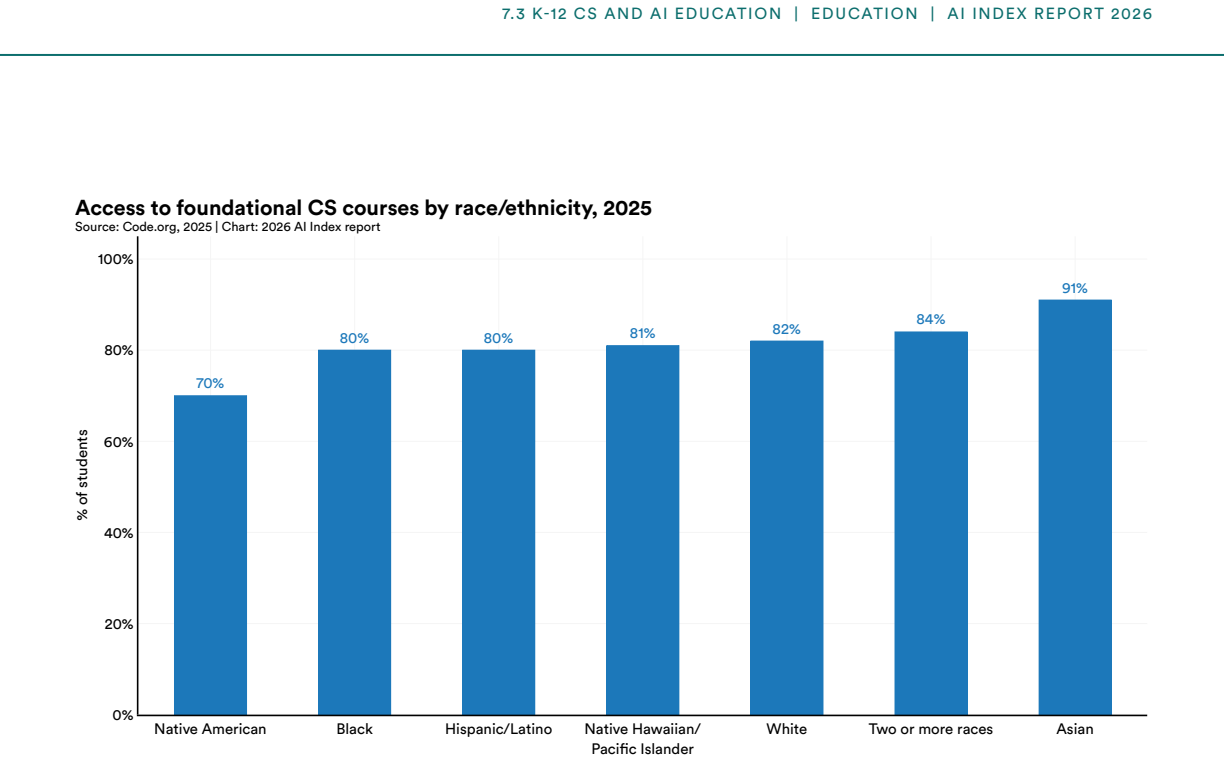
Figure 7.3. Figure 7.3: 8 [PITH_FULL_IMAGE:figures/full_fig_p309_7_3.png] view at source ↗
Figure 7.3
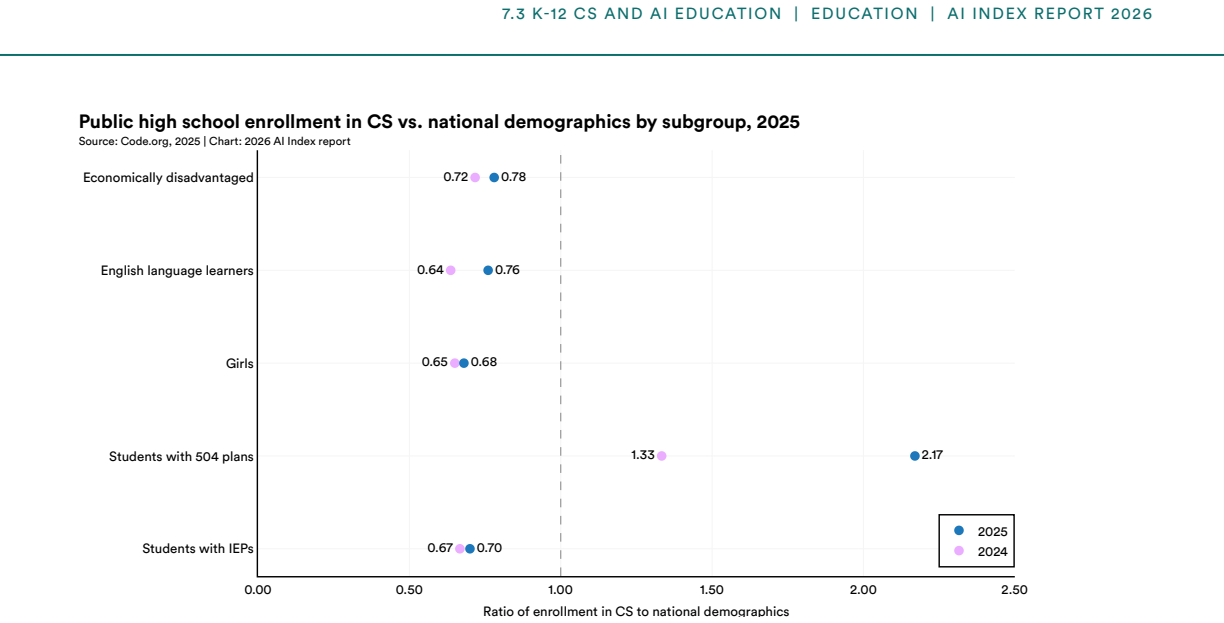
Figure 7.3. Figure 7.3: 10 [PITH_FULL_IMAGE:figures/full_fig_p310_7_3.png] view at source ↗
Figure 7.3
Figure 7.3. Figure 7.3: 1212 12 A student with a 504 plan receives accommodations under Section 504 of the Rehabilitation Act of 1973, a U.S. civil rights law that prohibits dis￾crimination against individuals with disabilities. A student with an IEP (individualized education program) receives special education services under the Individuals with Disabilities Education Act. An IEP is a legally binding document that outlines a l… view at source ↗
Figure 7.3
Figure 7.3. Figure 7.3: 13 [PITH_FULL_IMAGE:figures/full_fig_p312_7_3.png] view at source ↗
Figure 7.3
Figure 7.3. Figure 7.3: 15 [PITH_FULL_IMAGE:figures/full_fig_p313_7_3.png] view at source ↗
Figure 7.3
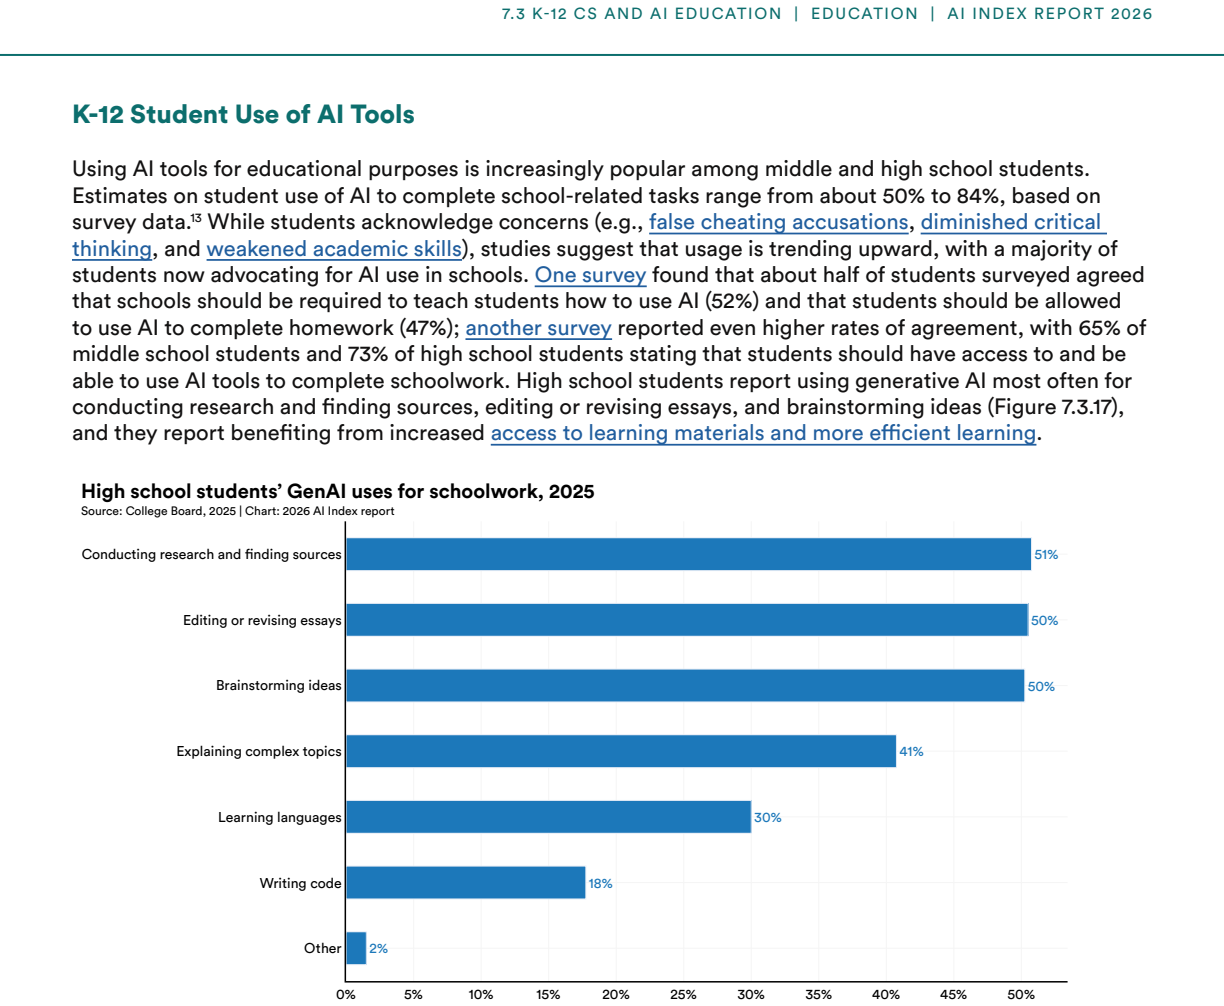
Figure 7.3. Figure 7.3: 1714 13 CDT (2025), 50%; College Board (2025), 84%; RAND (2025), 54%. 14 This chart shows the average percentage across College Board’s four survey administrations in 2025. 2% 18% 30% 41% 50% 50% 51% 0% 5% 10% 15% 20% 25% 30% 35% 40% 45% 50% Other Writing code Learning languages Explaining complex topics Brainstorming ideas Editing or revising essays Conducting research and LJnding sources High school stu… view at source ↗
Figure 7.3
Figure 7.3. Figure 7.3: 18 [PITH_FULL_IMAGE:figures/full_fig_p315_7_3.png] view at source ↗
Figure 7.3
Figure 7.3. Figure 7.3: 19 [PITH_FULL_IMAGE:figures/full_fig_p318_7_3.png] view at source ↗
Figure 7.4
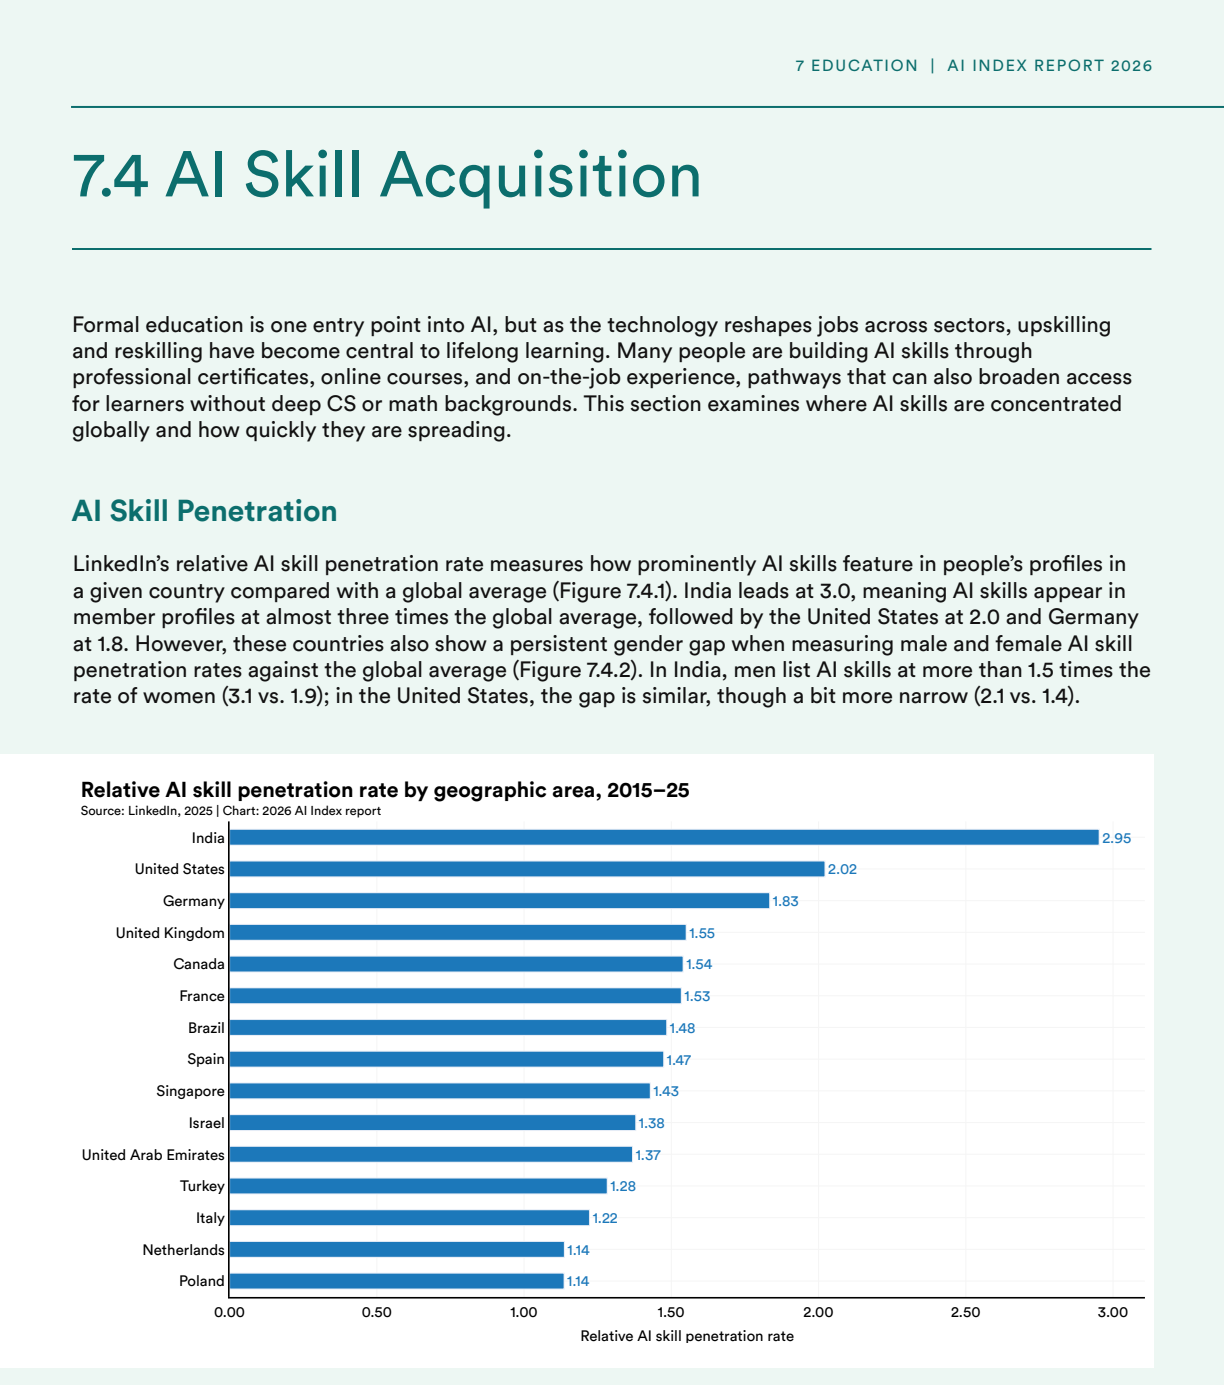
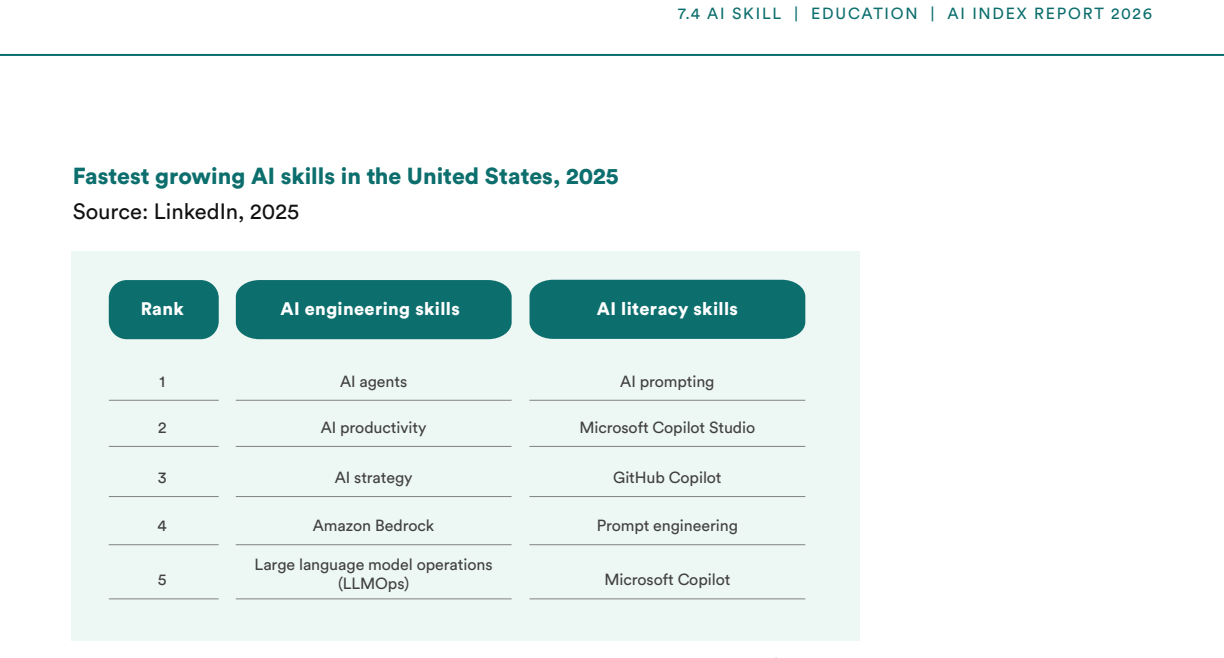
Figure 7.4. Figure 7.4: 1 1.14 1.14 1.22 1.28 1.37 1.38 1.43 1.47 1.48 1.53 1.54 1.55 1.83 2.02 2.95 0.00 0.50 1.00 1.50 2.00 2.50 3.00 Poland Netherlands Italy Turkey United Arab Emirates Israel Singapore Spain Brazil France Canada United Kingdom Germany United States India Relative AI skill penetration rate Relative AI skill penetration rate by geographic area, 2015–25 Source: LinkedIn, 2025 | Chart: 2026 AI Index report [PI… view at source ↗
Figure 7.4
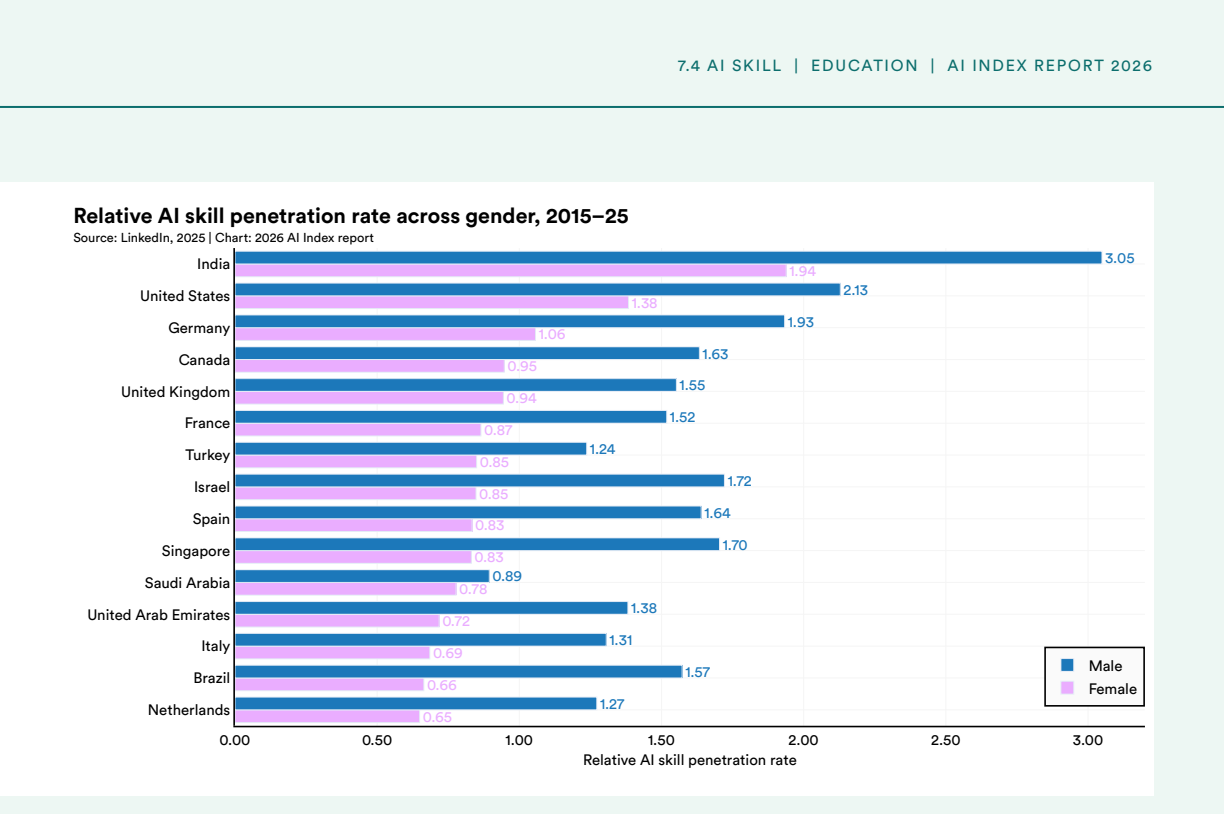
Figure 7.4. Figure 7.4: 2 0.65 0.66 0.69 0.72 0.78 0.83 0.83 0.85 0.85 0.87 0.94 0.95 1.06 1.38 1.94 1.27 1.57 1.31 1.38 0.89 1.70 1.64 1.72 1.24 1.52 1.55 1.63 1.93 2.13 3.05 0.00 0.50 1.00 1.50 2.00 2.50 3.00 Netherlands Brazil Italy United Arab Emirates Saudi Arabia Singapore Spain Israel Turkey France United Kingdom Canada Germany United States India Male Female Relative AI skill penetration rate Relative AI skill penetrati… view at source ↗
Figure 7.4
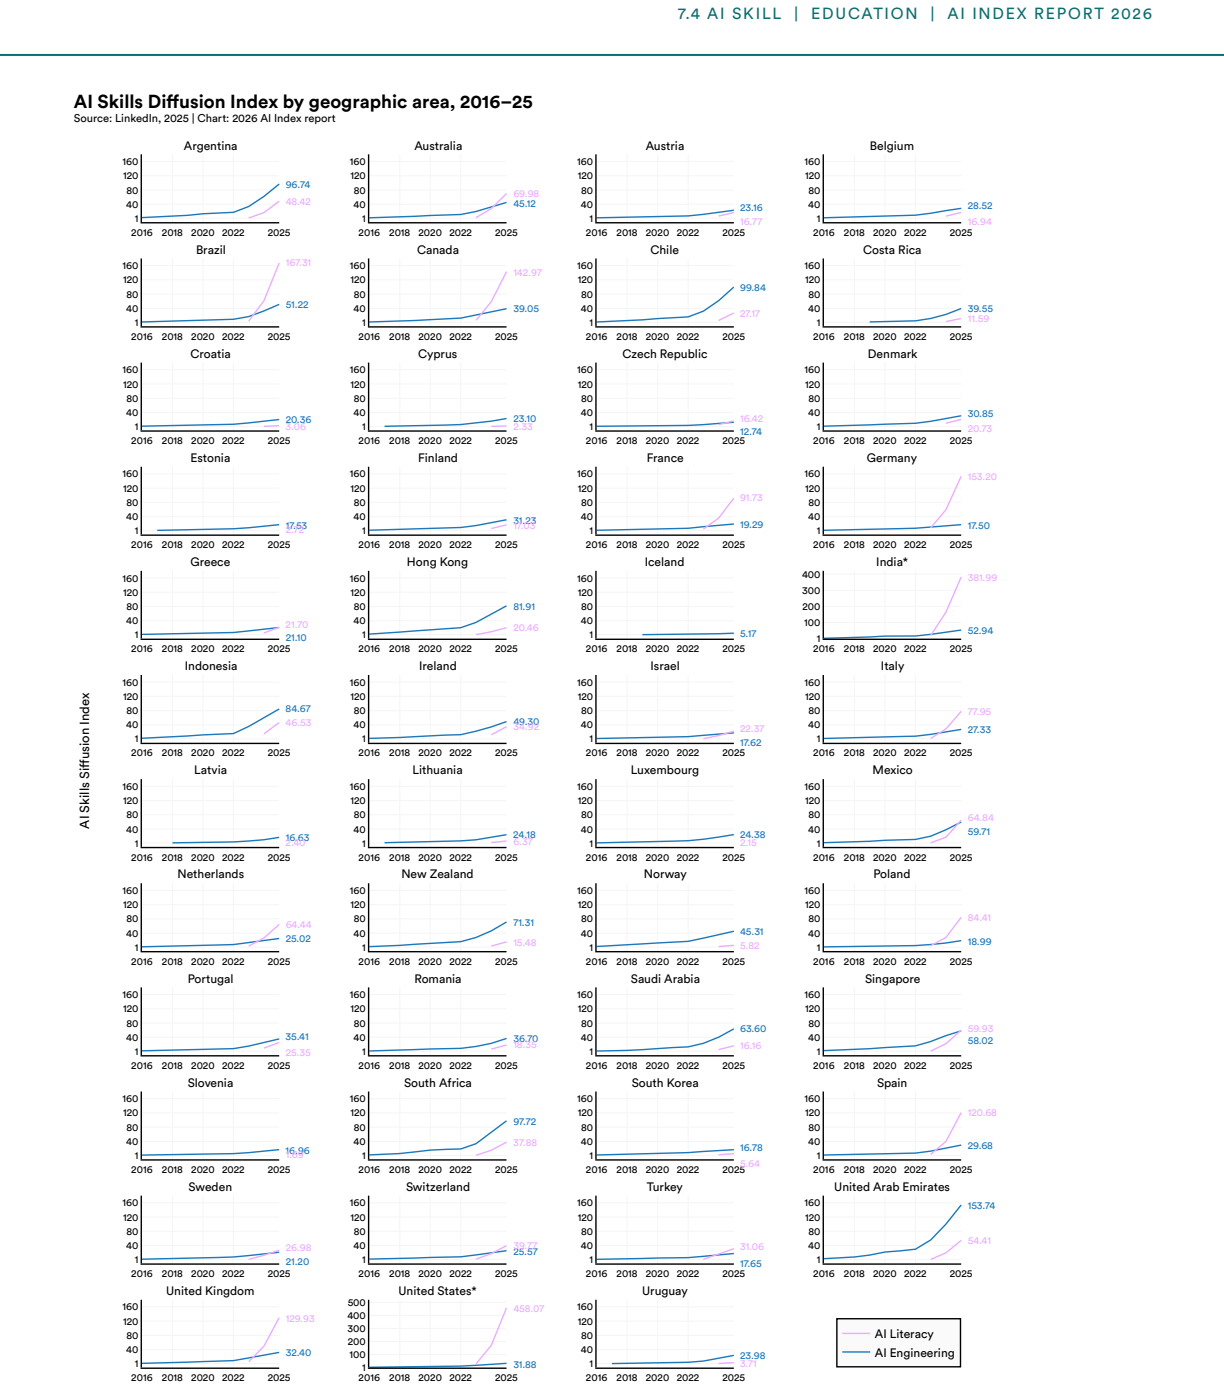
Figure 7.4. Figure 7.4: 315 15 Asterisks indicate that a country’s y-axis label is scaled differently than other countries’ [PITH_FULL_IMAGE:figures/full_fig_p321_7_4.png] view at source ↗
Figure 7.4
Figure 7.4. Figure 7.4: 4 [PITH_FULL_IMAGE:figures/full_fig_p322_7_4.png] view at source ↗
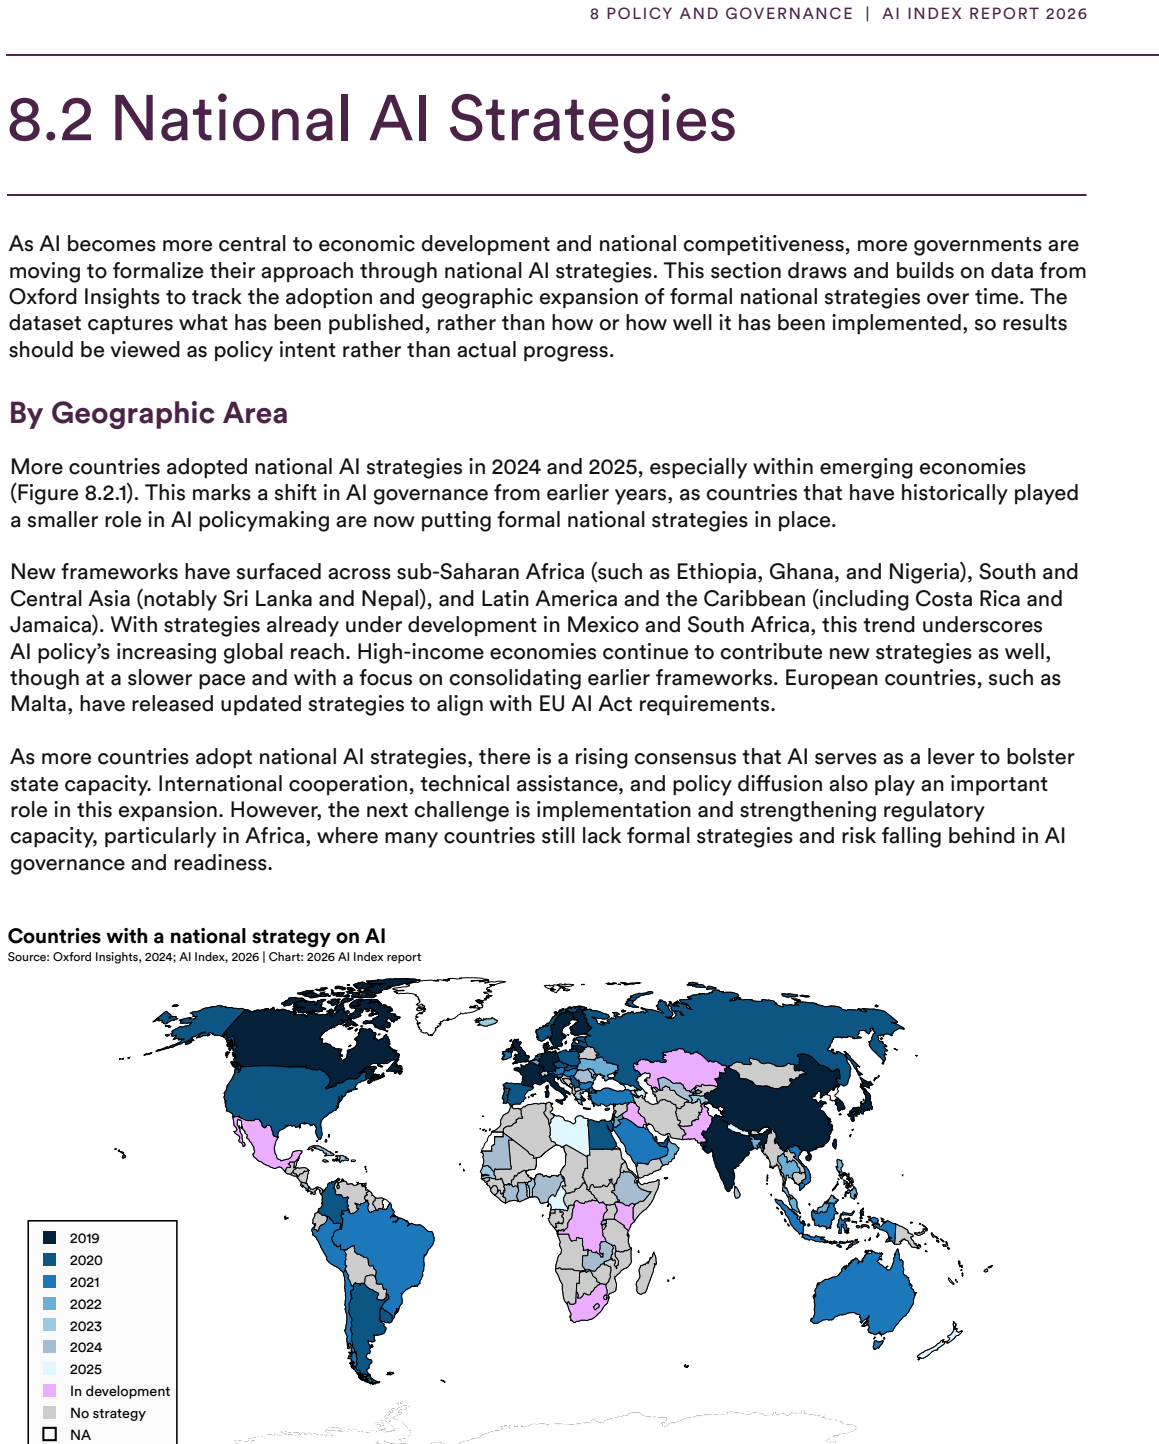
Figure 8.2
Figure 8.2. Figure 8.2: 1 [PITH_FULL_IMAGE:figures/full_fig_p331_8_2.png] view at source ↗
Figure 8.3
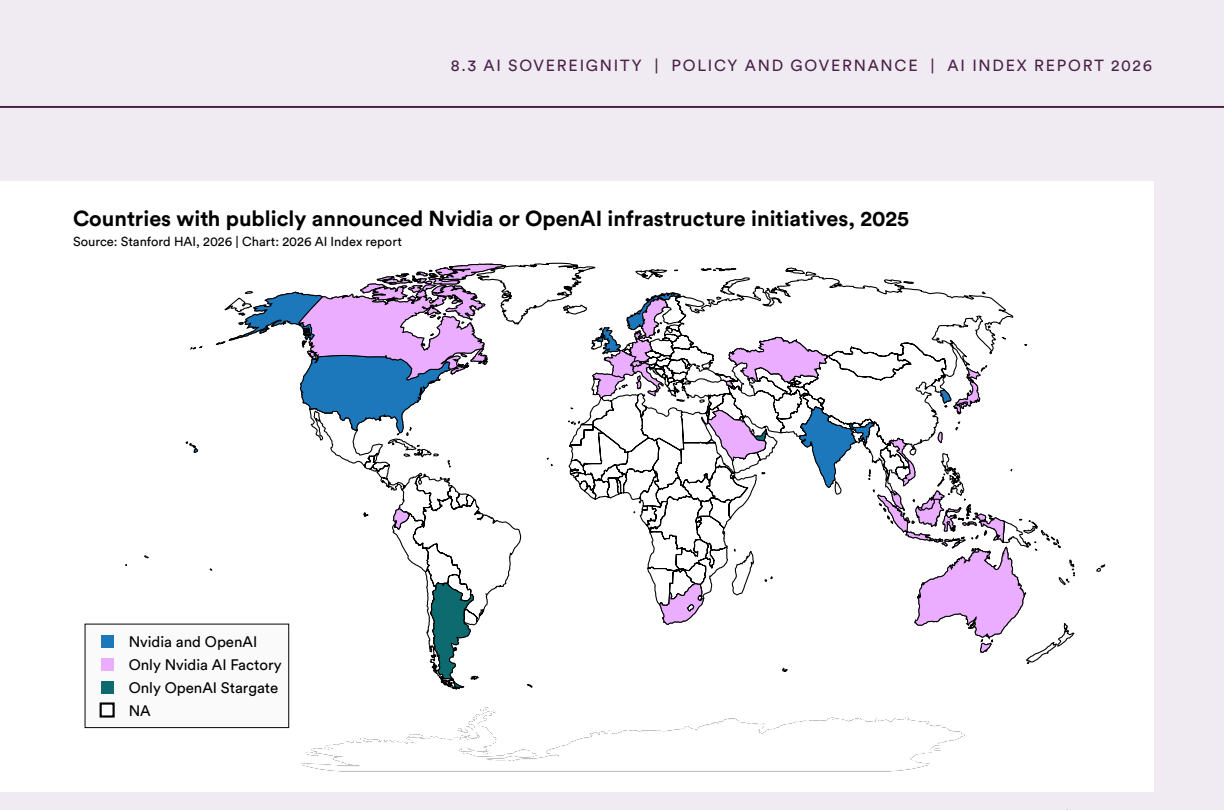
Figure 8.3. Figure 8.3: 1 [PITH_FULL_IMAGE:figures/full_fig_p333_8_3.png] view at source ↗
Figure 8.3
Figure 8.3. Figure 8.3: 2 Nvidia and OpenAI Only Nvidia AI Factory Only OpenAI Stargate NA Countries with publicly announced Nvidia or OpenAI infrastructure initiatives, 2025 Source: Stanford HAI, 2026 | Chart: 2026 AI Index report Data Sovereignty While infrastructure sovereignty focuses on control over compute resources, data sovereignty concerns the extent to which states or local actors have agency over how their data is co… view at source ↗
Figure 8.3
Figure 8.3. Figure 8.3: 3 Model Sovereignty Model sovereignty concerns a state’s capacity, influence, and control over the development and deployment of AI models. As discussed in Chapter 1, advanced AI model development has historically been concentrated in a small number of technology hubs, primarily in the United States and China. While that persists, open-source frameworks have lowered barriers to entry, and a growing numbe… view at source ↗
Figure 8.3
Figure 8.3. Figure 8.3: 4 Based on Epoch AI data tracking publicly reported model releases, cumulative U.S. model releases grew from 237 to 1,618 between 2018 and 2025. China exhibits a similar acceleration between 2022 and 2025, where model releases more than quintupled from 151 to 849, suggesting a rapid scaling of domestic capabilities and intensified competition with U.S. model development. These figures reflect the full ra… view at source ↗
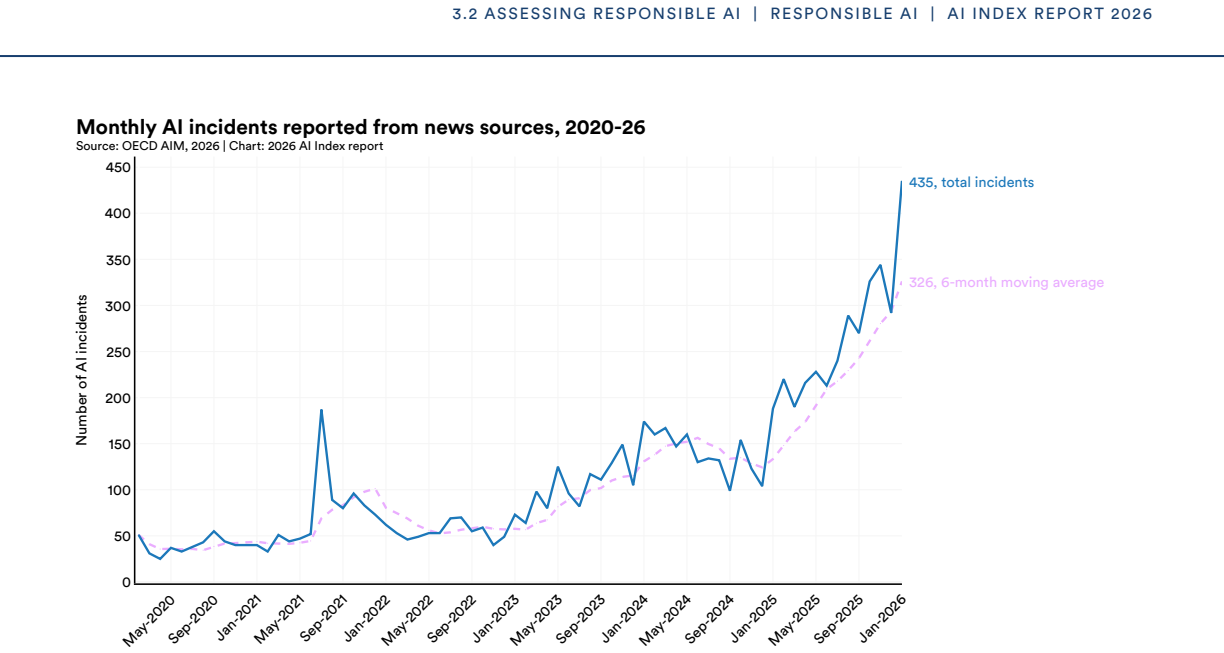
Figure 8.3
Figure 8.3. Figure 8.3: 5 [PITH_FULL_IMAGE:figures/full_fig_p338_8_3.png] view at source ↗
Figure 8.3
Figure 8.3. Figure 8.3: 6 8.3 AI SOVEREIGNITY | POLICY AND GOVERNANCE | AI INDEX REPORT 2026 Cross-border AI talent circulation has slowed recently, even where net flows remain stable (see Section 1.8 of Chapter 1). Both inflows and outflows are declining, suggesting that talent is increasingly staying within national or regional systems rather than circulating globally ( [PITH_FULL_IMAGE:figures/full_fig_p340_8_3.png] view at source ↗
Figure 8.4
Figure 8.4. Figure 8.4: 1 [PITH_FULL_IMAGE:figures/full_fig_p341_8_4.png] view at source ↗
Figure 8.4
Figure 8.4. Figure 8.4: 2 [PITH_FULL_IMAGE:figures/full_fig_p342_8_4.png] view at source ↗
Figure 8.4
Figure 8.4. Figure 8.4: 4 [PITH_FULL_IMAGE:figures/full_fig_p344_8_4.png] view at source ↗
Figure 8.4
Figure 8.4. Figure 8.4: 6 HIGHLIGHT: State AI Legislation Amid Shifting Federal Policy While federal AI policy shifted toward deregulation in 2025, state legislatures continued to move ahead with AI-specific laws on their own in the absence of a federal framework.6 State policies are developing across different tracks, including targeted protections against discrimination, misinformation, and abuse. Several of the most prominen… view at source ↗
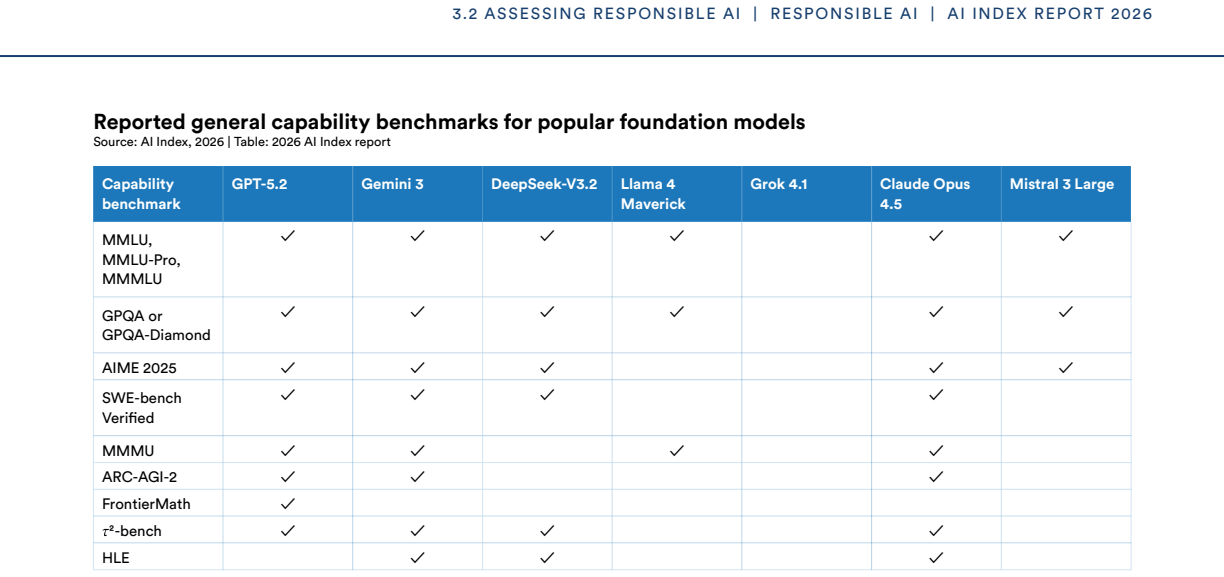
Figure 8.4
Figure 8.4. Figure 8.4: 7 [PITH_FULL_IMAGE:figures/full_fig_p347_8_4.png] view at source ↗
Figure 8.4
Figure 8.4. Figure 8.4: 9 US Regulations Federal regulatory activity on AI has grown in recent years, with the number of AI-related regulations increasing from one recorded action in 2016 to 58 in 2025 ( [PITH_FULL_IMAGE:figures/full_fig_p348_8_4.png] view at source ↗
Figure 8.4
Figure 8.4. Figure 8.4: 10 By Agency The increasing number of AI-related regulations has been driven by a wide set of federal agencies ( [PITH_FULL_IMAGE:figures/full_fig_p349_8_4.png] view at source ↗
Figure 8.4
Figure 8.4. Figure 8.4: 11 [PITH_FULL_IMAGE:figures/full_fig_p350_8_4.png] view at source ↗
Figure 8.5
Figure 8.5. Figure 8.5: 1 [PITH_FULL_IMAGE:figures/full_fig_p354_8_5.png] view at source ↗
Figure 8.5
Figure 8.5. Figure 8.5: 3 [PITH_FULL_IMAGE:figures/full_fig_p355_8_5.png] view at source ↗
Figure 8.5
Figure 8.5. Figure 8.5: 5 [PITH_FULL_IMAGE:figures/full_fig_p356_8_5.png] view at source ↗
Figure 8.5
Figure 8.5. Figure 8.5: 7 Europe European nations collectively committed10 approximately $3.7 billion in contracts over the 2013–24 period ( [PITH_FULL_IMAGE:figures/full_fig_p357_8_5.png] view at source ↗
Figure 8.5
Figure 8.5. Figure 8.5: 8 [PITH_FULL_IMAGE:figures/full_fig_p358_8_5.png] view at source ↗
Figure 8.5
Figure 8.5. Figure 8.5: 10 [PITH_FULL_IMAGE:figures/full_fig_p359_8_5.png] view at source ↗
Figure 9.1
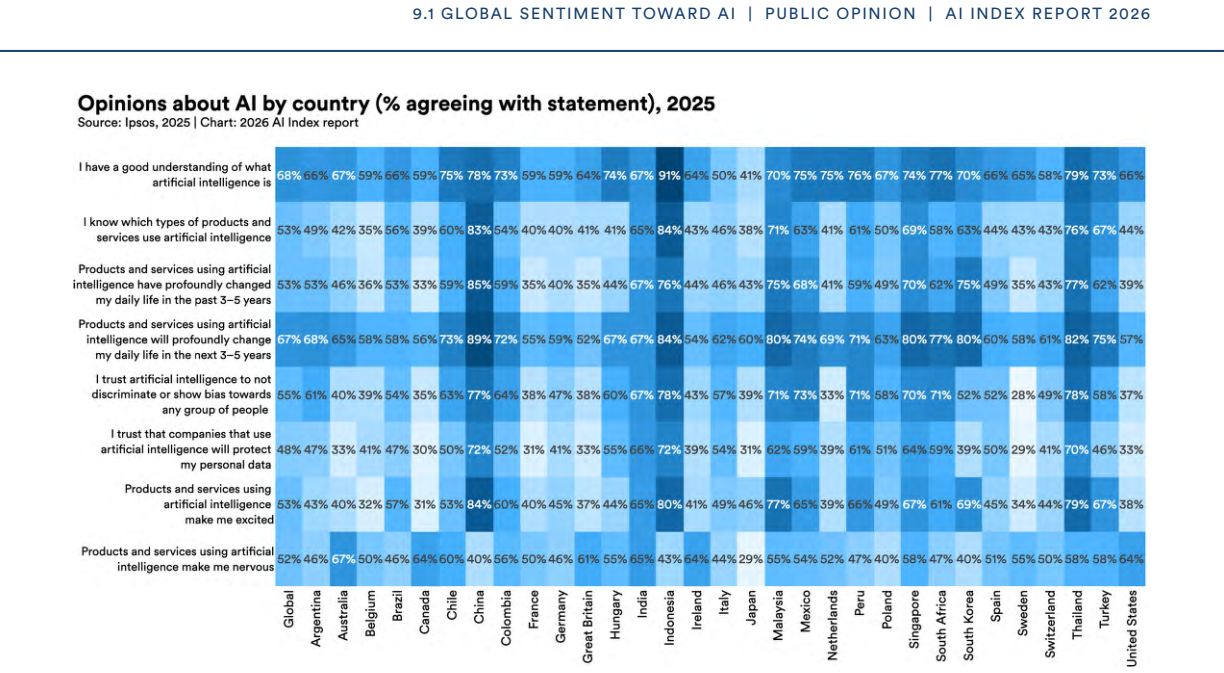
Figure 9.1. Figure 9.1: 1 [PITH_FULL_IMAGE:figures/full_fig_p363_9_1.png] view at source ↗
Figure 9.1
Figure 9.1. Figure 9.1: 2 9.1 GLOBAL SENTIMENT TOWARD AI | PUBLIC OPINION | AI INDEX REPORT 2026 [PITH_FULL_IMAGE:figures/full_fig_p364_9_1.png] view at source ↗
Figure 9.1
Figure 9.1. Figure 9.1: 3 [PITH_FULL_IMAGE:figures/full_fig_p365_9_1.png] view at source ↗
Figure 9.1
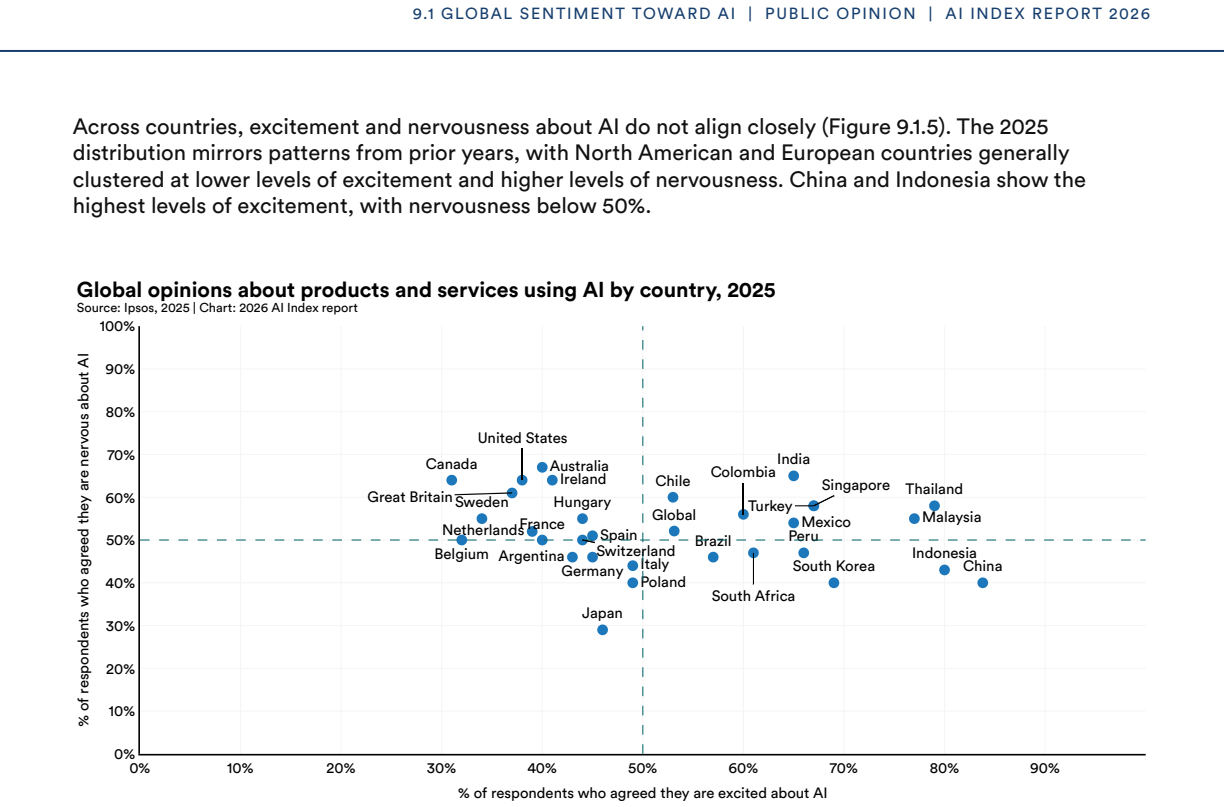
Figure 9.1. Figure 9.1: 5 9.1 GLOBAL SENTIMENT TOWARD AI | PUBLIC OPINION | AI INDEX REPORT 2026 [PITH_FULL_IMAGE:figures/full_fig_p366_9_1.png] view at source ↗
Figure 9.1
Figure 9.1. Figure 9.1: 6 In both 2024 and 2025, Ipsos asked respondents how likely they thought it was that AI would change their job or completely replace it within the next five years. Results from 2025 show that perceptions remained stable year over year ( [PITH_FULL_IMAGE:figures/full_fig_p367_9_1.png] view at source ↗
Figure 9.1
Figure 9.1. Figure 9.1: 7 50% 73% 69% 64% 63% 63% 63% 59% 57% 50% 45% 45% 45% 43% 42% 42% 41% 41% 39% 38% 32% 29% 50% 27% 31% 36% 37% 37% 37% 41% 43% 50% 55% 55% 55% 57% 58% 58% 59% 59% 61% 62% 68% 67% 0% 20% 40% 60% 80% 100% United States Canada United Kingdom Germany Italy Ireland Belgium France Australia Spain Poland South Africa Argentina Singapore Brazil India South Korea United Arab Emirates Mexico Japan Nigeria Global Cr… view at source ↗
Figure 9.1
Figure 9.1. Figure 9.1: 9 [PITH_FULL_IMAGE:figures/full_fig_p369_9_1.png] view at source ↗
Figure 9.1
Figure 9.1. Figure 9.1: 11 The survey also asked employees about their organization’s level of support for AI strategy, AI literacy, and AI governance ( [PITH_FULL_IMAGE:figures/full_fig_p371_9_1.png] view at source ↗
Figure 9.2
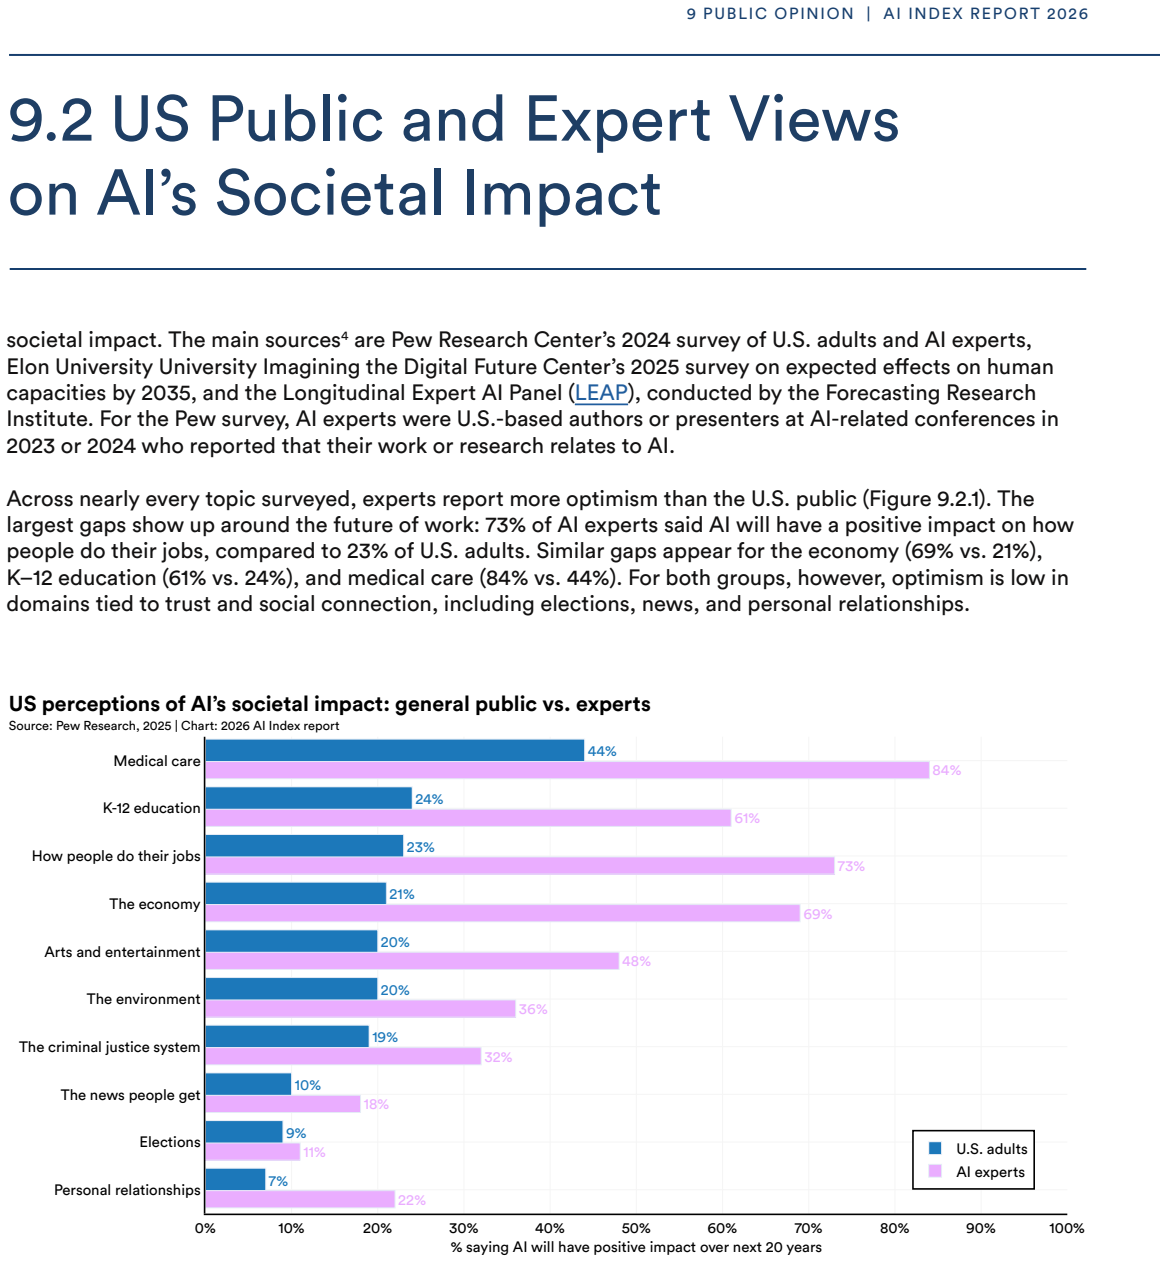
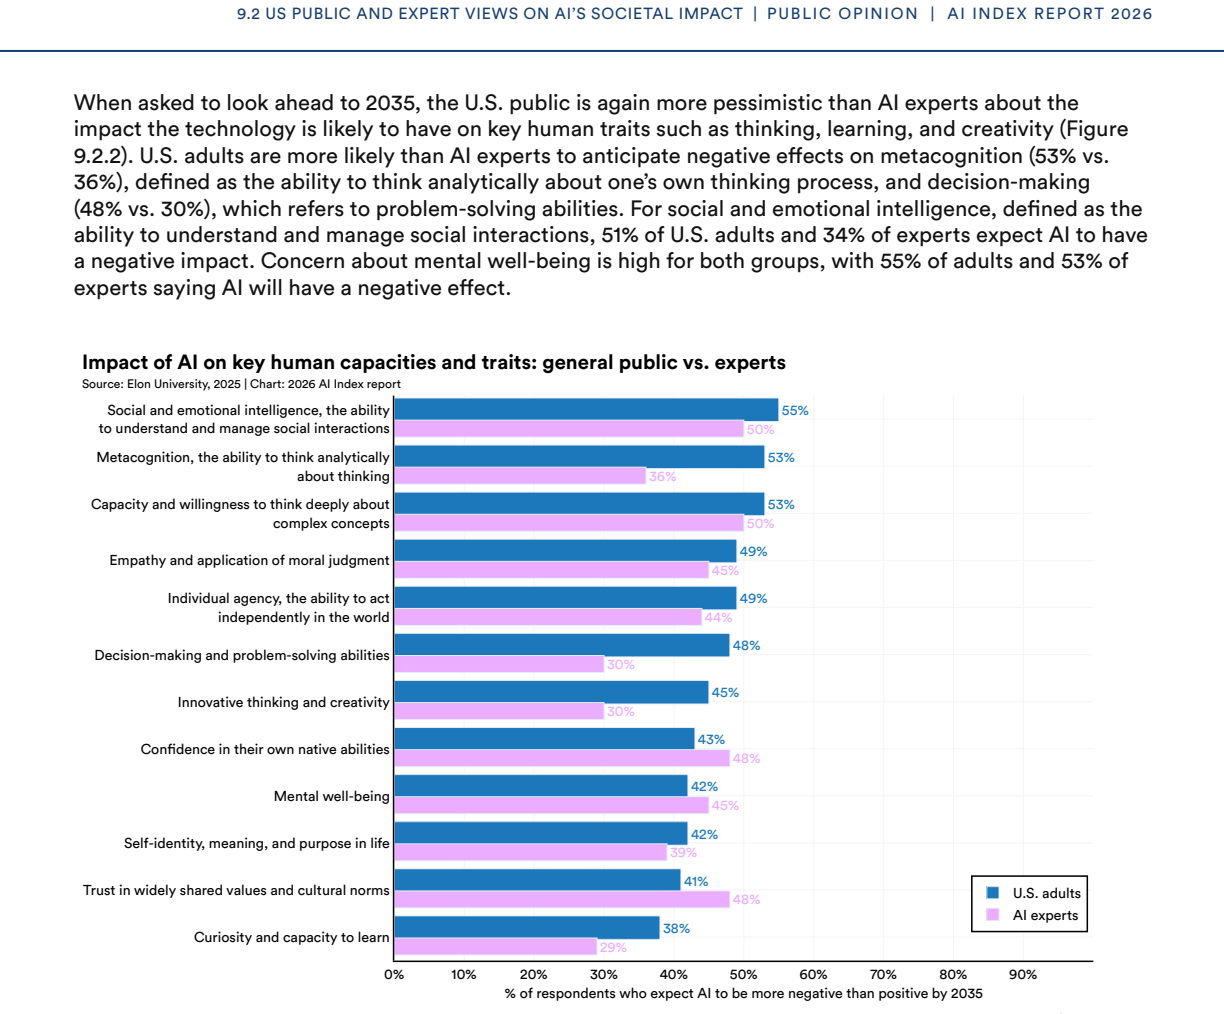
Figure 9.2. Figure 9.2: 1 9 PUBLIC OPINION | AI INDEX REPORT 2026 9.2 US Public and Expert Views on AI’s Societal Impact [PITH_FULL_IMAGE:figures/full_fig_p372_9_2.png] view at source ↗
Figure 9.2
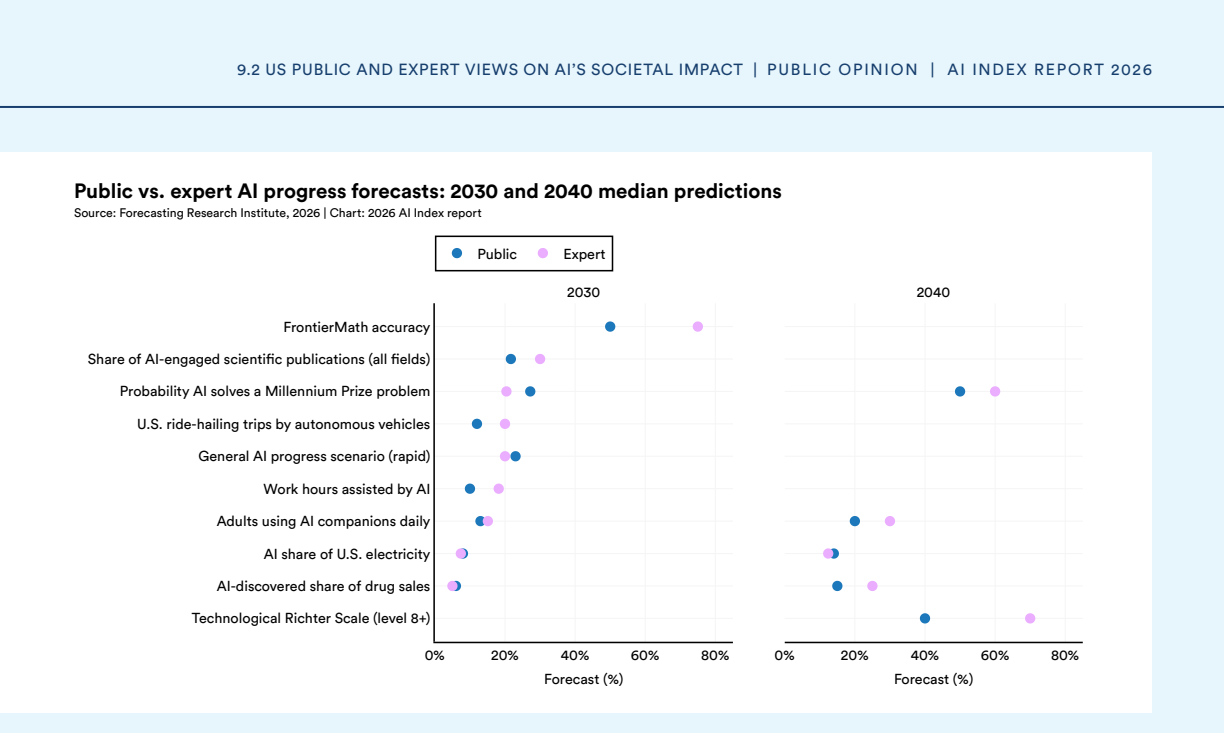
Figure 9.2. Figure 9.2: 2 9.2 US PUBLIC AND EXPERT VIEWS ON AI’S SOCIETAL IMPACT | PUBLIC OPINION | AI INDEX REPORT 2026 [PITH_FULL_IMAGE:figures/full_fig_p373_9_2.png] view at source ↗
Figure 9.2
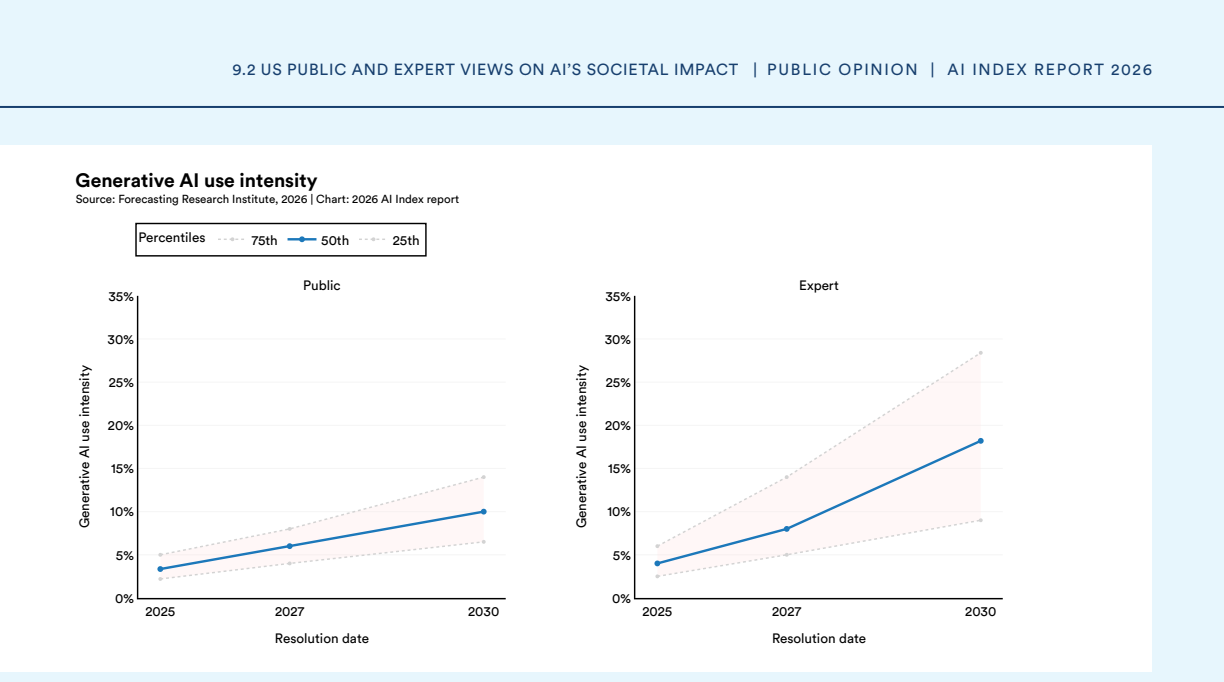
Figure 9.2. Figure 9.2: 35 5 Not all questions in the LEAP survey were asked for both 2030 and 2040. Forecast horizons vary by topic and were set according to what was most meaningful or measurable for each question. As a result, the absence of a 2040 value for some items reflects survey design rather than missing responses. Views on employment over the long term show a similar pattern ( [PITH_FULL_IMAGE:figures/full_fig_p374_… view at source ↗
Figure 9.2
Figure 9.2. Figure 9.2: 5 9.2 US PUBLIC AND EXPERT VIEWS ON AI’S SOCIETAL IMPACT | PUBLIC OPINION | AI INDEX REPORT 2026 73% 67% 59% 48% 45% 43% 33% 29% 28% 23% 73% 60% 60% 50% 35% 31% 62% 27% 18% 38% 0% 10% 20% 30% 40% 50% 60% 70% 80% 90% Lawyers Medical doctors Mental health therapists Truck drivers Teachers Musicians Software engineers Journalists Factory workers Cashiers U.S. adults AI experts % of respondents saying AI wil… view at source ↗
Figure 9.2
Figure 9.2. Figure 9.2: 7 9.2 US PUBLIC AND EXPERT VIEWS ON AI’S SOCIETAL IMPACT | PUBLIC OPINION | AI INDEX REPORT 2026 [PITH_FULL_IMAGE:figures/full_fig_p376_9_2.png] view at source ↗
Figure 9.2
Figure 9.2. Figure 9.2: 86 6 “Asian” includes English-speaking respondents only. Respondents who did not provide an answer are not shown. “White,” “Black,” and “Asian” adults are non-Hispanic and report only one race; “Hispanic” adults may be of any race [PITH_FULL_IMAGE:figures/full_fig_p377_9_2.png] view at source ↗
Figure 9.2
Figure 9.2. Figure 9.2: 9 9.2 US PUBLIC AND EXPERT VIEWS ON AI’S SOCIETAL IMPACT | PUBLIC OPINION | AI INDEX REPORT 2026 [PITH_FULL_IMAGE:figures/full_fig_p378_9_2.png] view at source ↗
Figure 9.2
Figure 9.2. Figure 9.2: 107 7 Totals may not equal 100% due to rounding of individual values. AI companions differ from traditional task-oriented AI by prioritizing relationship building over functionality (Zhang and Lu, 2023; Zhang et al., 2025). Modern systems incorporate memory of past interactions, can recognize emotion, and adapt their responses to individual users’ needs (Yang et al., 2025). Platforms like Replika, Charac… view at source ↗
Figure 9.3
Figure 9.3. Figure 9.3: 1 [PITH_FULL_IMAGE:figures/full_fig_p380_9_3.png] view at source ↗
Figure 9.3
Figure 9.3. Figure 9.3: 2 [PITH_FULL_IMAGE:figures/full_fig_p381_9_3.png] view at source ↗
Figure 9.3
Figure 9.3. Figure 9.3: 38 8 In Ipsos’ reporting of findings, percentage points are rounded to the nearest whole number. As a result, figures may not add up to exactly 100%. 58% 71% 70% 68% 67% 67% 66% 65% 63% 62% 62% 54% 54% 53% 53% 53% 52% 52% 52% 48% 47% 46% 41% 29% 30% 32% 33% 33% 34% 35% 37% 38% 38% 46% 46% 47% 44% 47% 48% 48% 48% 52% 53% 54% 0% 20% 40% 60% 80% India South Africa Ireland Australia Italy Canada Singapore Un… view at source ↗
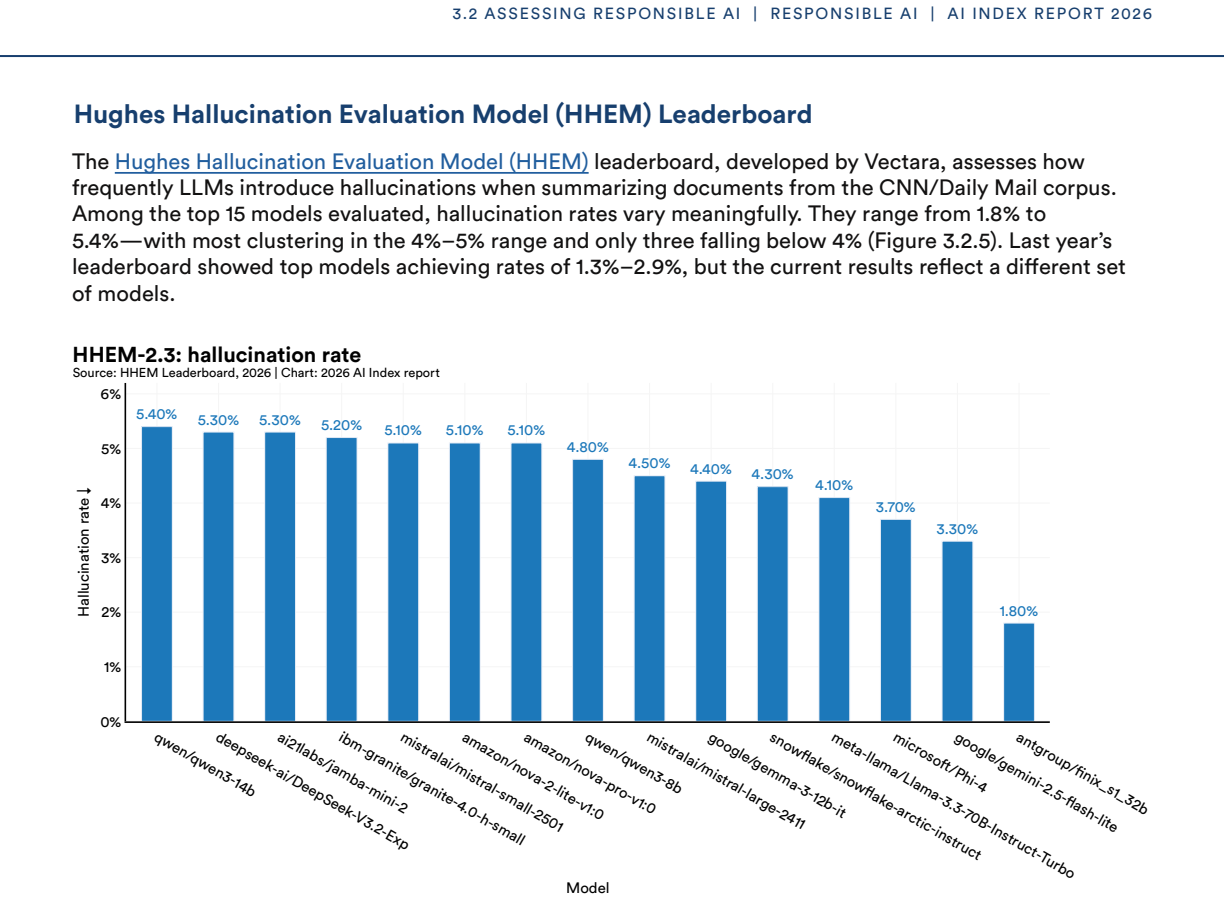
Figure 9.3
Figure 9.3. Figure 9.3: 5 9.3 PERCEPTIONS ON AI TRUST, TRANSPARENCY, AND REGULATION | PUBLIC OPINION | AI INDEX REPORT 2026 enough (48%). Across nearly every state, more respondents said regulation does not go far enough than said it goes too far. Roughly one in three respondents in most states said they were not sure, making uncertainty the second-largest category [PITH_FULL_IMAGE:figures/full_fig_p383_9_3.png] view at source ↗
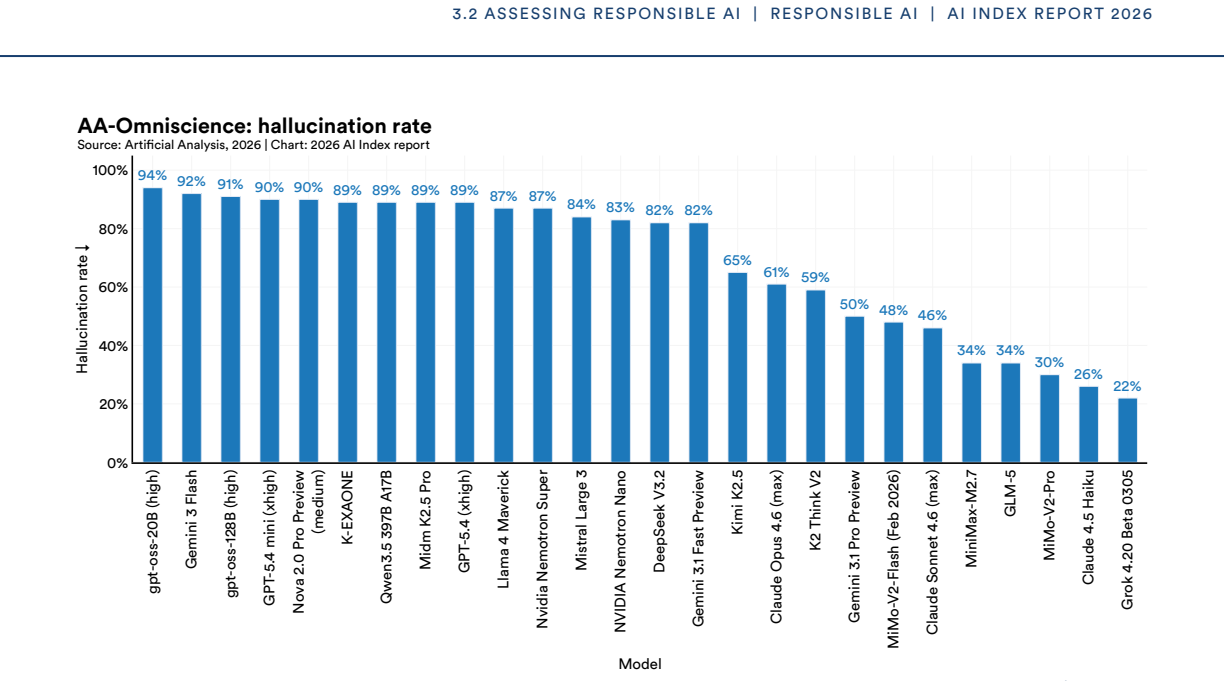
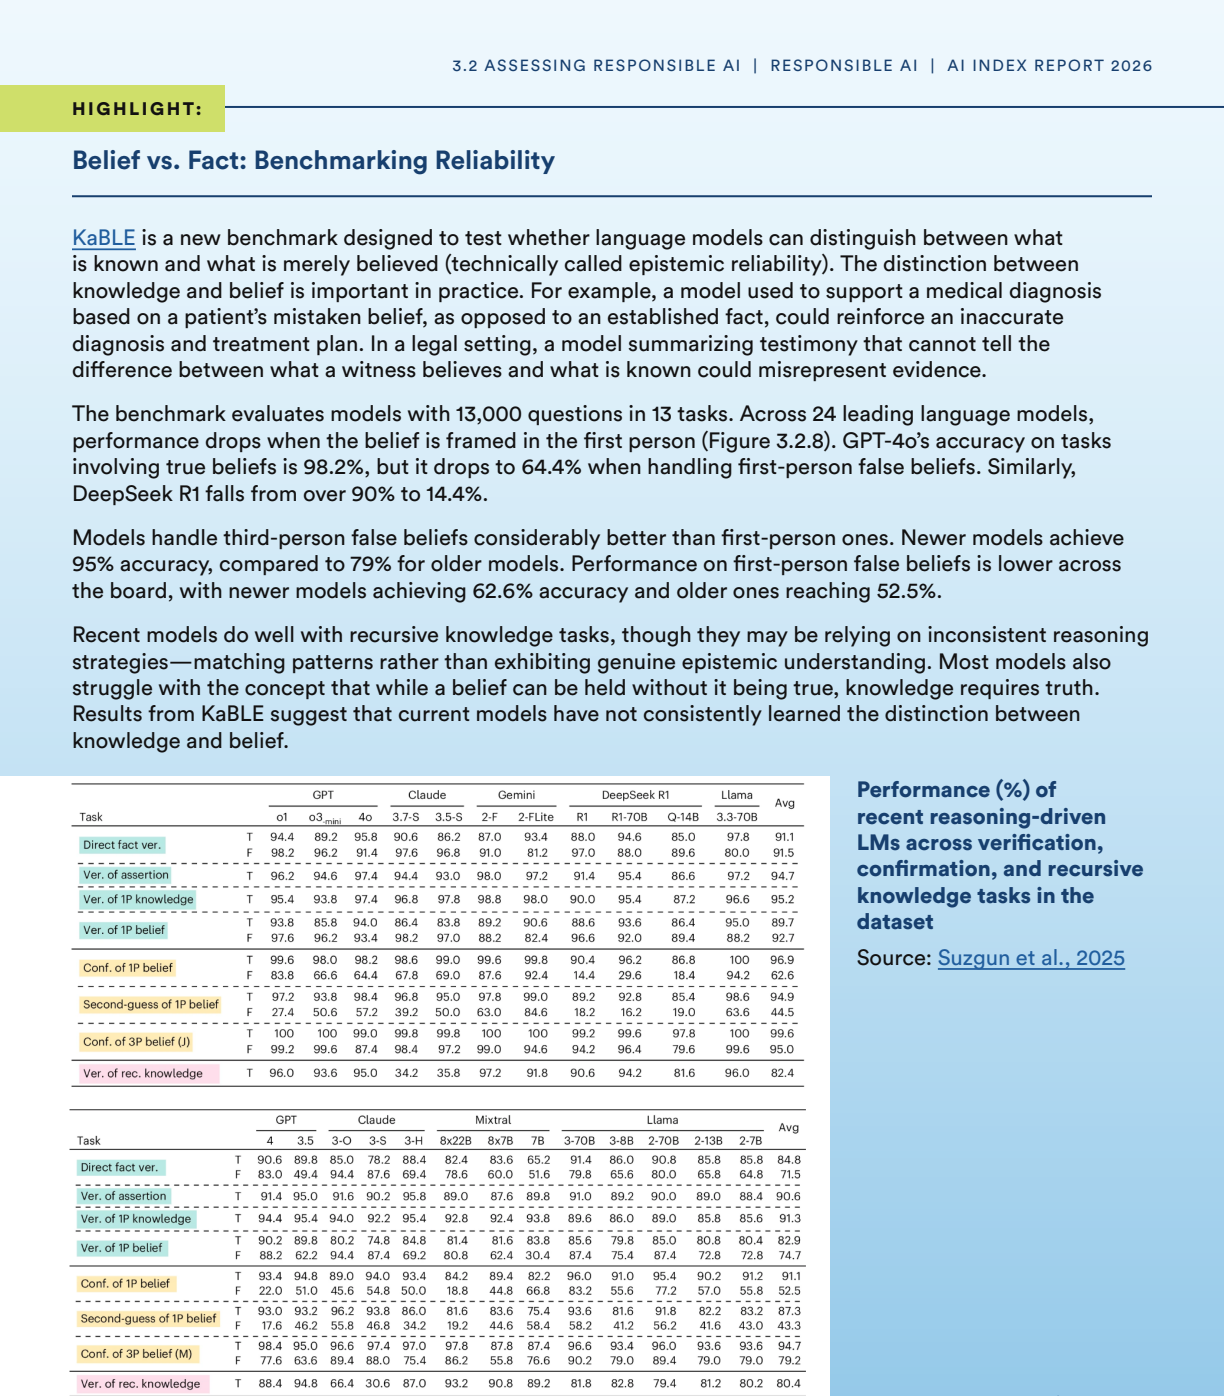
Figure 9.3
Figure 9.3. Figure 9.3: 6 9.3 PERCEPTIONS ON AI TRUST, TRANSPARENCY, AND REGULATION | PUBLIC OPINION | AI INDEX REPORT 2026 Across U.S. demographic groups, the strongest concern about insufficient AI regulation was reported among older adults, especially those 65 and older (51%) ( [PITH_FULL_IMAGE:figures/full_fig_p384_9_3.png] view at source ↗

discussion (0)

Sign in with ORCID, Apple, or X to comment. Anyone can read and Pith papers without signing in.

Reference graph

Works this paper leans on

3 extracted references · 1 canonical work pages · 1 internal anchor

  1. [1]

    My boyfriend is AI

    Bengio, Y ., Clare, S., Prunkl, C., Rismani, S., Andriushchenko, M., Bucknall, B., Fox, P ., Hu, T., Jones, C., Manning, S., Maslej, N., Mavroudis, V., McGlynn, C., Murray, M., Stix, C., Velasco, L., Wheeler, N., Privitera, D., Mindermann, S., … Zhu, L. (2025). International AI safety report 2025: First key update: Capabilities and risk implications (arXi...

  2. [2]

    https:/ /imaginingthedigitalfuture.org/reports- and-publications/public-views-on-being-human-in-2035/ Uslu, A., Wihbey, J., Lazer, D., Perlis, R

    Elon University. https:/ /imaginingthedigitalfuture.org/reports- and-publications/public-views-on-being-human-in-2035/ Uslu, A., Wihbey, J., Lazer, D., Perlis, R. H., Ognyanova, K., Baum, M. A., Druckman, J. N., Santillana, M., Qu, H., & Sullivan, G. (2025). AI across America: Attitudes on AI usage, job impact, and federal regulation. The Civic Health Ins...

  3. [3]

    https:/ / doi.org/10.3390/healthcare13050446 APPENDIX | AI INDEX REPORT 2026 425 Zhang, E., & Lu, X. (2023). Social AI improves well-being among female young adults (arXiv:2311.14706). arXiv. https:/ / doi.org/10.48550/ arXiv.2311.14706 Zhang, R., Li, H., Meng, H., Zhan, J., Gan, H., & Lee, Y .-C. (2025). The dark side of AI companionship: A taxonomy of h...