A Systematic Analysis of Out-of-Distribution Detection Under Representation and Training Paradigm Shifts
Pith reviewed 2026-05-21 18:00 UTC · model grok-4.3
The pith
The competitive family of out-of-distribution detectors depends more on the learned representation than on the choice of scoring method.
A machine-rendered reading of the paper's core claim, the machinery that carries it, and where it could break.
Core claim
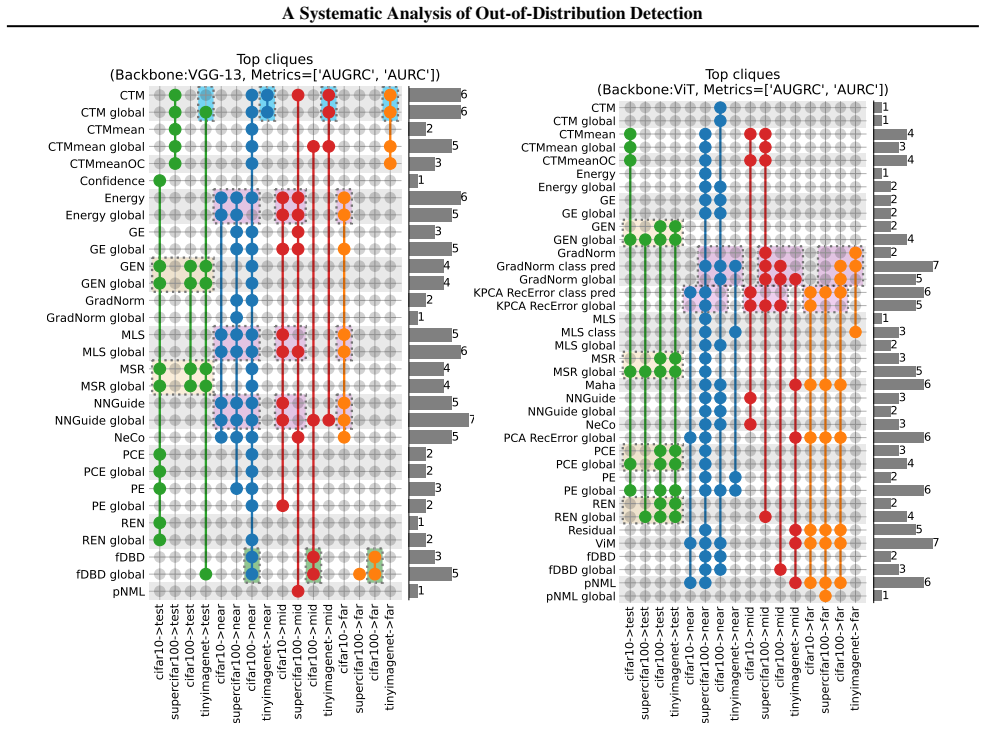
The competitive detector family depends more on the learned representation than on score design alone. For both CNNs and ViTs, simple probabilistic scores dominate misclassification detection. On CNNs, margin-based scores are strongest in near-OOD regimes, while geometry-aware scores such as NNGuide, fDBD, and CTM become more competitive as shift severity increases. On fine-tuned ViTs, the top cliques are led mainly by reconstruction- and residual-based scores. These ranking shifts align with neural collapse metrics computed from the last-layer representation, and the authors propose a PCA-based projection-filtering procedure plus an NC-measurement approach that predicts a competitive short-
What carries the argument
Neural collapse metrics on last-layer representations that quantify prototype alignment with classifier weights and feature collapse, used to interpret and predict which detector families are competitive under different representation regimes.
If this is right
- Simple probabilistic scores remain reliable for misclassification detection across CNNs and ViTs.
- Margin-based scores are the strongest choice for near-OOD detection on CNNs.
- Geometry-aware scores gain competitiveness as distribution shift severity increases on CNNs.
- Reconstruction- and residual-based scores lead on fine-tuned vision transformers.
- Neural collapse measurements from a trained classifier can shortlist competitive detectors without any OOD data.
Where Pith is reading between the lines
- Users could compute neural collapse metrics on their own trained model to select a detector family before seeing any out-of-distribution examples.
- The PCA projection filtering step may be worth testing as a lightweight way to improve other representation-based downstream tasks.
- Training methods that increase neural collapse could indirectly strengthen out-of-distribution detection performance.
Load-bearing premise
That CLIP-derived semantic distances create meaningful and stable near/mid/far groupings that track genuine differences in detection difficulty, and that the multiple-comparison-controlled rank pipeline with AURC/AUGRC metrics avoids selection bias when naming top cliques.
What would settle it
An experiment on new architectures or training regimes in which detector-family rankings fail to track neural collapse measurements or in which the proposed PCA projection filter produces no consistent improvement.
Figures

read the original abstract
We present a systematic benchmark of out-of-distribution (OOD) detection CSFs through a representation-centric lens. Our study spans CNN and ViT backbones, multiple training paradigms, four image-classification source datasets (CIFAR-10, CIFAR-100, SuperCIFAR-100, and TinyImageNet), and OOD datasets grouped into near, mid, and far regimes using CLIP-derived semantic distances. To compare CSFs across these settings, we employ a multiple-comparison-controlled rank pipeline that identifies top cliques of statistically indistinguishable winners under threshold-free ranking metrics (AURC and AUGRC). The main empirical finding is that the competitive detector family depends more on the learned representation than on score design alone. For both CNNs and ViTs, simple probabilistic scores dominate misclassification detection. On CNNs, margin-based scores are strongest in near-OOD regimes, while geometry-aware scores such as NNGuide, fDBD, and CTM become more competitive as shift severity increases. On fine-tuned ViTs, the top cliques are led mainly by reconstruction- and residual-based scores. To interpret these ranking shifts, we analyze the last-layer representation using Neural Collapse (NC) metrics. The resulting picture is consistent across architectures: prototype- and boundary-aware scores become stronger when the representation is more collapsed and better aligned with classifier weights, whereas weaker-collapse regimes favor gradient- and manifold-based scores. Building on these insights, we propose two contributions: a simple PCA-based projection-filtering procedure that improves detector performance, and an approach that uses NC measurements computed from a trained classifier to predict its competitive out-of-distribution detector shortlist, without requiring any additional OOD data.
Editorial analysis
A structured set of objections, weighed in public.
Referee Report
Summary. The manuscript presents a systematic empirical benchmark of out-of-distribution (OOD) detection scoring functions (CSFs) across CNN and Vision Transformer (ViT) backbones under various training paradigms and source datasets (CIFAR-10, CIFAR-100, SuperCIFAR-100, TinyImageNet). OOD datasets are grouped into near, mid, and far regimes using CLIP-derived semantic distances. A multiple-comparison-controlled rank pipeline is used to identify top cliques of detectors based on AURC and AUGRC metrics. The key finding is that the competitive detector families depend more on the learned representation than on the specific score design, with patterns such as probabilistic scores dominating misclassification detection, margin-based scores performing well in near-OOD for CNNs, and reconstruction/residual scores leading for fine-tuned ViTs. Neural Collapse (NC) metrics are employed to interpret these shifts, leading to proposals for a PCA-based projection-filtering procedure and an NC-based predictor for detector shortlists without additional OOD data.
Significance. If the results are robust, this study offers important insights into how representation properties influence the effectiveness of different OOD detection approaches, providing a more nuanced understanding beyond isolated comparisons. The incorporation of Neural Collapse analysis to explain performance variations and the development of practical tools like the projection filter and NC predictor represent constructive contributions. The use of statistical controls in ranking adds rigor to the benchmarking process.
major comments (2)
- [OOD regime partitioning (experimental setup or methods section describing dataset grouping)] The definition of near/mid/far OOD regimes is based exclusively on CLIP-derived semantic distances between source and OOD classes. However, there is no reported validation demonstrating that these distances correlate with actual detection difficulty, for instance by showing that baseline scores like MSP exhibit statistically different AURC or AUROC across the regimes independent of the evaluated CSFs. This is load-bearing for the central claim, as the observed ranking transitions (e.g., margin-based scores strongest in near-OOD on CNNs, geometry-aware scores more competitive with increasing shift severity) are interpreted as effects of representation and shift severity; without this correlation, the regime-specific findings risk being artifacts of the grouping method rather than genuine differences in detection challenges.
- [Neural Collapse analysis and interpretation of ranking shifts] In the section analyzing ranking shifts via Neural Collapse metrics, the link between representation collapse/alignment and score family performance (prototype-aware scores stronger under high collapse) is presented as consistent across architectures, but lacks explicit quantitative support such as correlation values or predictive regressions between NC quantities and clique membership or rank positions of score families.
minor comments (2)
- [Methods or experimental pipeline description] Provide more granular details on the exact statistical procedure for the multiple-comparison-controlled rank pipeline, including the test used for clique identification and the correction method, to support full reproducibility.
- [Results tables/figures on top cliques] In tables or figures showing top cliques per regime/architecture, include the number of underlying datasets or independent runs to allow readers to gauge the stability of the reported rankings.
Simulated Author's Rebuttal
We thank the referee for the thoughtful and constructive review. The comments highlight important aspects of our experimental design and analysis that warrant clarification and strengthening. We address each major comment point by point below and outline the revisions we will make.
read point-by-point responses
-
Referee: [OOD regime partitioning (experimental setup or methods section describing dataset grouping)] The definition of near/mid/far OOD regimes is based exclusively on CLIP-derived semantic distances between source and OOD classes. However, there is no reported validation demonstrating that these distances correlate with actual detection difficulty, for instance by showing that baseline scores like MSP exhibit statistically different AURC or AUROC across the regimes independent of the evaluated CSFs. This is load-bearing for the central claim, as the observed ranking transitions (e.g., margin-based scores strongest in near-OOD on CNNs, geometry-aware scores more competitive with increasing shift severity) are interpreted as effects of representation and shift severity; without this correlation, the regime-specific findings risk being artifacts of the grouping method rather than genuine.
Authors: We agree that explicit validation of the regime partitioning would strengthen the manuscript and better support the interpretation of representation-dependent ranking shifts. While CLIP semantic distances follow established practices for defining semantic similarity in OOD literature, we did not include a direct check (e.g., MSP AURC differences across regimes with statistical tests). In the revision we will add this validation in the methods or results section, reporting AURC/AUROC for MSP (and optionally one or two other baselines) across near/mid/far regimes with appropriate multiple-comparison corrections, to confirm that the grouping aligns with measurable differences in detection difficulty. revision: yes
-
Referee: [Neural Collapse analysis and interpretation of ranking shifts] In the section analyzing ranking shifts via Neural Collapse metrics, the link between representation collapse/alignment and score family performance (prototype-aware scores stronger under high collapse) is presented as consistent across architectures, but lacks explicit quantitative support such as correlation values or predictive regressions between NC quantities and clique membership or rank positions of score families.
Authors: We appreciate this observation. The current analysis relies on qualitative consistency of patterns across architectures and settings, but we acknowledge that adding quantitative measures would make the link more rigorous. In the revised manuscript we will compute and report Pearson (or Spearman) correlations between key NC metrics (collapse, alignment, and variability) and the rank positions or clique membership indicators of score families. We will also include a brief regression analysis predicting score-family performance from NC quantities, with results presented in the Neural Collapse section or an appendix. revision: yes
Circularity Check
Empirical benchmarking with post-hoc NC analysis; no derivation reduces to fitted quantity by construction
full rationale
The paper is a systematic empirical benchmark of OOD detection scores across CNN/ViT architectures, training paradigms, and source datasets, with OOD regimes grouped by CLIP semantic distances and rankings obtained via multiple-comparison-controlled AURC/AUGRC pipelines. The central claim that competitive detector families depend more on learned representations than score design is supported by observed ranking shifts and post-hoc Neural Collapse metric analysis of last-layer representations. The proposed NC-based predictor for detector shortlists is explicitly described as an empirical observation and approach rather than a closed-form derivation or statistical fit that reuses the same data as a 'prediction.' No self-definitional equations, fitted-input predictions, or load-bearing self-citations appear in the provided derivation chain; the work remains self-contained against external benchmarks.
Axiom & Free-Parameter Ledger
axioms (1)
- domain assumption CLIP-derived semantic distances accurately group OOD datasets into near, mid, and far regimes that reflect meaningful detection difficulty differences
Lean theorems connected to this paper
-
IndisputableMonolith/Cost/FunctionalEquation.leanwashburn_uniqueness_aczel unclear?
unclearRelation between the paper passage and the cited Recognition theorem.
We analyze the last-layer representation using Neural Collapse (NC) metrics... Equiangularity of the class means... Variability Collapse: 1/C Tr(ΣW Σ†B)
-
IndisputableMonolith/Foundation/AlexanderDuality.leanalexander_duality_circle_linking unclear?
unclearRelation between the paper passage and the cited Recognition theorem.
CLIP-based stratification of OOD datasets into near/mid/far semantic regimes
What do these tags mean?
- matches
- The paper's claim is directly supported by a theorem in the formal canon.
- supports
- The theorem supports part of the paper's argument, but the paper may add assumptions or extra steps.
- extends
- The paper goes beyond the formal theorem; the theorem is a base layer rather than the whole result.
- uses
- The paper appears to rely on the theorem as machinery.
- contradicts
- The paper's claim conflicts with a theorem or certificate in the canon.
- unclear
- Pith found a possible connection, but the passage is too broad, indirect, or ambiguous to say the theorem truly supports the claim.
Reference graph
Works this paper leans on
-
[1]
B., Belkhir, N., Popescu, S., Manzanera, A., and Franchi, G
Ammar, M. B., Belkhir, N., Popescu, S., Manzanera, A., and Franchi, G. Neco: Neural collapse based out-of- distribution detection.ArXiv Preprint ArXiv:2310.06823,
-
[2]
Learning Confidence for Out-of-Distribution Detection in Neural Networks
DeVries, T. and Taylor, G. W. Learning confidence for out-of-distribution detection in neural networks.ArXiv Preprint ArXiv:1802.04865,
work page internal anchor Pith review Pith/arXiv arXiv
-
[3]
Fang, K., Tao, Q., He, M., Lv, K., Yang, R., Hu, H., Huang, X., Yang, J., and Cao, L. Kernel PCA for out- of-distribution detection: Non-linear kernel selections and approximations.ArXiv Preprint ArXiv:2505.15284,
-
[4]
Bias-Reduced Uncertainty Estimation for Deep Neural Classifiers
Geifman, Y ., Uziel, G., and El-Yaniv, R. Bias-reduced uncertainty estimation for deep neural classifiers.ArXiv Preprint ArXiv:1805.08206,
work page internal anchor Pith review Pith/arXiv arXiv
-
[5]
Gutbrod, M., Rauber, D., Nunes, D. W., and Palm, C. Open- MIBOOD: Open medical imaging benchmarks for out-of- distribution detection.ArXiv Preprint ArXiv:2503.16247,
-
[6]
A Baseline for Detecting Misclassified and Out-of-Distribution Examples in Neural Networks
Hendrycks, D. and Gimpel, K. A baseline for detecting misclassified and out-of-distribution examples in neural networks.ArXiv Preprint ArXiv:1610.02136,
work page internal anchor Pith review Pith/arXiv arXiv
-
[7]
Scaling out- of-distribution detection for real-world settings.ArXiv Preprint ArXiv:1911.11132,
9 A Systematic Analysis of Out-of-Distribution Detection Hendrycks, D., Basart, S., Mazeika, M., Zou, A., Kwon, J., Mostajabi, M., Steinhardt, J., and Song, D. Scaling out- of-distribution detection for real-world settings.ArXiv Preprint ArXiv:1911.11132,
-
[8]
Jaeger, P. F., L¨uth, C. T., Klein, L., and Bungert, T. J. A call to reflect on evaluation practices for failure detection in image classification.ArXiv Preprint ArXiv:2211.15259,
-
[9]
Liu, L. and Qin, Y . Fast decision boundary based out-of- distribution detector.ArXiv Preprint ArXiv:2312.11536,
-
[10]
Massey, J. L. Guessing and entropy. InProceedings Of 1994 IEEE International Symposium On Information Theory, pp
work page 1994
-
[11]
Ngoc-Hieu, N., Hung-Quang, N., Ta, T.-A., Nguyen-Tang, T., Doan, K. D., and Thanh-Tung, H. A cosine similarity- based method for out-of-distribution detection.ArXiv Preprint ArXiv:2306.14920,
-
[12]
Pope, Chen Zhu, Ahmed Abdelkader, Micah Goldblum, and Tom Goldstein
Pope, P., Zhu, C., Abdelkader, A., Goldblum, M., and Gold- stein, T. The intrinsic dimension of images and its impact on learning.ArXiv Preprint ArXiv:2104.08894,
-
[13]
Traub, J., Bungert, T. J., L ¨uth, C. T., Baumgartner, M., Maier-Hein, K. H., Maier-Hein, L., and Jaeger, P. F. Over- coming common flaws in the evaluation of selective clas- sification systems.ArXiv Preprint ArXiv:2407.01032,
-
[14]
OpenOOD v1.5: Enhanced Benchmark for Out -of- Distribution Detection,
Zhang, J., Yang, J., Wang, P., Wang, H., Lin, Y ., Zhang, H., Sun, Y ., Du, X., Li, Y ., Liu, Z., et al. Openood v1.5: Enhanced benchmark for out-of-distribution detection. ArXiv Preprint ArXiv:2306.09301,
-
[15]
Training Paradigms, CFS Baselines and Variations A.1
10 A Systematic Analysis of Out-of-Distribution Detection A. Training Paradigms, CFS Baselines and Variations A.1. Computing Infrastructure All experiments were executed on an internal GPU cluster.CNNruns (VGG-13 trained from scratch) were scheduled on NVIDIA T4 GPUs, whileViTruns (fine-tuned from a large pretrained model) were scheduled on NVIDIA A100 GP...
work page 2019
-
[16]
This leads to the loss LDG(W;D train, o) :=− 1 |Dtrain| P (xi,yi)∈Dtrain log o pyi(xi) +p K+1(xi) . When pK+1 =0 (no abstention), LDG reduces to cross-entropy up to an additive constant (since logo adds to the true-class 11 A Systematic Analysis of Out-of-Distribution Detection logit). The head is linear, g(z) =W z+b, W∈R (K+1)×D , b∈R K+1, so the method ...
work page 2019
-
[17]
and Deep Gamblers (Liu et al., 2019), ConfidNet (Corbi`ere et al., 2019; Corbiere et al.,
work page 2019
-
[18]
Prototype matching in feature space consists of quantifying the similarity between a sample x and the last-layer trained weights {w1, . . . ,wK}. Therefore the similarity to the closest trained weight is CTM(x) = max k≤C sim wk,h . Alternatively, we can compute class means µc train and score by similarity to the closest class mean, CTMmean(x) = maxk≤C sim...
work page 2023
-
[19]
Higher Energy score typically indicates higher uncertainty
The energy score is defined as Energy(x) =−Tlog PC k=1 exp g(h)k/T , with temperature T >0 . Higher Energy score typically indicates higher uncertainty. A.3.3. MAXIMUMSOFTMAXRESPONSE(MSR) (HENDRYCKS& GIMPEL, 2016)ANDMAXIMUMLOGITSCORE (MLS) (HENDRYCKS ET AL.,
work page 2016
-
[20]
Lower values indicate atypical inputs
A baseline confidence score given by the maximum predicted probabilityMSR(x) = maxk≤C pk, widely used for OOD detection. Lower values indicate atypical inputs. Similarly, MLS is a confidence score measured in the logit space, MLS(x) = maxk≤C g(h)k,often more stable than softmax under temperature changes. A.3.4. PREDICTIVEENTROPY(PE), GENERALIZEDENTROPY(GE...
work page 2019
-
[21]
of the predictive distributionPE(x) =H p(x) =− PC k=1 pk logp k,with larger entropy signaling higher uncertainty. Generalized Entropy (GEN) (Liu et al., 2023).GEN is a post-hoc OOD score that uses the softmax probabilities of a trained classifier. Let p(1) ≥ · · · ≥p (K) denote the probabilities sorted in descending order for a given input x. For sensitiv...
work page 2023
-
[22]
quantifies the expected number of guesses to identify the true class when labels are guessed in decreasing probability pk(x): if p(1) ≥ · · · ≥p (K) are sorted, then GE(x) = PC k=1 kp (k), with larger values denoting higher uncertainty. Predictive Collision Entropy (PCE) (Granese et al., 2021).PCE measures prediction uncertainty via thecollision (order-2 ...
work page 2021
-
[23]
This method is motivated by the Neural Collapse phenomena (Papyan et al., 2020), which unveils geometric properties that manifest at the end of the training process. NeCo’s new observation eatblishes ID/OOD orthogonality, which implies that OOD features concentrate near the origin after projection onto the ID subspace. This method fits PCA on ID features ...
work page 2020
-
[24]
with a polynomial kernel k(u,v) = (u ⊤v+c) d: \MMD 2 = 1 n(n−1) P i̸=i′ k(z i,z i′) + 1 m(m−1) P j̸=j ′ k(z ′ j,z ′ j′)− 2 nm P i,j k(z i,z ′ j). Both quantities are evaluated on CLIP embeddings;smallervalues indicate that DOOD is closer to the ID manifold. Class-aware distances.For ID class c∈ {1, . . . , K} , define the (normalized) image- prototype µc ...
work page 1957
-
[25]
kX j=1 ¯R 2 j −3N(k+ 1), (optionally applying a standard tie correction within blocks). For finite samples, the Iman–Davenport F -approximation is recommended (Iman & Davenport, 1980): FF = (N−1)Q N(k−1)−Q ∼F k−1,(k−1)(N−1) . IfF F exceeds the critical value at levelα, we rejectH 0 and proceed with post-hoc pairwise comparisons. Conover post-hoc & Bron–Ke...
work page 1980
-
[26]
6N , T ij = | ¯Ri − ¯Rj| SE , two-sided p-values are obtained from the normal (or t) reference, and multiplicity is controlled across all k 2 pairs using Holm’s step-down procedure (Holm, 1979). To summarize statistically indistinguishable winners, construct anindifference graph G= (V, E) with nodes V={1, . . . , k} (methods) and edges (i, j)∈E iff the ad...
-
[27]
For Figure 1, we only report the first layer for all the possible scenarios. CTM Confidence Energy GEN MSR fDBD CTM Confidence Energy GEN MSR fDBD 1.000 0.000 0.001 0.000 0.052 0.133 0.000 1.000 0.000 0.228 0.052 0.000 0.001 0.000 1.000 0.000 0.000 0.037 0.000 0.228 0.000 1.000 0.002 0.000 0.052 0.052 0.000 0.002 1.000 0.001 0.133 0.000 0.037 0.000 0.001 ...
work page 2020
-
[28]
In the other hand, Maximal Angular Margin dictates that class means form a Simplex ETF, maximizing the separation angle θij between any distinct classes i, j: cos(µi,µ j) =− 1 K−1 ∀i̸=j . This implies that the collapsed ID feature space is maximally sparse in terms of angular distribution. For an OOD sample xOOD lying in the subspace orthogonal to the ID ...
work page 1950
-
[29]
This uniformity prevents class-conditional bias, where some ID classes might otherwise have naturally higher energy (and thus higher False Positive Rates) than others due to varying feature norms. Equiangularity dictates that any pair of class means are equally spacedcosu(i, j) =β,∀i̸=j , meaning that for an off-target logitg(h) j =w ⊤ j h+b k ≈w ⊤ j µk =...
work page 2025
discussion (0)
Sign in with ORCID, Apple, or X to comment. Anyone can read and Pith papers without signing in.