REVIEW 3 major objections 4 minor 8 references
Transitions Between Cooperative and Crowding-Dominated Collective Motion in non-Jammed MDCK Monolayers
T0 review · 3 major / 4 minor · reviewed 2026-08-12 · deepseek-v4-flash
Pith's one-line read This paper reports that in non-jammed MDCK monolayers, cell migration speed can increase with cell packing density and with cell-cell cohesiveness in multiple regimes, showing that mechanical coupling can promote rather than suppress…
desk verdict A valuable experimental map with a solid density finding and a cohesion axis that needs calibration before the headline claim fully lands. read the letter →
The pith
A machine-rendered reading of the paper's core claim, the machinery that carries it, and where it could break.
The reading
What carries the argument
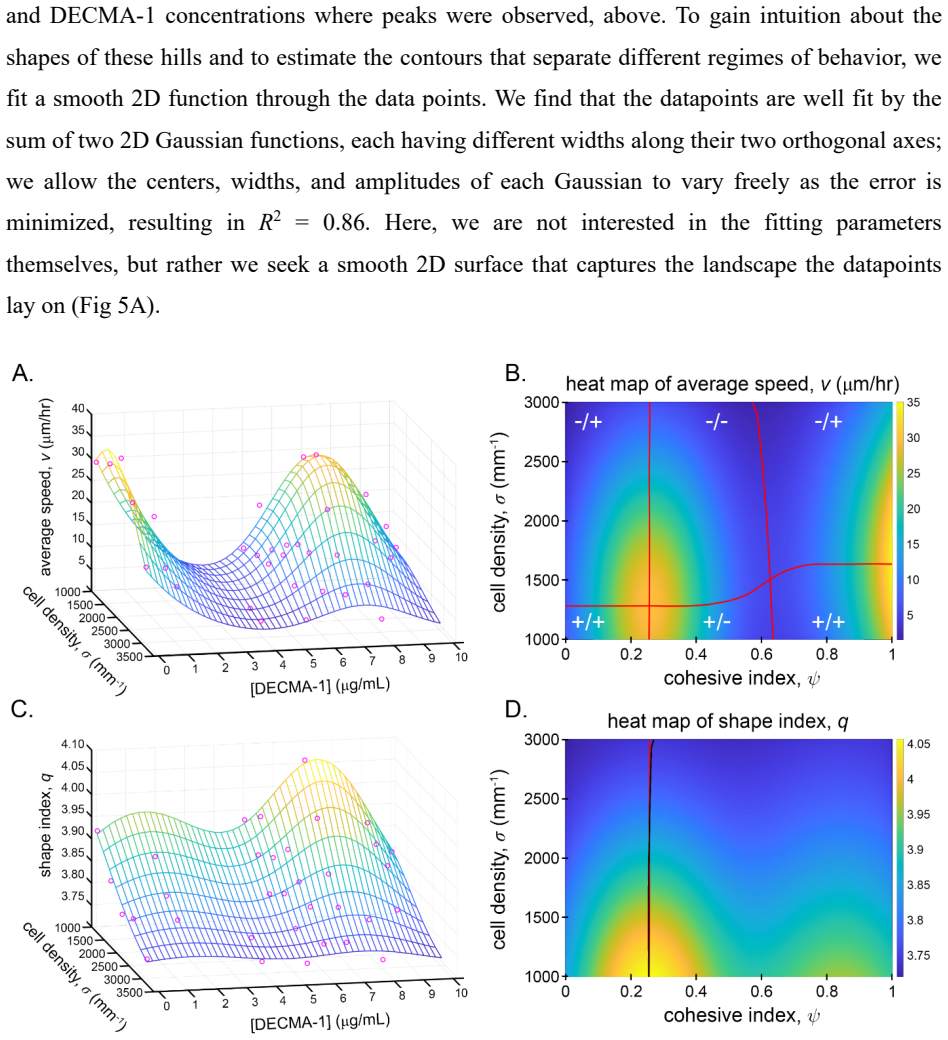
The argument is carried by a two-dimensional phenomenological landscape: average migration speed v(ψ,σ) built from particle-image-velocimetry flow fields, with cell density σ and shape index q measured by image segmentation, and cell-cell cohesion parameterized by the DECMA-1 concentration mapped to a cohesive index ψ = (c_max–c)/c_max. The speed data are fit as the sum of two independent 2D Gaussian hills, and the boundaries between regimes are found by computing the gradient of the fitted surface. A second fitted landscape for the shape index q(ψ,σ) is used to test whether shape changes accompany the speed transitions. The nearly universal instantaneous anticorrelation between q and σ (≈ −0.88 across conditions) supplies the geometric baseline against which the speed landscape is read.
What would settle it
Re-plot the speed landscape against directly measured cell-cell adhesion strengths, not antibody concentration, using a technique such as dual-pipette aspiration or adhesion-frequency assays across the same ten concentrations, and check whether the two speed hills and the four regimes persist when adhesion is the horizontal axis.This would settle whether the non-monotonic cohesion dependence is truly an adhesion effect.
Extended reading notes
Core claim
The central claim is that the relationship between collective cell motion and mechanical coupling is non-monotonic: at low densities and at both high and low extremes of cell cohesiveness, migration speed increases with increasing density or cohesion, while at intermediate cohesion or high density it decreases. By fitting the measured speed as a smooth surface v(ψ,σ) over the cohesive index ψ = (c_max–c)/c_max and cell density σ, the authors identify two hills separated by a sigmoidal boundary. On the low-density side of the boundary, speed rises with density; on the high-density side, crowding dominates. Along the cohesion axis, speed falls and then rises again, producing a local minimum at intermediate ψ. The shape-index landscape q(ψ,σ) mirrors the low-cohesion hill, and the boundary in v–q space extrapolates to v=0 at q=3.81, the vertex-model rigidity point, even though the cells remain in a fluid-like state.
Load-bearing premise
The cohesion axis is built entirely on the assumption that increasing DECMA-1 concentration steadily reduces cell-cell adhesion; the authors state that blocking E-cadherin may produce indirect responses in the monolayer, and they have no direct measurement of adhesion levels.
Editorial extensions
If this is right
- If the landscape is correct, the usual reading of increased cell density or adhesion as a universal brake on monolayer motion must be revised to a regime-dependent view, with consequences for wound healing and tissue development.
- The boundary separating cooperative from crowding-dominated motion shifts with cohesion, so a single critical cell density or aspect ratio cannot fully characterize the transition.
- The extrapolation of the fluid-regime boundary to q = 3.81 ties the empirical observations to a geometric rigidity threshold, but places it inside the fluid state, suggesting a pre-jamming transition that models should reproduce.
- The near-universal q–σ anticorrelation gives experimenters a single readout that indicates where a monolayer sits on the density axis regardless of cohesion.
Reading between the lines
- A direct test of the mechanical-stimulation mechanism would be to measure velocity-velocity correlation functions and traction forces in the high-cohesion, low-density regime; if the speed rise is caused by out-of-phase contractions, the correlation length should grow with density in exactly that regime.
- The paper's own caveat about DECMA-1 leaves open the possibility that the apparent reentrant cohesion dependence reflects signaling or proliferation changes rather than adhesion per se; separating those channels would require a different way to reduce adhesion, such as genetic knockdown.
- If the landscape generalizes, therapies that modulate cell adhesion (for example, in cancer) could either speed or slow collective invasion depending on where the tissue sits on the density–cohesion plane, so a single directional prediction may be impossible.
Signed reviews
Editorial analysis
A structured set of objections, weighed in public.
Referee Report
Summary. This paper presents time-lapse experiments on non-jammed MDCK monolayer islands in which cell density, migration speed, and cell shape index are measured at ten DECMA-1 concentrations. The authors report three main observations: (i) a strong instantaneous anticorrelation between shape index q and cell density σ (mean extremum −0.88 ± 0.14 over 15 experiments); (ii) at unmodified cohesion, speed rises with density at low densities and falls at high densities; and (iii) a two-Gaussian fit to the speed versus density and cohesion plane, with cohesion encoded as ψ = (cmax−c)/cmax, yields four regimes in which speed increases or decreases with density crossed with speed increases or decreases with ψ. The authors interpret the low-density and high-ψ increasing branches as evidence of cooperative, mechanically stimulated motion, and they note that the transition contour extrapolates to q = 3.81, the vertex-model rigidity point.
Significance. If the cohesion axis were properly calibrated, the central observation—that cell migration speed can increase with packing density and with cell-cell cohesion in non-jammed monolayers—would run counter to the crowding-dominated picture and could be relevant to interpreting transitions in development and disease. The q-σ anticorrelation is robust and extends prior glassy-dynamics results across a broader parameter space. The paper also has concrete strengths: control measurements for PIV and segmentation, raw time traces with replicate means, and an explicit acknowledgment in Section 3 of the DECMA-1 calibration limitation. The main weaknesses are that the 'cohesiveness' axis is an unvalidated linear rescaling of antibody concentration and that the quantitative regime boundaries come from freely fitted surfaces without uncertainty propagation. These weaknesses directly affect the cohesion-based half of the headline claim.
major comments (3)
- [Sections 2.3 and 3; Fig. 5B] The cohesive index ψ is defined as a linear rescaling of DECMA-1 concentration, ψ = (cmax−c)/cmax, with no direct measurement that DECMA-1 monotonically reduces cell-cell adhesion over 0–10 µg/mL. The authors explicitly acknowledge in Section 3 that 'blocking E-cadherin may produce indirect responses in the monolayer, and that it is preferable to connect DECMA-1 concentration to a quantitative level of cell-cell cohesion through direct measurement.' Because the high-cohesiveness branch (v increasing with ψ near ψ = 1) is anchored solely by untreated c = 0 data, off-target effects of DECMA-1 on proliferation, signaling, or substrate adhesion, or a non-monotonic dose-response, could change the sign of the v-ψ slope and the claimed reentrant topology. Please provide a direct calibration of junctional adhesion or, failing that, restrict the claims to the measured variable 'DECMA-1 concentration' and soften the 'cell cohesiveness' language throughout.
- [Section 2.3; Fig. 5A/C] The regime boundaries are derived from the gradient of a sum of two 2D Gaussians with freely varying centers, widths, and amplitudes, but the paper reports only R² values and no parameter uncertainties, cross-validation, or sensitivity of the ridge/valley contours to the fitting basis. With seven of the ten DECMA-1 concentrations represented by a single experiment, the double-Gaussian decomposition is not shown to be unique, and a differently parameterized surface could change the location or even the existence of the valley between the two hills. Please provide bootstrap or leave-one-out analyses that yield confidence intervals on the contours, report the number of fitted parameters, and show residual diagnostics.
- [Sections 2.2 and 2.3; Fig. 4C and Fig. 5] Only DECMA-1 concentrations 0, 5, and 7 µg/mL have triplicate experiments; the remaining seven concentrations are single measurements. The reentrant shape of v(ψ) at fixed σ—specifically the local minimum and the second maximum—is determined by these unreplicated points, so a single outlier could alter the apparent topology. Please mark single-replicate points in the scatterplots and test whether the four-regime classification survives omission of any one unreplicated concentration; at minimum, state explicitly which features are supported by replicate data.
minor comments (4)
- [Section 2.3, first paragraph] The sentence 'A scatterplot of the v datapoints in the σ-c plane shows that the data form two hills centered around the densities and DECMA-1 concentrations where peaks were observed, above' is a fragment ending in 'above'; please rephrase and reference Fig. 5A explicitly.
- [Section 2.1] The equation formatting for q(t) and σ(t) is garbled in the manuscript text; please ensure the definitions p_j/A_j and 1/A_j are typeset correctly and that the angle-bracket averaging is defined for all three variables.
- [References] The reference list contains inconsistent journal capitalization, for example 'Nature reviews Molecular cell biology' and 'Physical Review E—Statistical, Nonlinear, and Soft Matter Physics'; please normalize all journal names to their standard styles.
- [Fig. S4] The claim that a best-fit line to the q-v contour terminates at (v=0, q=3.81) should report the fit range, the number of points, and the confidence interval on the intercept; the current text extrapolates beyond the data and does not give uncertainty.
Circularity Check
No significant circularity; the results are direct measurements with descriptive fitting and an external vertex-model comparison.
full rationale
The paper's central claims are direct experimental measurements: migration speed, cell density, shape index, and DECMA-1 concentration are all measured independently, and the relationships (v–σ, v–c, q–σ) are presented as raw parametric plots before any fitting. The two-Gaussian fit in Section 2.3 is explicitly a smoothing and visualization device: the authors state, "we are not interested in the fitting parameters themselves, but rather we seek a smooth 2D surface that captures the landscape the datapoints lay on." The regime boundaries are therefore summaries of the data, not outputs derived from the inputs by construction. The cohesive index ψ = (cmax − c)/cmax is a linear rescaling of the experimentally controlled DECMA-1 concentration, and the paper openly identifies DECMA-1 concentration as a proxy: "Here we used the concentration of DECMA-1 as a metric of cell-cell cohesiveness," while acknowledging that direct measurement of cohesion would be preferable. This is a validity limitation, not a circular definition. The comparison to the vertex-model rigidity transition at q = 3.81 is an external, independent theoretical prediction (ref. 10, Bi et al.), and the authors explicitly note that their boundary differs from that transition. Self-citations (refs 2, 11–13) provide background on monolayer dynamics and density fluctuations; they are not used to define the measured quantities or to justify the central claim. No equation defines a predicted quantity in terms of the same quantity being explained, and no fitted parameter is renamed as a prediction. The paper is self-contained against empirical benchmarks, and no significant circularity is present.
Assumptions & free parameters
free parameters (3)
- 2D Gaussian fit parameters for v(psi,sigma) =
2 amplitudes, 2 centers, 2 width pairs, freely varied; R^2=0.86
- 2D Gaussian fit parameters for q(psi,sigma) =
freely varied; R^2=0.95
- Best-fit line to the v-q transition contour =
slope and intercept fit to contour points, extrapolated to v=0
assumptions (4)
- domain assumption DECMA-1 concentration monotonically maps to cell-cell cohesiveness
- domain assumption The measured monolayers are in a non-jammed, fluid-like state
- domain assumption PIV and Cellpose segmentation faithfully capture cell velocity and shape
- domain assumption Spatial averages of v, q, and sigma are sufficient to characterize monolayer dynamics
Cite this review
Pith. "Pith review of Transitions Between Cooperative and Crowding-Dominated Collective Motion in non-Jammed MDCK Monolayers." pith.science (2026). https://pith.science/paper/TFEEW2RA
@misc{pith2026241112515,
  author       = {Pith},
  title        = {Pith review of: Transitions Between Cooperative and Crowding-Dominated Collective Motion in non-Jammed MDCK Monolayers},
  year         = {2026},
  howpublished = {\url{https://pith.science/paper/TFEEW2RA}},
  note         = {Machine review of arXiv:2411.12515}
}
read the original abstract
Transitions between solid-like and fluid-like states in living tissues have been found in steps of embryonic development and in stages of disease progression. Our current understanding of these transitions has been guided by experimental and theoretical investigations focused on how motion becomes arrested with increased mechanical coupling between cells, typically as a function of packing density or cell cohesiveness. However, cells actively respond to externally applied forces by contracting after a time delay, so it is possible that at some packing densities or levels of cell cohesiveness, mechanical coupling stimulates cell motion instead of suppressing it. Here we report our findings that at low densities and within multiple ranges of cell cohesiveness, cell migration speeds increase with these measures of mechanical coupling. Our observations run counter to our intuition that cell motion will be suppressed by increasingly packing or sticking cells together and may provide new insight into biological processes involving motion in dense cell populations.
Figures


Figures from the paper (2 more)

Reference graph
Works this paper leans on
-
[1]
Introduction The diversity of studies focusing on how cells move in condensed populations are often motivated by the long-standing recognition that collective cell motion plays a critical role in tissue development, health, and disease 1. Early investigations of migration velocity fields within confluent cell islands uncovered connections to glassy -dynam...
-
[2]
+/+”; (2) increasing v along σ and decreasing v along ψ, denoted as “+/–
Results and Discussion Previous work on jamming and glassy dynamics in cell monolayers demonstrated that crowding effects dominate cell motion at the higher end of cell densities. Thus, we expected that if a regime of motion dominated by cell- cell mechanical stimulation exists, it will be found at low cell densities, far below the jammed state, where the...
-
[3]
We were motivated by two major historical threads of thought in the broad field of cell mechanics
Conclusion Here we have investigated how cell density and cell -cell cohesiveness influence cell motion in monolayers, seeking to identify regimes where these parameters serve to either promote or suppress cell motion. We were motivated by two major historical threads of thought in the broad field of cell mechanics. First, the foundational ideas about how...
-
[4]
Materials and Methods 4.1 Cell culture and cell island seeding Madin Darby canine kidney (MDCK) epithelial cells are cultured in Dulbecco’s modified Eagle’s medium (DMEM) supplemented with 10% fetal bovine serum (FBS) and 1% penicillin streptomycin, maintained at 37 °C in a 5% CO 2 atmosphere. To prepare cell islands for experiments, the cells are grown t...
-
[5]
Acknowledgements This material is based upon work supported by the National Science Foundation under Grant Number 2104429
-
[6]
References 1 Friedl, P . & Gilmour, D. Collective cell migration in morphogenesis, regeneration and cancer. Nature reviews Molecular cell biology 10, 445-457 (2009). 2 Angelini, T. E. et al. Glass-like dynamics of collective cell migration. Proceedings of the National Academy of Sciences 108, 4714-4719 (2011). 18 3 Tambe, D. T. et al. Collective cell guid...
work page 2009
-
[16]
For example, simultaneous measurements of cytoskeletal elasticity and cell traction forces , complemented by studies of in vitro actin networks, showed that cell stiffness was controlled by motor -driven pre -stress in the cytoskeleton 17,18. Completing this mechanical feedback loop, it was shown that the stiffness of the cell’s substrate can modulate cyt...
-
[25]
While the EMT and MET have recently been thought of as transitions between fluid and solid states 26-28, our results show that a second transition could occur even within the fluid -like state and provide guidance on how to drive cells toward or away from a jammed state. The hilly landscapes of migration speed and shape index on the cohesiveness - 16 dens...
Reviewed August 12, 2026 · model on record in the stance chip above.
Discussion (0). Continue with ORCID to comment.