REVIEW 4 major objections 5 minor 39 references
A neural network for estimating compact binary coalescence parameters of gravitational-wave events in real time
T0 review · 4 major / 5 minor · reviewed 2026-08-07 · deepseek-v4-flash
Pith's one-line read A quantile-regression neural network trained on search-pipeline outputs provides real-time confidence intervals for the chirp mass, mass ratio, and total mass of gravitational-wave candidates, with reported coverage above 90%.
desk verdict Sensible quantile-regression NN for pipeline-conditioned CBC parameter bounds, but the 'over 90%' and '9% speedup' headlines are both softer than the abstract claims and need a revision before publication. read the letter →
The pith
A machine-rendered reading of the paper's core claim, the machinery that carries it, and where it could break.
The reading
What carries the argument
The central object is a quantile-regression neural network, a network trained with the pinball (quantile) loss so that each output node estimates a conditional quantile of the target parameter rather than a point value. A soft-sort layer orders the outputs before the final transform, preventing quantile crossing and guaranteeing that the resulting intervals are nested. Separate networks are trained for each of the three parameters and for each of four chirp-mass bins, with a sigmoid or exponential final activation to keep mass ratios and masses in physical ranges. These networks map pipeline-recovered (biased) values into uncertainty bands that widen when the pipeline errors grow, as the input signal-to-noise ratio and chirp mass change.
What would settle it
A confirmed event whose true chirp mass lies above the 60-solar-mass training limit, and for which the neural-network interval misses the true value, would directly contradict the coverage claim; the highest-mass event in the catalog already does this. A broader test would run the trained network on a large set of alerts from the current observing run and check whether its intervals contain the median of the full parameter-estimation posterior in at least 90% of cases.
Extended reading notes
Core claim
The paper's central claim is that a fully connected quantile-regression neural network, fed with the detector-frame quantities an online search pipeline uses to describe a candidate event (the two component masses, the aligned spins, and the signal-to-noise ratio), can output calibrated confidence intervals for the chirp mass, mass ratio, and total mass of the source. The intervals are built from two sorted quantiles chosen to meet a target accuracy, typically 96%. The authors report that these intervals contain the true injected parameter for more than 90% of events on the O2 test set, on an O3 mock-data replay set, and on real catalog events, with the single exception of the very high-mass event whose true chirp mass lies outside the training range. They further report that when the neural-network intervals are used as priors for low-latency Bayesian parameter estimation, the number of likelihood evaluations drops by roughly 9% while the sky localization quality is unchanged.
Load-bearing premise
The entire scheme rests on the assumption that the bias patterns learned from one detector network's search pipeline, using simulated signals with chirp masses up to about 60 solar masses, still describe other pipelines, other noise conditions, and more massive real events.
Editorial extensions
If this is right
- Low-latency alerts can carry dynamic uncertainty intervals for chirp mass, mass ratio, and total mass within seconds of a detection, rather than a single point estimate.
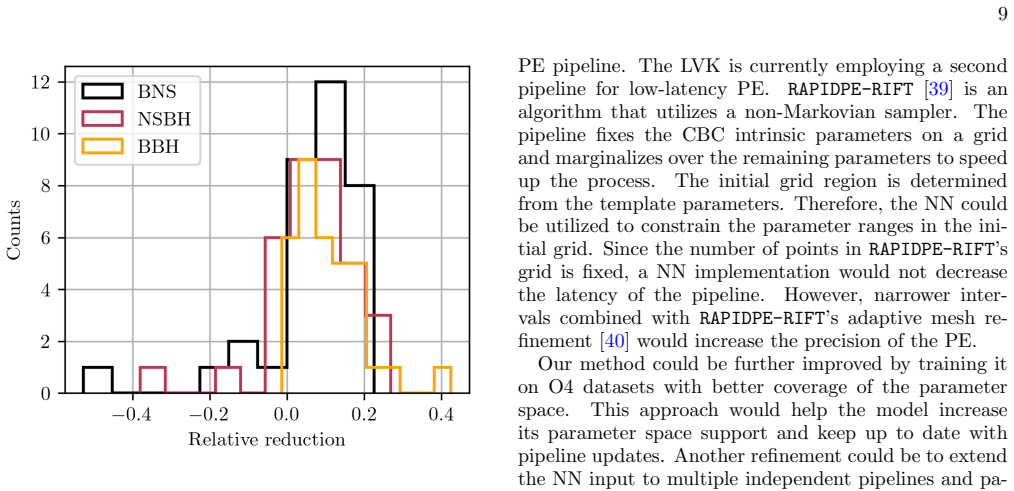
- Using these intervals as priors in low-latency Bayesian parameter estimation reduces the number of likelihood evaluations by about 9%, shortening run times.
- Sky localization quality is unaffected when the neural-network priors replace the default prior bounds in low-latency parameter estimation.
- A model trained on one observing run transfers to another pipeline's mock-data challenge and to real catalog events, as long as the true parameters lie inside the training support.
- The interval widths adapt to pipeline bias, for example by extending the upper bound in the high-chirp-mass region where pipelines systematically underestimate the true value.
Reading between the lines
- Retraining the network on data from the current observing run, with wider mass coverage and multiple pipelines as inputs, could plausibly restore above-90% coverage for the highest-mass events and track future template-bank changes.
- The same quantile-regression architecture could be applied to other pipeline outputs, such as luminosity distance or spins, and to grid-based rapid parameter-estimation codes instead of nested sampling.
- A direct wall-clock comparison of an online parameter-estimation run with and without the neural-network priors would show whether the 9% reduction in likelihood evaluations translates into a meaningful speedup for real alerts.
- The over-90% coverage claim could be tested live by running the network on public alerts from the current observing run and comparing its intervals with the posteriors from full parameter estimation.
Editorial analysis
A structured set of objections, weighed in public.
Referee Report
Summary. The paper presents a quantile-regression neural network that takes low-latency pipeline outputs (chirp mass, mass ratio, total mass, spins, SNR) and returns dynamic confidence intervals for the intrinsic parameters Mc, q, and Mtot. The method is trained on O2 GstLAL pipeline outputs and tested on held-out O2 data, an O3 replay Mock Data Challenge set, a synthetic mass-space scan, and events from GWTC. The authors report interval accuracies 'consistently over 90%' on all datasets, and they investigate using the NN intervals as bounded priors for low-latency Bilby parameter estimation, reporting a ~9% median reduction in likelihood evaluations while sky localization remains consistent with the default configuration.
Significance. If the claims survive revision, the paper offers a practically useful tool: it converts cheap pipeline point estimates into calibrated dynamic bounds on intrinsic parameters, which could inform electromagnetic follow-up and accelerate low-latency parameter estimation. The design is reasonable—quantile regression with a sorted output layer is a sensible way to produce non-crossing intervals—and the evaluation spans multiple independent datasets, including held-out O2 and O3 MDC data and real GWTC events. The paper also explicitly checks that the NN-prior sky maps are consistent with default sky maps. The main advertised quantitative claims, however, are not currently demonstrated as stated: the 'over 90%' accuracy claim is contradicted by the paper's own Table III for the mass ratio, and the '9% reduction' is confounded by a simultaneous change of likelihood approximation. These are correctable issues, but they are load-bearing for the abstract and conclusions.
major comments (4)
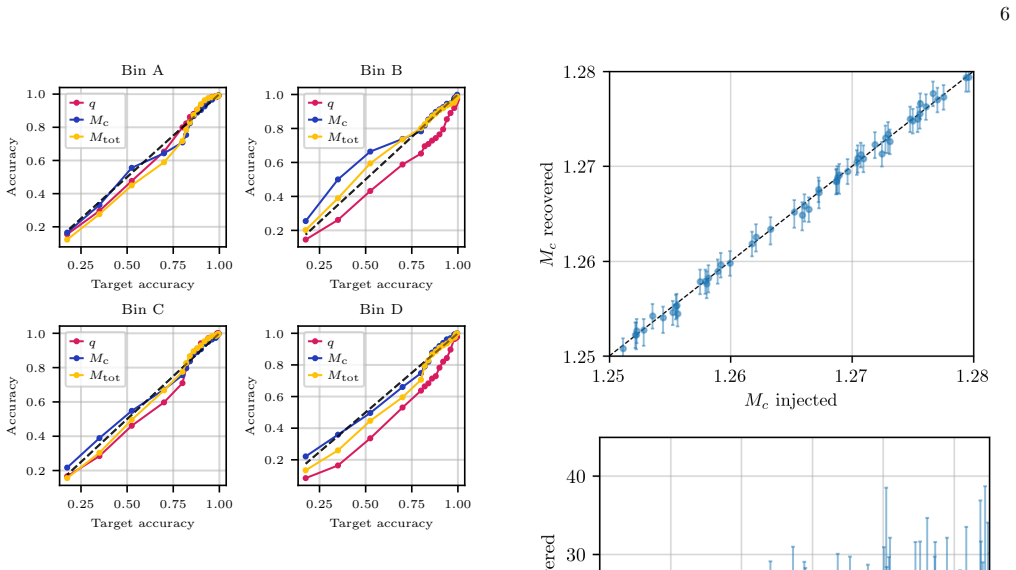
- [Abstract and Table III] The statement that 'the model accuracy is consistently over 90% across all the datasets' is not supported by the paper's own results. In Table III, the O3 MDC mass-ratio accuracy is 0.891 for Bin B and 0.897 for Bin D, both below 90%. The O2 results in Table II are all above 90%, but the O3 MDC mass-ratio results are not. The abstract and Section VIII should be rewritten to say that most parameter/bin combinations exceed 90% coverage, with the mass ratio on the O3 MDC set being the known exception, or the model should be recalibrated so that the stated claim matches the reported numbers.
- [Section VII and Figure 9] The claim that NN priors 'reduce by 9% the number of likelihood evaluations' is confounded because two variables change between the two configurations. The text states that 'the low-latency ROQ method is incompatible with the dynamical chirp mass intervals provided by the NN' and that relative binning is therefore used for the NN-prior runs, while the default low-latency Bilby runs use ROQ. The observed median reductions of 0.10, 0.07, and 0.09 in Figure 9 could therefore be due to the difference in likelihood approximation rather than the narrower priors. To support the claim, the comparison should hold the likelihood fixed—for example, run both default and NN-prior cases with the same relative-binning likelihood, or the same ROQ setup when possible—and should report per-event scatter and the number of events used for each median.
- [Section V] The synthetic dataset is introduced as a way to test the NN on the full mass parameter space, but the section reports only interval widths (Figures 7 and 8) and does not report coverage accuracy on this dataset. Without an accuracy metric against the injected values, the 'full-mass-space' behavior of the method is not actually assessed. The section should either compute and report the fraction of intervals containing the true injected parameters or be explicitly relabeled as a width-only study, so that the generalization claim is not overstated.
- [Section VI and GW190521] The GWTC evaluation is presented as supporting the general accuracy claim, but the largest-mass event, GW190521 030229 with catalog chirp mass ~101 Msun, falls outside the NN intervals, and the paper correctly attributes this to the O2 training support cut at ~60 Msun. This limitation is a real restriction on the claim 'consistently over 90% across all datasets': the high-mass tail is never validated because the O3 MDC evaluation is explicitly restricted to O2 parameter bounds. The limitation should be stated in the abstract or conclusions, and the claim should be scoped accordingly.
minor comments (5)
- [Section II / Figures 11-13 captions] The text and figure captions refer to 'GStLAL' in several places; the name of the pipeline is 'GstLAL' and should be spelled consistently.
- [Table IV] The 'GWTC' column entries such as '2.1' and '3' are not explained in the table caption; the authors should state explicitly that these denote GWTC-2.1 and GWTC-3, respectively.
- [Section II] The sentence 'This produces a total of twelve sets' would be clearer if it said 'four bins x three parameters (Mc, q, Mtot), giving twelve independently trained models.'
- [Section II / Table I] The text notes that the O3 MDC set is reduced to 594, 604, 668, and 262 injections in bins A-D after imposing O2 bounds, but Table I lists only the unrestricted MDC counts; including both counts would avoid ambiguity about which sample is used in Tables II-III.
- [Section IV] The sentence 'In spite of this, Fig. 5 and table III confirm that the NN models perform similarly on the O3 set as they do on O2' is too strong given the mass-ratio accuracies of 0.891 and 0.897 in bins B and D; the wording should reflect the quantitative differences.
Circularity Check
No circularity found: the NN coverage claims are evaluated on held-out and external datasets, and the PE speedup is an empirical comparison, not a quantity fixed by construction.
full rationale
The paper's central derivation chain is an empirical supervised-learning pipeline: a quantile-regression NN is trained on O2 GstLAL inputs (x = recovered template parameters) to predict intervals for injected Mc, q, and Mtot. The accuracy metric (fraction of injected values inside the predicted interval) is computed on a held-out 20% test split and on the external O3 replay MDC restricted to O2 bounds, so the above-90% coverage claim is a genuine out-of-sample evaluation rather than a tautology. The PE application in Section VII compares NN-prior Bilby runs with default-prior runs on MDC events and reports a 9% median reduction in likelihood evaluations; this is an observed result, not a fitted parameter renamed as a prediction. The reuse of the authors' own PNAS dataset [10] and the self-citation to [20] are dataset and method provenance citations, not load-bearing arguments, and no uniqueness theorem or ansatz is imported from those papers. The paper itself notes that GW190521 falls outside the training chirp-mass support, and Table III shows mass-ratio accuracies of 0.891 and 0.897 on the O3 MDC set, contradicting the abstract's blanket 'over 90%' wording; these are correctness and scope issues, not circularity. The Section VII comparison is also partly confounded by the switch to relative binning because ROQ is incompatible with the NN's dynamic intervals, but that confound does not make the claim equivalent to its inputs. Overall, no step in the derivation reduces by definition or by self-citation to its own inputs.
Assumptions & free parameters
free parameters (6)
- Neural network weights (12 models, roughly 10^3 parameters each)
- Bin boundaries for chirp mass =
[0, 1.465, 2.234, 12, infinity) solar masses
- Target accuracy for interval construction =
96% (98.8% for q in PE runs)
- Quantile set =
37 quantiles, denser at edges
- Training hyperparameters =
LR 5e-3 for Mc/Mtot and 5e-2 for q, dropout 0.25, hidden 24x12, epochs 100, batch 400
- MDC parameter-space restriction =
Values within O2 bounds only
assumptions (5)
- domain assumption The pipeline-recovered parameter vector x is sufficiently informative to predict the true source parameters, and the relationship learned on O2 GstLAL outputs transfers to other pipelines and datasets.
- standard math Quantile loss minimization yields correctly calibrated conditional quantiles.
- standard math Injected parameters in the training and test catalogs are the ground truth for evaluating coverage.
- domain assumption The default bilby low-latency configuration is a fair baseline for comparing likelihood evaluation counts.
- domain assumption The synthetic dataset inputs are representative of pipeline recovery, rather than the true parameters.
Cite this review
Pith. "Pith review of A neural network for estimating compact binary coalescence parameters of gravitational-wave events in real time." pith.science (2026). https://pith.science/paper/TIRQXXAL
@misc{pith2026250518311,
  author       = {Pith},
  title        = {Pith review of: A neural network for estimating compact binary coalescence parameters of gravitational-wave events in real time},
  year         = {2026},
  howpublished = {\url{https://pith.science/paper/TIRQXXAL}},
  note         = {Machine review of arXiv:2505.18311}
}
read the original abstract
Low-latency pipelines analyzing gravitational waves from compact binary coalescence events rely on matched filter techniques. Limitations in template banks and waveform modeling, as well as non-stationary detector noise cause errors in signal parameter recovery, especially for events with high chirp masses. We present a quantile regression neural network model that provides dynamic bounds on key parameters such as chirp mass, mass ratio, and total mass. We test the model on various synthetic datasets and real events from the LIGO-Virgo-KAGRA gravitational-wave transient GTWC-3 catalog. We find that the model accuracy is consistently over 90% across all the datasets. We explore the possibility of employing the neural network bounds as priors in online parameter estimation. We find that they reduce by 9% the number of likelihood evaluations. This approach may shorten parameter estimation run times without affecting sky localizations.
Figures


Figures from the paper (9 more)




Reference graph
Works this paper leans on
-
[1]
Figure 7 shows the NN interval width with 96% target accuracy
As we are mainly interested in assessing the perfor- mance on the chirp mass and the mass ratio, we set the z−spin components χz 1, χz 2 to zero and fix the SNR to 10, 15, 20, and 25. Figure 7 shows the NN interval width with 96% target accuracy. Overall, in each bin the in- terval width decreases as q increases. The width also generally increases with Mc...
-
[2]
B. P. Abbott et al.(L V), Phys. Rev. X9, 031040 (2019)
work page 2019
-
[3]
R. Abbott et al. (LIGO Scientific Collaboration and Virgo Collaboration), Phys. Rev. X 11, 021053 (2021)
work page 2021
-
[4]
Abbott et al.(L VK), (2021), arXiv:2111.03606 [gr-qc]
R. Abbott et al.(L VK), (2021), arXiv:2111.03606 [gr-qc]
arXiv 2021
-
[5]
https://observing.docs.ligo.org/plan
-
[6]
https://gracedb.ligo.org/superevents/public/O4/. 10 FIG. 10. Skymap statistics for the selected MDC events. Lef t: Cumulative searched area plots for the selected MDC events. Right PP-plot showing the skymap statistics for the selected MDC events. The credible intervals shown in gray are based on the total number of events
-
[7]
Ewing et al., (2023), arXiv:2305.05625 [gr-qc]
B. Ewing et al., (2023), arXiv:2305.05625 [gr-qc]
arXiv 2023
-
[8]
T. Dal Canton, A. H. Nitz, B. Gadre, G. S. Cabourn Davies, V. Villa-Ortega, T. Dent, I. Harry, and L. Xiao, Astrophys. J. 923, 254 (2021), arXiv:2008.07494 [astro-ph.HE]
arXiv 2021
Show all 39 references
-
[9]
Aubin et al., Class
F. Aubin et al., Class. Quant. Grav. 38, 095004 (2021), arXiv:2012.11512 [gr-qc]
2021 arXiv
-
[10]
Q. Chu, M. Kovalam, L. Wen, T. Slaven-Blair, J. Bosveld, Y. Chen, P. Clearwater, A. Codoreanu, Z. Du, X. Guo, X. Guo, K. Kim, T. G. F. Li, V. Oloworaran, F. Panther, J. Powell, A. S. Sengupta, K. Wette, and X. Zhu, (2021), arXiv:2011.06787 [gr-qc]
2021 arXiv
-
[11]
Sharma Chaudhary et al., Proceedings of the Na- tional Academy of Sciences 121, e2316474121 (2024), https://www.pnas.org/doi/pdf/10.1073/pnas.2316474121
S. Sharma Chaudhary et al., Proceedings of the Na- tional Academy of Sciences 121, e2316474121 (2024), https://www.pnas.org/doi/pdf/10.1073/pnas.2316474121
2024 doi
-
[12]
Allen, W
B. Allen, W. G. Anderson, P. R. Brady, D. A. Brown, and J. D. E. Creighton, Phys. Rev. D 85, 122006 (2012)
2012
-
[13]
Cannon, R
K. Cannon, R. Cariou, A. Chapman, M. Crispin-Ortuzar, N. Fotopoulos, M. Frei, C. Hanna, E. Kara, D. Keppel, L. Liao, S. Privitera, A. Searle, L. Singer, and A. Wein- stein, The Astrophysical Journal 748, 136 (2012)
2012
-
[14]
Template bank for compact binary merg- ers in the fourth observing run of Advanced LIGO, Ad- vanced Virgo, and KAGRA,
S. Sakon et al., “Template bank for compact binary merg- ers in the fourth observing run of Advanced LIGO, Ad- vanced Virgo, and KAGRA,” (2022), arXiv:2211.16674 [gr-qc]
2022 arXiv
-
[15]
Messick et al., Phys
C. Messick et al., Phys. Rev. D 95, 042001 (2017), arXiv:1604.04324 [astro-ph.IM]
2017 arXiv
- [16]
-
[17]
Chatterjee, S
D. Chatterjee, S. Ghosh, P. R. Brady, S. J. Kapadia, A. L. Miller, S. Nissanke, and F. Pannarale, The Astrophysical Journal 896, 54 (2020)
2020
-
[18]
Baird, S
E. Baird, S. Fairhurst, M. Hannam, and P. Murphy, Phys. Rev. D 87, 024035 (2013)
2013
-
[19]
Capano, I
C. Capano, I. Harry, S. Privitera, and A. Buonanno, Phys. Rev. D 93, 124007 (2016)
2016
-
[20]
Margalit and B
B. Margalit and B. D. Metzger, The Astrophysical Jour- nal Letters 880, L15 (2019)
2019
-
[21]
Berbel, M
M. Berbel, M. Miravet-Ten´ es, S. S. Chaudhary, S. Al- banesi, M. Cavagli` a, L. M. Zertuche, D. Tseneklidou, Y. Zheng, M. W. Coughlin, and A. Toivonen, Classi- cal and Quantum Gravity 41, 085012 (2024)
2024
-
[22]
Bassett, Jr., and R
G. Bassett, Jr., and R. Koenker, Econometrica 46, 33 (1978)
1978
-
[25]
thesis, University of Wisconsin-Milwaukee (2024)
CaitlinRose, Rapid Parameter Estimation of Compact Binary Coalescences with Gravitational Waves, Ph.D. thesis, University of Wisconsin-Milwaukee (2024)
2024
-
[26]
Q. Xu, K. Deng, C. Jiang, F. Sun, and X. Huang, Expert Systems with Applications 76, 129 (2017)
2017
-
[27]
A. J. Cannon, Computers & Geosciences 37, 1277 (2011)
2011
-
[28]
J. Ansel et al., in Proceedings of the 29th ACM Interna- tional Conference on Architectural Support for Program- ming Languages and Operating Systems, Volume 2 (AS- PLOS ’24) (ACM, 2024)
2024
-
[29]
PyTorch documentation,
T. P. Foundation, “PyTorch documentation,” https: //pytorch.org/docs/stable/index.html (2025), [Ac- cessed 05-05-2025]
2025
-
[30]
Rectifier nonlinearities improve neural net- work acoustic models,
A. L. Maas, “Rectifier nonlinearities improve neural net- work acoustic models,” (2013)
2013
-
[31]
Blondel, O
M. Blondel, O. Teboul, Q. Berthet, and J. Djolonga, in Proceedings of the 37th International Conference on Machine Learning, Proceedings of Machine Learning Re- search, Vol. 119, edited by H. D. III and A. Singh (PMLR, 11
-
[32]
Adam: A method for stochastic optimization,
D. P. Kingma and J. Ba, “Adam: A method for stochastic optimization,” (2017), arXiv:1412.6980 [cs.LG]
2017 arXiv
-
[33]
Abbott et al., Phys
R. Abbott et al., Phys. Rev. D 109, 022001 (2024), arXiv:2108.01045 [gr-qc]
2024 arXiv
-
[34]
Ashton, M
G. Ashton, M. H¨ ubner, P. D. Lasky, et al., The Astro- physical Journal Supplement Series 241, 27 (2019)
2019
-
[35]
J. S. Speagle, Mon. Not. Roy. Astron. Soc. 493, 3132 (2020), arXiv:1904.02180 [astro-ph.IM]
2020 arXiv
-
[36]
Canizares, S
P. Canizares, S. E. Field, J. Gair, V. Raymond, R. Smith, and M. Tiglio, Phys. Rev. Lett. 114, 071104 (2015), arXiv:1404.6284 [gr-qc]
2015 arXiv
-
[37]
Smith, S
R. Smith, S. E. Field, K. Blackburn, C.-J. Haster, M. P¥”urrer, V. Raymond, and P. Schmidt, Phys. Rev. D94, 044031 (2016), arXiv:1604.08253 [gr-qc]
2016 arXiv
-
[38]
Morisaki, R
S. Morisaki, R. Smith, L. Tsukada, S. Sachdev, S. Steven- son, C. Talbot, and A. Zimmerman, Phys. Rev. D 108, 123040 (2023)
2023
-
[39]
Accelerated parameter estimation in bilby with relative binning,
K. Krishna, A. Vijaykumar, A. Ganguly, C. Talbot, S. Biscoveanu, R. N. George, N. Williams, and A. Zim- merman, “Accelerated parameter estimation in bilby with relative binning,” (2023), arXiv:2312.06009 [gr-qc]
2023 arXiv
-
[40]
Pankow, P
C. Pankow, P. Brady, E. Ochsner, and R. O’Shaughnessy, Phys. Rev. D 92, 023002 (2015)
2015
-
[41]
Supplementing rapid bayesian parame- ter estimation schemes with adaptive grids,
C. A. Rose, V. Valsan, P. R. Brady, S. Walsh, and C. Pankow, “Supplementing rapid bayesian parame- ter estimation schemes with adaptive grids,” (2022), arXiv:2201.05263 [gr-qc]. 12 1.0 1.2 1.4 1.6 M injected c 0.998 0.999 1.000 1.001 1.002 M recovered c /Minjected c Mc ∈ [0, 1...
2022 arXiv
Reviewed August 7, 2026 · model on record in the stance chip above.
Discussion (0). Continue with ORCID to comment.