MF-toolkit: A High-Performance Python Library for Multifractal Analysis with Automated Crossover Detection, Source Identification and Application to Gravitational Waves Data
Pith reviewed 2026-05-10 06:54 UTC · model grok-4.3
The pith
MF-toolkit automates crossover detection and surrogate testing to identify multifractality sources in time series.
A machine-rendered reading of the paper's core claim, the machinery that carries it, and where it could break.
Core claim
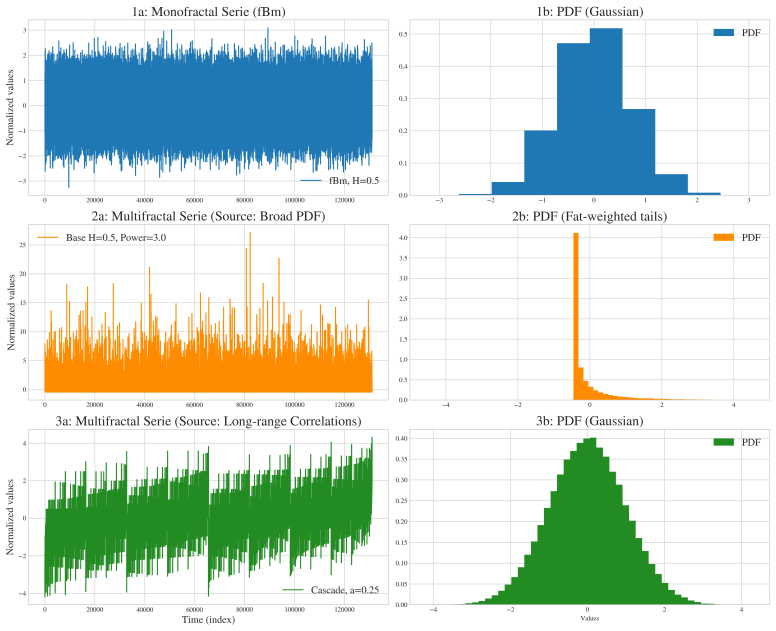
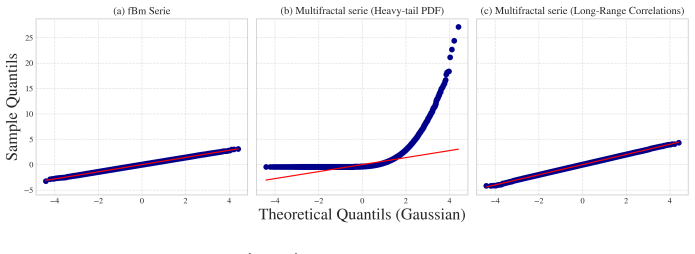
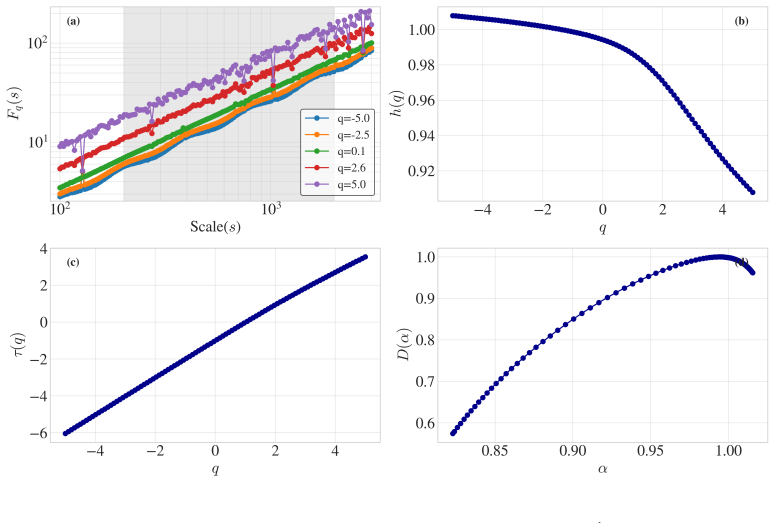
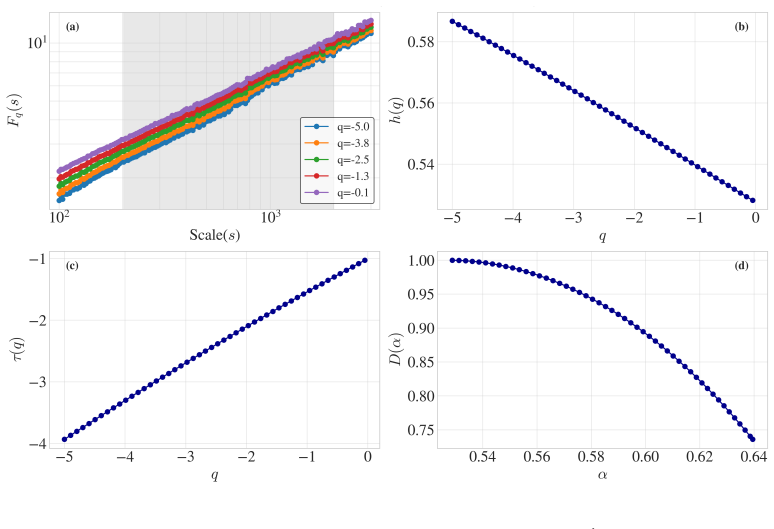
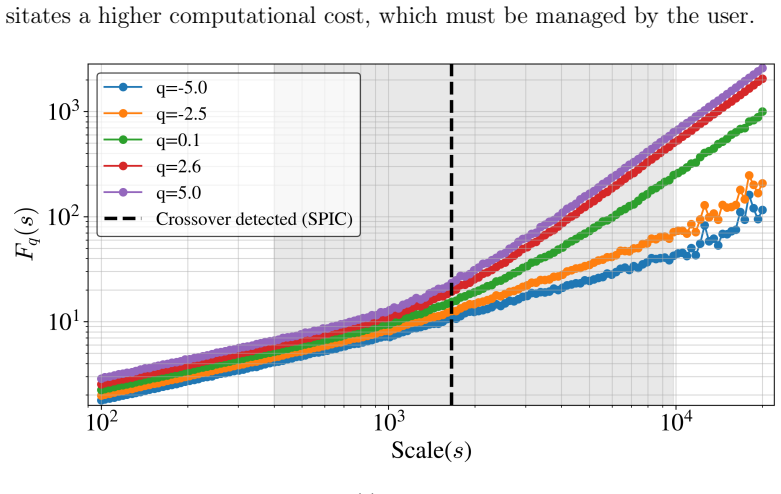
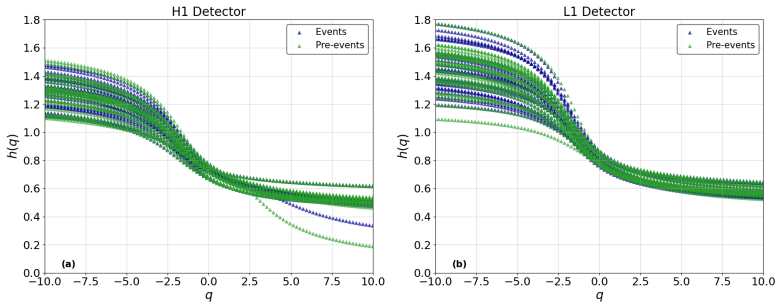
MF-toolkit supplies three integrated features for MFDFA: the CDV-A and SPIC algorithms that locate crossover points without operator input, a built-in IAAFT routine that produces surrogate data to discriminate the origin of multifractality, and a generator for controlled synthetic series. When these tools are run on LIGO gravitational-wave noise, they return reproducible scaling exponents and a classification of the multifractal source.
What carries the argument
MF-toolkit library containing the CDV-A and SPIC automatic crossover detectors together with an IAAFT surrogate generator that distinguishes correlation-based from distribution-based multifractality.
Load-bearing premise
The automatic crossover detectors locate the true scaling intervals in the data without injecting new systematic errors, and this remains true for the non-stationary noise found in gravitational-wave recordings.
What would settle it
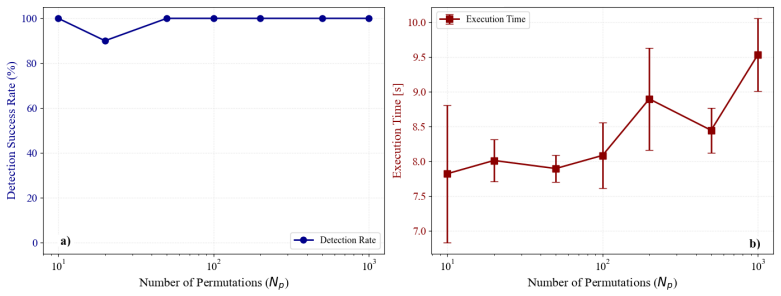
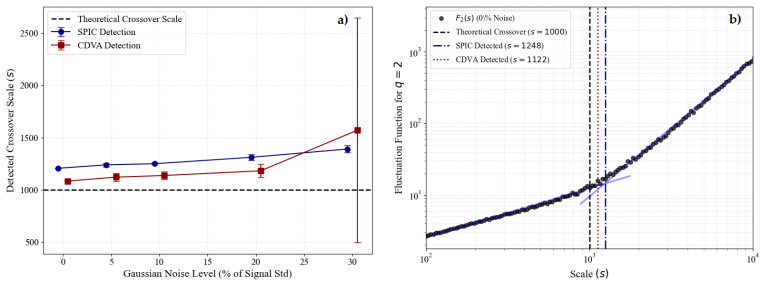
Apply CDV-A and SPIC to a collection of synthetic series whose crossover locations are known in advance; if the detected intervals deviate systematically from the known locations, the claim of unbiased automatic detection is refuted.
Figures
read the original abstract
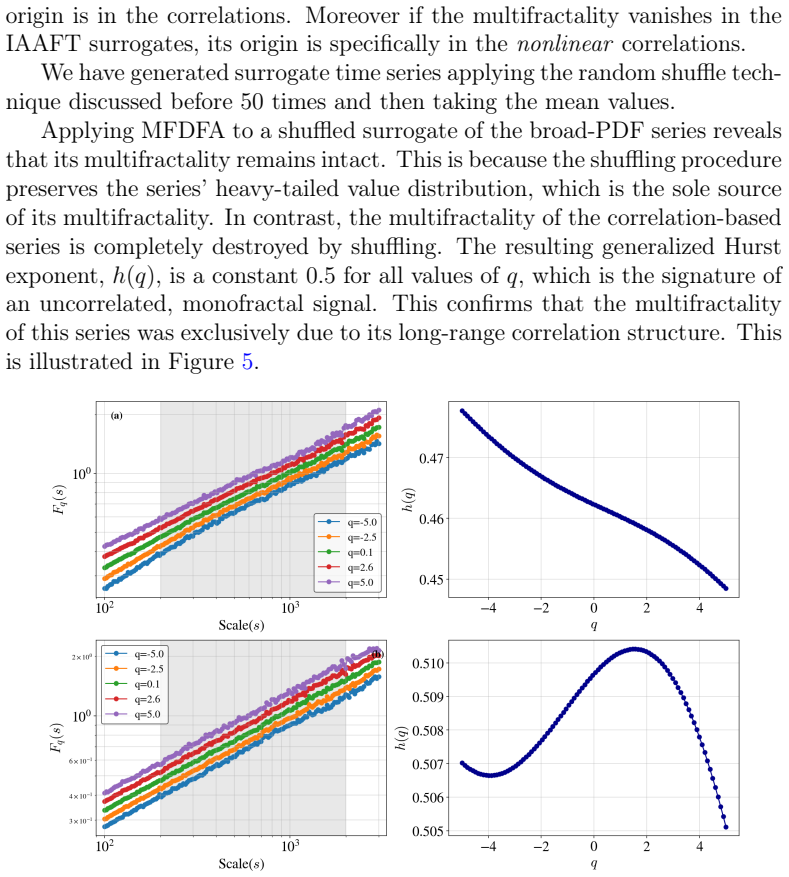
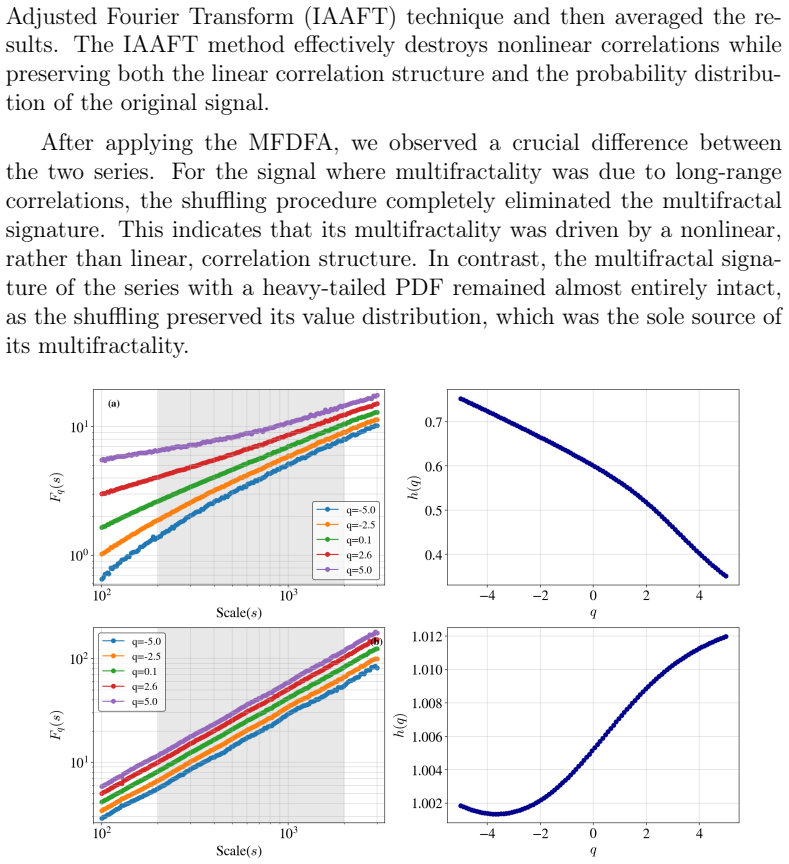
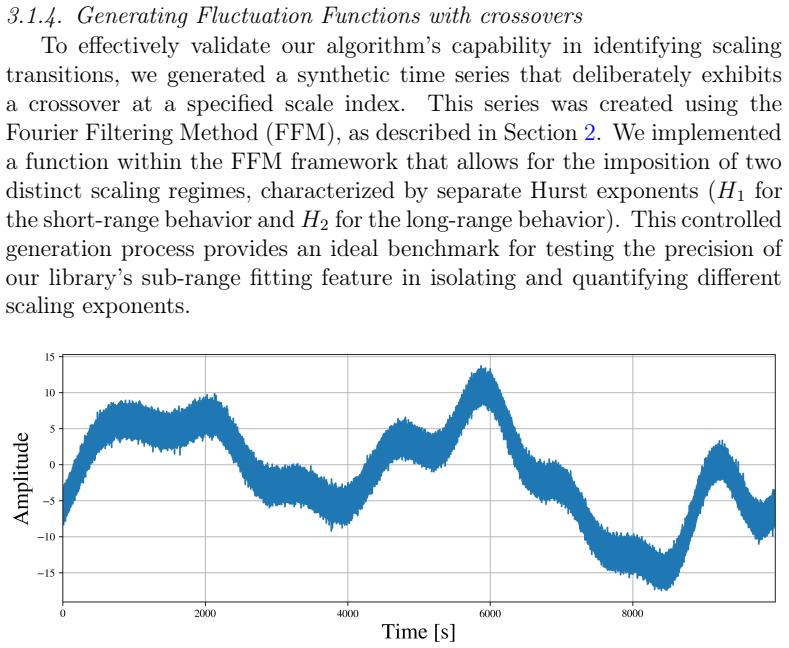
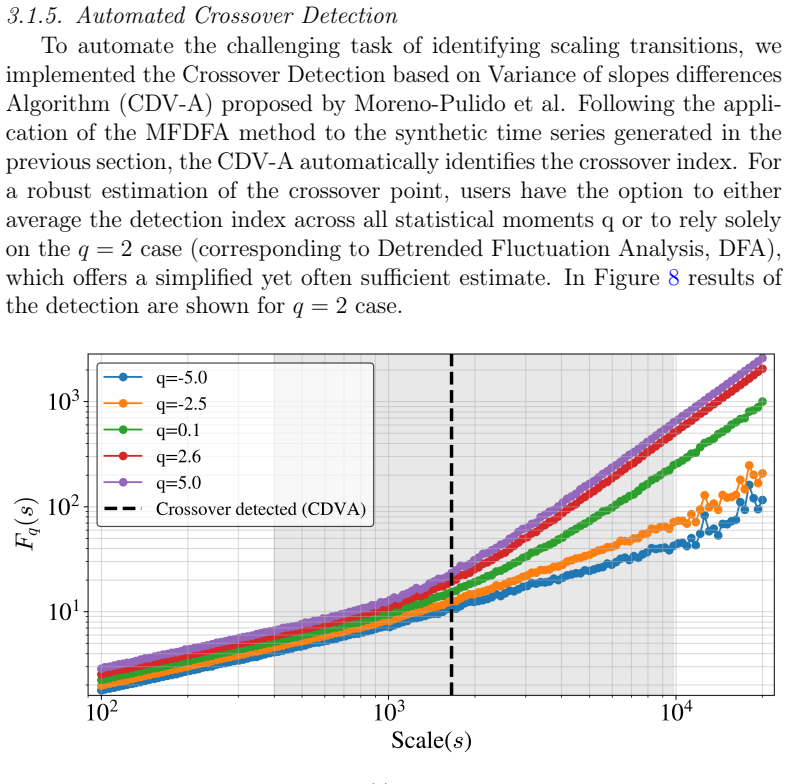
Multifractal Detrended Fluctuation Analysis (MFDFA) is a powerful and widely used technique for characterizing the scaling properties and long-range correlations of complex time series. However, its application often involves significant practical challenges, such as the subjective identification of scaling regions (crossovers) and the disambiguation of the physical origins of multifractality. We introduce MF-toolkit, a high-performance, parallelized Python library designed to address these challenges. It integrates three key innovations: (1) fully automatic crossover detection algorithms (CDV-A and SPIC), which remove operator bias and enhance reproducibility; (2) a built-in implementation of the Iterative Amplitude Adjusted Fourier Transform (IAAFT) for generating surrogate data, enabling the robust identification of the source of multifractality; and (3) a comprehensive suite for generating synthetic time series for rigorous validation. We demonstrate the rigor and utility of MF-toolkit through its application to characterize the multifractal properties of non-stationary noise in gravitational wave (LIGO) data. The MF-toolkit library offers a robust, efficient, and user-friendly tool for advanced time series analysis, facilitating more rigorous and reproducible research across physics and other data-intensive fields.
Editorial analysis
A structured set of objections, weighed in public.
Referee Report
Summary. The manuscript introduces MF-toolkit, a high-performance parallelized Python library for multifractal detrended fluctuation analysis (MFDFA). Key features include fully automatic crossover detection via CDV-A and SPIC algorithms to eliminate operator bias, a built-in IAAFT implementation for surrogate-based identification of multifractality sources, and a suite for generating synthetic time series with known scaling properties for validation. The library is demonstrated on non-stationary noise from LIGO gravitational wave data.
Significance. The library's automated methods, parallel implementation, and explicit validation on controlled synthetic series with known crossovers represent a concrete contribution to reproducibility in MFDFA. If the reported performance on synthetic data extends to real non-stationary signals, the toolkit would be a useful resource for physics and time-series analysis communities. The inclusion of IAAFT surrogates and the LIGO application section directly address practical challenges in source identification and handling of gravitational-wave noise.
major comments (1)
- [§4] §4 (Validation on synthetic data): The reported accuracy metrics for CDV-A and SPIC (e.g., crossover position error and scaling-region identification rates) are shown only for stationary synthetic series; quantitative results on non-stationary synthetic series matching the LIGO noise characteristics are needed to support the claim that the detectors remain unbiased on real gravitational-wave data.
minor comments (2)
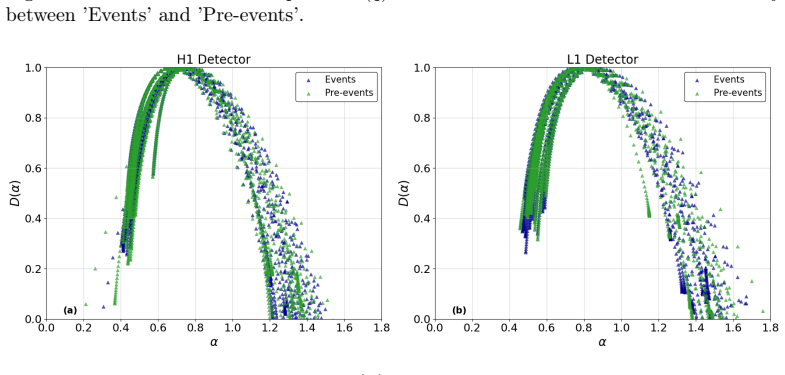
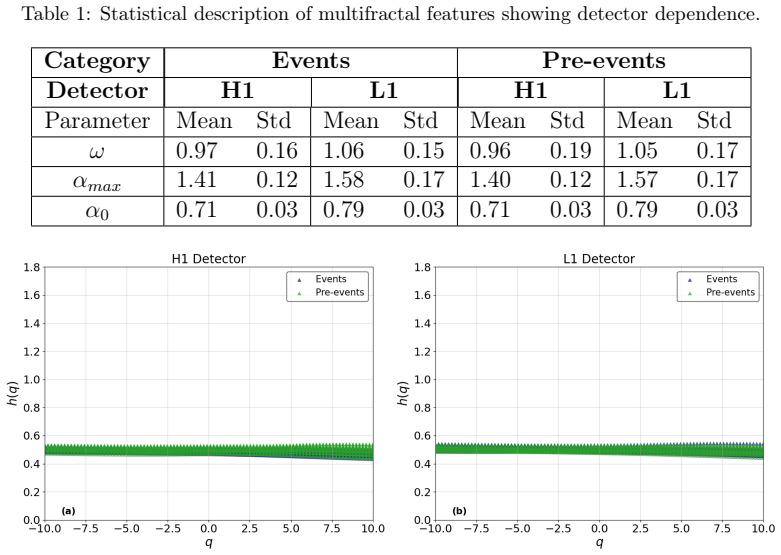
- [Figure 5] Figure 5 (LIGO application): The scaling plots would benefit from explicit annotation of the automatically detected crossover points to allow direct visual comparison with the algorithm output.
- [Abstract] The abstract states that the algorithms 'remove operator bias' without referencing the specific quantitative improvement (e.g., variance reduction across users) shown in the validation tables.
Simulated Author's Rebuttal
We thank the referee for the constructive review and the recommendation for minor revision. We address the single major comment below.
read point-by-point responses
-
Referee: [§4] §4 (Validation on synthetic data): The reported accuracy metrics for CDV-A and SPIC (e.g., crossover position error and scaling-region identification rates) are shown only for stationary synthetic series; quantitative results on non-stationary synthetic series matching the LIGO noise characteristics are needed to support the claim that the detectors remain unbiased on real gravitational-wave data.
Authors: We agree that the quantitative validation metrics for CDV-A and SPIC were demonstrated on stationary synthetic series, while the LIGO application provides a real-world demonstration on non-stationary data. To directly address this point, the revised manuscript will include additional quantitative results generated using MF-toolkit's synthetic series module. These will consist of non-stationary time series with controlled crossovers and multifractal properties calibrated to match the statistical characteristics of LIGO noise (e.g., non-stationarity and noise spectrum). This will furnish explicit accuracy metrics (crossover position error and scaling-region identification rates) for the detectors under conditions representative of gravitational-wave data. revision: yes
Circularity Check
No significant circularity; software library with explicit validation
full rationale
The paper introduces MF-toolkit as a software library implementing MFDFA with new automatic crossover detectors (CDV-A, SPIC), IAAFT surrogates, and synthetic data generators. It supplies algorithmic descriptions, pseudocode-level implementation details, quantitative tests on controlled synthetic series with known scaling breaks, and an explicit LIGO application. No mathematical derivation chain exists that reduces predictions or uniqueness claims to fitted parameters, self-definitions, or load-bearing self-citations. Validation is performed externally via synthetic benchmarks rather than by construction from the same data. The central claims rest on reproducible code and empirical results, not circular reduction.
Axiom & Free-Parameter Ledger
axioms (1)
- domain assumption Standard assumptions underlying MFDFA for characterizing scaling and long-range correlations in time series
Reference graph
Works this paper leans on
-
[1]
Long correlations and truncated levy walks applied to the study latin-american market in- dices,
S. Jaroszewicz, M. C. Mariani, and M. Ferraro, “Long correlations and truncated levy walks applied to the study latin-american market in- dices,”Physica A: Statistical Mechanics and its Applications, vol. 355, pp. 461–474, 2005
work page 2005
-
[2]
Mosaic organization of dna nucleotides,
“Mosaic organization of dna nucleotides,” tech. rep., 1994
work page 1994
-
[3]
Scaling detection in extrachromosomal dna,
S. Jaroszewicz, M. C. Mariani, O. K. Tweneboah, and M. P. Beccar- Varela, “Scaling detection in extrachromosomal dna,”Fractals, vol. 30, no. 09, p. 2250194, 2022
work page 2022
-
[4]
N. Mendez, S. Jaroszewicz, O. K. Tweneboah, M. P. Beccar-Varela, and M. C. Mariani, “Characterising the interplay of dynamics and artefacts: a multifractal analysis of historical humpback whale recordings,”Bioa- coustics, vol. 35, no. 2, pp. 220–239, 2026
work page 2026
-
[5]
F. Maruyama, K. Kai, and H. Morimoto, “Wavelet-based multifractal analysis of the el niño/southern oscillation, the indian ocean dipole and the north atlantic oscillation,”Scientific Online Letters on the Atmo- sphere, vol. 7, no. 1, pp. 65–68, 2011
work page 2011
-
[6]
Multifractal analysis of the southern oscillation index,
S. Jaroszewicz, M. C. Mariani, O. K. Tweneboah, and M. P. Beccar- Varela, “Multifractal analysis of the southern oscillation index,”Journal of Atmospheric and Solar-Terrestrial Physics, vol. 254, p. 106161, 2024
work page 2024
-
[7]
Study of the tempo- ral correlations in the magnitude time series before major earthquakes in japan,
P. A. Varotsos, N. V. Sarlis, and E. S. Skordas, “Study of the tempo- ral correlations in the magnitude time series before major earthquakes in japan,”Journal of Geophysical Research: Space Physics, vol. 119, pp. 9192–9206, 2014. 39
work page 2014
-
[8]
N. V. Sarlis, E. S. Skordas, P. A. Varotsos, A. Ramírez-Rojas, and E. L. Flores-Márquez, “Investigation of the temporal correlations be- tween earthquake magnitudes before the mexico m8.2 earthquake on 7 september 2017,”Physica A: Statistical Mechanics and its Applications, vol. 517, pp. 475–483, 2019
work page 2017
-
[9]
Spatial analysis of oil reservoirs using detrended fluctuation analysis of geophysical data,
R. A. Ribeiro, M. V. M. Mata, L. S. Lucena, U. L. Fulco, and G. Corso, “Spatial analysis of oil reservoirs using detrended fluctuation analysis of geophysical data,”Nonlinear Processes in Geophysics, vol. 21, pp. 1043– 1049, 2014
work page 2014
-
[10]
Fractional brownian motions, fractional noises and applications,
B. B. Mandelbrot and J. W. Van Ness, “Fractional brownian motions, fractional noises and applications,”SIAM Review, vol. 10, pp. 422–437, 1968
work page 1968
-
[11]
Long-range correlations and characterization of financial and volcanic time series,
M. C. Mariani, P. K. Asante, M. A. M. Bhuiyan, M. P. Beccar-Varela, S. Jaroszewicz, and O. K. Tweneboah, “Long-range correlations and characterization of financial and volcanic time series,”Mathematics, vol. 8, 2020
work page 2020
-
[12]
M.C.Mariani, W.Kubin, P.K.Asante, O.K.Tweneboah, M.P.Beccar- Varela, S. Jaroszewicz, and H. Gonzalez-Huizar, “Self-similar models: Relationship between the diffusion entropy analysis, detrended fluctua- tion analysis and lévy models,”Mathematics, vol. 8, 2020
work page 2020
-
[13]
Multifractal detrended ductuation anal- ysis of nonstationary time series,
J. W. Kantelhardt, S. A. Zschiegner, E. Koscielny-Bunde, S. Havlin, A. Bunde, and H. E. Stanley, “Multifractal detrended ductuation anal- ysis of nonstationary time series,” tech. rep., 2002
work page 2002
-
[14]
Introduction to multifractal detrended fluctuation analysis in matlab,
E. A. Ihlen, “Introduction to multifractal detrended fluctuation analysis in matlab,”Frontiers in Physiology, vol. 3 JUN, 2012
work page 2012
-
[15]
Fractal and multifractal time series,
J. W. Kantelhardt, “Fractal and multifractal time series,”arXiv e-prints, 2008
work page 2008
-
[16]
A criterion for the determination of optimal scaling ranges in dfa and mf-dfa,
D. Gulich and L. Zunino, “A criterion for the determination of optimal scaling ranges in dfa and mf-dfa,”Physica A: Statistical Mechanics and its Applications, vol. 397, pp. 17–30, 2014. 40
work page 2014
-
[17]
Multifractal signatures of gravitational waves detected by ligo,
D. B. de Freitas, M. M. Nepomuceno, and J. De Medeiros, “Multifractal signatures of gravitational waves detected by ligo,”Proceedings of the International Astronomical Union, vol. 14, no. S346, pp. 468–473, 2018
work page 2018
-
[18]
Multifractal chaos in gravita- tional waves from binary black hole mergers,
F. Oliveira, I. Lucena, and J. Ramos, “Multifractal chaos in gravita- tional waves from binary black hole mergers,”Chaos, Solitons & Frac- tals, vol. 200, p. 116980, 2025
work page 2025
-
[19]
Multifractal analysis of the gravitational waves,
L. F. Chernogor, O. V. Lazorenko, and A. A. Onishchenko, “Multifractal analysis of the gravitational waves,”Bulletin of V. Kharkiv National University N. Karazin, no. 26, pp. 33–39, 2017
work page 2017
-
[20]
Characterization of gravitational-wave detector noise with fractals,
M. Cavaglia, “Characterization of gravitational-wave detector noise with fractals,”Classical and Quantum Gravity, vol. 39, no. 13, p. 135012, 2022
work page 2022
-
[21]
Mfdfa: Effi- cient multifractal detrended fluctuation analysis in python,
L. R. Gorjão, G. Hassan, J. Kurths, and D. Witthaut, “Mfdfa: Effi- cient multifractal detrended fluctuation analysis in python,”Computer Physics Communications, vol. 273, p. 108254, 4 2022
work page 2022
-
[22]
S. Moreno-Pulido, J. C. de la Torre, P. Ruiz, and P. Pavón-Domínguez, “Crossover detection based on variances of slope differences for multi- fractal detrended fluctuation analysis (mf-dfa),”Nonlinear Dynamics, vol. 113, pp. 7425–7457, 4 2025
work page 2025
-
[23]
Detection of crossover time scales in multifrac- tal detrended fluctuation analysis,
E. Ge and Y. Leung, “Detection of crossover time scales in multifrac- tal detrended fluctuation analysis,”Journal of Geographical Systems, vol. 15, pp. 115–147, 4 2013
work page 2013
-
[24]
T. Schreiber and A. Schmitz, “Surrogate time series,” tech. rep., 2000
work page 2000
-
[25]
Using surrogate data to detect nonlinearity in time series,
J. Theiler, B. Galdrikian, A. Longtin, S. Eubank, and D. J. Farmer, “Using surrogate data to detect nonlinearity in time series,” inNonlinear Modeling and Forecasting(M. Casdagli and S. Eubank, eds.), pp. 163– 188, Redwood City, CA: Addison-Wesley, 1992
work page 1992
-
[26]
R.B.DaviesandD.S.Harte, “Testsforhursteffect,”Biometrika, vol.74, no. 1, pp. 95–101, 1987
work page 1987
-
[27]
Detecting long-range correlations with detrended fluc- tuation analysis,
A. B. Jan W. Kantelhardt; Eva Koscielny-Bundea, Henio H.A. Regoa; Shlomo Havlinb, “Detecting long-range correlations with detrended fluc- tuation analysis,”Physica A, vol. 295, p. 441–454, 2001. 41
work page 2001
-
[28]
Gravitational-wave transient catalogue,
G. W. O. S. Center, “Gravitational-wave transient catalogue,” 2023. Date of access: October 10,2023. 42
work page 2023
discussion (0)
Sign in with ORCID, Apple, or X to comment. Anyone can read and Pith papers without signing in.