REVIEW 2 major objections 5 minor 53 references
Even when six DM estimators agree on simple FRB bursts, second-to-minute swings of several pc cm^{-3} remain and cannot be real plasma-column changes; they are apparent DM from frequency-dependent emission timing.
Reviewed by Pith at T0; open to challenge. T0 means a machine referee read the full paper against a public rubric. the ladder, T0–T4 →
T0 review · grok-4.5
2026-07-11 23:18 UTC pith:TKHJV7DV
load-bearing objection Solid multi-method DM cross-check on a huge single-session sample; residual ~6 pc cm^{-3} swings are real and useful, but the leap to pure intrinsic chromatic emission is still under-constrained. the 2 major comments →
Cross-validation of six dispersion measure estimation methods for FRB 20240114A
The pith
A machine-rendered reading of the paper's core claim, the machinery that carries it, and where it could break.
Core claim
After strict inter-method consistency cuts that leave only morphologically simple, high-S/N bursts, FRB 20240114A still shows apparent DM fluctuations spanning ∼528–534 pc cm^{-3} over 15 780 s. These variations exceed the per-burst uncertainties and cannot arise from genuine line-of-sight electron-column changes on second-to-minute timescales; they are produced by intrinsic, frequency-dependent emission-time structure that mimics a dispersive delay.
What carries the argument
Inter-method scatter std_i (standard deviation of the six DM estimates for each burst) used as a morphology- and S/N-aware consistency filter; residual DM time series after the strictest std_i cut then isolate the apparent-DM signal.
Load-bearing premise
The true free-electron column and local plasma environment stay essentially fixed over the 4.4-hour session, so any remaining DM variation after multi-method consensus must be either noise or an emission-time effect generated at the source.
What would settle it
Simultaneous broadband measurements of the same simple bursts that include RM, scattering time, polarization, and high-time-resolution microshot structure; if those quantities stay constant while the apparent DM still jumps by several pc cm^{-3}, the emission-timing interpretation is supported; if they vary in lock-step with the jumps, a local plasma screen is favored.
Editorial analysis
A structured set of objections, weighed in public.
Referee Report
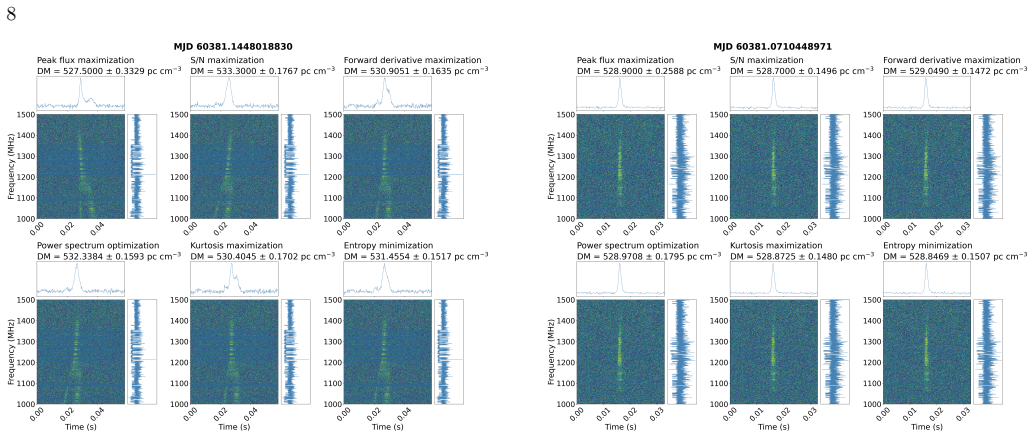
Summary. The paper compares six DM estimators (peak-flux and S/N maximization, forward-derivative maximization, power-spectrum optimization, and two new density-filtering methods based on kurtosis maximization and entropy minimization) on 2,874 bursts of FRB 20240114A from a single 4.4-hr FAST session. Using inter-method scatter std_i as a consistency metric, it shows that low-S/N and morphologically complex (double/multiple, drifting) bursts drive large method-to-method discrepancies, while single-component bursts yield tight agreement; RFI mainly affects the density-filtering methods via channel masking. Even after S/N>20 and the strictest consistency cut (std_i below the 5th percentile), the power-spectrum DMs still span ~528–534 pc cm^{-3}. The authors argue that genuine line-of-sight column changes on second-to-minute timescales are implausible (Eqs. 18–20) and interpret the residual swings as apparent DM produced by intrinsic frequency-dependent emission-time structure.
Significance. A large, homogeneous, publicly released burst sample observed over a short window is an excellent benchmark for isolating algorithmic DM systematics from astrophysical variation. The work is transparent about uncertainty budgets (algorithmic plus resolution terms), supplies open code and data, and introduces two SDS-based estimators that extend the usual signal/structure-optimization toolkit. The morphology–consistency results and the quantitative plasma-density argument against real short-timescale column changes are useful for the community. If the residual ~6 pc cm^{-3} swings in the strictest subsample are confirmed as intrinsic chromatic emission rather than residual algorithmic bias, the result would matter both for high-precision FRB cosmology and as a potential emission-mechanism diagnostic.
major comments (2)
- §5.3 and the bottom panel of Figure 5: the central inference that residual ~6 pc cm^{-3} swings (after S/N>20 and std_i < 0.1715 pc cm^{-3}) must be intrinsic emission-time structure rests on multi-method consensus equaling recovery of DM_true. Section 5.1 and Figures 7–11 already show that methods can lock onto the same biased apparent DM when mild drifts remain (Eq. 22). The paper does not quantify residual drift rates, sub-band DM consistency, or sad-trombone residuals inside that strictest cut. Without such a check, consensus may certify reproducibility of a shared bias rather than isolation of pure propagation DM. A short quantitative test on the bottom-panel subsample would make the claim load-bearing rather than under-constrained.
- §2.2.5 and §5.2: the density-filtering methods depend on an intensity threshold T that is not specified or varied. Because RFI channel masking is shown to distort SDS morphology and to elevate std_kl for Methods 5–6, the sensitivity of kurtosis/entropy DMs (and of the high/low-deviation groupings) to T should be reported, at least for a representative subset, so that the new estimators are reproducible and their contribution to the residual-fluctuation claim can be assessed.
minor comments (5)
- Figure 5 caption and §4: state explicitly how many bursts remain in each successive std_i panel (especially the 5th-percentile cut) so the reader can judge sample size behind the residual swings.
- §2.3: the 5% drop from peak S/N used for peak-flux and S/N uncertainties is conventional but arbitrary; a brief justification or comparison to an alternative (e.g. bootstrap) would help.
- Figure 16: the comparison to FRB 20220912A and FRB 20121102A is useful but lacks the same multi-method consistency filter; clarify that those panels are illustrative only.
- Notation: std_i vs std_kl vs std_nl (Figures 12–15) is slightly inconsistent; unify labels and define once in §2.4.
- Typographical: abstract and §4 use both FRB20240114A and FRB 20240114A; standardize. Also fix minor hyphenation and spacing (e.g. “high- -deviation”, “R- FI”).
Circularity Check
No significant circularity: empirical multi-method comparison with independent physical ruling-out of real column changes.
full rationale
The paper’s load-bearing chain is observational, not definitional. Six distinct optimization metrics (peak flux, S/N, forward derivative, power spectrum, kurtosis, entropy) are applied to the same non-de-dispersed dynamic spectra; inter-method scatter std_i is measured directly (Eqs. 16–17); a high-S/N, low-scatter subsample is selected; residual DM swings of ~6 pc cm^{-3} are reported; and real line-of-sight column changes are then excluded by independent timing-to-density/velocity estimates (Eqs. 18–20) that do not reuse any fitted DM model as a prediction. No parameter is fitted to a subset and re-branded as a forecast; no uniqueness theorem is imported from overlapping authors to forbid alternatives; the daily-mean DM line from Zhang et al. (2026) is only a visual reference, not an input that forces the residual-fluctuation result. Citations to Feng et al. (2026) and related works supply supporting context for apparent-vs-real DM, not a self-citation chain that defines the conclusion. The skeptic concern that multi-method consensus on mildly drifting single-component bursts may still lock onto a shared bias is a correctness/under-constraint issue, not a circular reduction of outputs to inputs by construction. Score 0 is therefore appropriate.
Axiom & Free-Parameter Ledger
free parameters (4)
- S/N threshold for high-reliability subsample =
20
- Density-filter intensity threshold T
- DM search grid (range and step) =
515–545 pc cm^{-3}, step 0.1
- Percentile gates for high/low-deviation groups =
5th / 95th
axioms (4)
- domain assumption The integrated free-electron column along the line of sight (true DM) is essentially constant over the 4.4-hour FAST session.
- domain assumption Radio-wave group delay follows the cold-plasma quadratic dispersion law (Eq. 2) with the classical dispersion constant K.
- domain assumption For morphologically simple single-component bursts the six optimization metrics converge to a value close to the true propagation DM.
- standard math Finite time and frequency resolution contribute an independent Gaussian uncertainty that can be added in quadrature to algorithmic uncertainty (Eq. 15).
invented entities (1)
-
Signal density space (SDS) / density-filtered binary dynamic spectrum
no independent evidence
read the original abstract
Fast Radio Bursts (FRBs) are important cosmological probes, but their applications depend critically on accurate dispersion measure (DM) determinations. We present a systematic comparison of six DM estimation methods using 2,874 bursts from FRB20240114A, the most active repeating FRB currently known, observed by FAST during a single 4.4-hr session on 2024 March 12. This large, homogeneous sample over a short timescale, during which the propagation environment is expected to be nearly static, provides an ideal benchmark for isolating algorithmic effects on DM determination. We investigate the dependence of inter-method consistency on signal-to-noise ratio (S/N), burst morphology, and radio frequency interference (RFI). Low-S/N bursts exhibit significantly larger inter-method deviations, while single-component bursts produce highly consistent DM values across methods. In contrast, complex double- and multiple-component bursts with drifting substructures lead to substantial inter-method scattering, indicating that DM discrepancies are primarily driven by algorithmic responses to burst morphology. RFI does not significantly alter the global statistical behavior of DM deviations, but it affects density-filtering methods through morphology distortion caused by frequency-channel masking. Even after imposing strict inter-method consistency constraints, FRB20240114A still exhibits notable apparent DM fluctuations spanning $\sim$528-534~pc~cm$^{-3}$ over 15,780s. For morphologically simple bursts these variations far exceed the measurement uncertainty and, on second-to-minute timescales, cannot arise from any plausible change in the line-of-sight electron column, pointing instead to a frequency-dependent emission-time structure intrinsic to the bursts that mimics dispersion.
Figures




Reference graph
Works this paper leans on
-
[1]
Bhandari, S., Bannister, K. W., James, C. W., et al. 2019, MNRAS, 486, 70, doi: 10.1093/mnras/stz804
-
[2]
Bhandari, S., Sadler, E. M., Prochaska, J. X., et al. 2020, ApJL, 895, L37, doi: 10.3847/2041-8213/ab672e
-
[3]
Bochenek, C. D., Ravi, V., Belov, K. V., et al. 2020, Nature, 587, 59, doi: 10.1038/s41586-020-2872-x
-
[4]
Caleb, M., Flynn, C., & Stappers, B. W. 2019, MNRAS, 485, 2281, doi: 10.1093/mnras/stz571
-
[5]
Chatterjee, S., Law, C. J., Wharton, R. S., et al. 2017, Nature, 541, 58, doi: 10.1038/nature20797 Chime/Frb Collaboration, Amiri, M., Andersen, B. C., et al. 2020, Nature, 582, 351, doi: 10.1038/s41586-020-2398-2 CHIME/FRB Collaboration, Andersen, B. C., Bandura, K. M., et al. 2020, Nature, 587, 54, doi: 10.1038/s41586-020-2863-y CHIME/FRB Collaboration,...
-
[6]
M., Shin, K., Pleunis, Z., et al
Cook, A. M., Shin, K., Pleunis, Z., et al. 2026, arXiv e-prints, arXiv:2605.08410, doi: 10.48550/arXiv.2605.08410
-
[7]
Cordes, J. M., & Lazio, T. J. W. 2002, arXiv e-prints, astro, doi: 10.48550/arXiv.astro-ph/0207156 12
-
[8]
Cordes, J. M., & McLaughlin, M. A. 2003, ApJ, 596, 1142, doi: 10.1086/378231
doi:10.1086/378231 2003
-
[9]
Cui, X.-h., Zhang, C.-m., Li, D., et al. 2026, arXiv e-prints, arXiv:2606.23903, doi: 10.48550/arXiv.2606.23903
work page internal anchor Pith review Pith/arXiv arXiv doi:10.48550/arxiv.2606.23903 2026
-
[10]
Day, C. K., Deller, A. T., James, C. W., et al. 2021, PASA, 38, e050, doi: 10.1017/pasa.2021.40
-
[11]
Day, C. K., Deller, A. T., Shannon, R. M., et al. 2020, MNRAS, 497, 3335, doi: 10.1093/mnras/staa2138
-
[12]
2014, ApJL, 783, L35, doi: 10.1088/2041-8205/783/2/L35
Deng, W., & Zhang, B. 2014, ApJL, 783, L35, doi: 10.1088/2041-8205/783/2/L35
-
[13]
2026, ApJ, 1004, 179, doi: 10.3847/1538-4357/ae731b
Feng, Y., Zhou, D., Zhang, Y., et al. 2026, ApJ, 1004, 179, doi: 10.3847/1538-4357/ae731b
-
[14]
2025, ApJ, 994, 239, doi: 10.3847/1538-4357/ae1a7d
Gao, R., Gao, H., Li, Z., & Yang, Y.-P. 2025, ApJ, 994, 239, doi: 10.3847/1538-4357/ae1a7d
-
[15]
Hessels, J. W. T., Spitler, L. G., Seymour, A. D., et al. 2019, ApJL, 876, L23, doi: 10.3847/2041-8213/ab13ae
-
[16]
2020, ApJL, 893, L26, doi: 10.3847/2041-8213/ab83fb
Ioka, K., & Zhang, B. 2020, ApJL, 893, L26, doi: 10.3847/2041-8213/ab83fb
-
[17]
Kulkarni, S. R. 2020, arXiv e-prints, arXiv:2007.02886, doi: 10.48550/arXiv.2007.02886
-
[18]
Kumar, P., Luo, R., Price, D. C., et al. 2023, MNRAS, 526, 3652, doi: 10.1093/mnras/stad2969
-
[19]
Li, D., Wang, P., Zhu, W. W., et al. 2021, Nature, 598, 267, doi: 10.1038/s41586-021-03878-5
-
[20]
2022, arXiv e-prints, arXiv:2208.13677, doi: 10.48550/arXiv.2208.13677
Lin, H.-H., Main, R., Pen, U.-L., et al. 2022, arXiv e-prints, arXiv:2208.13677, doi: 10.48550/arXiv.2208.13677
-
[21]
2026, arXiv e-prints, arXiv:2604.03769, doi: 10.48550/arXiv.2604.03769
Liu, Y., Wei, J.-J., Wu, P., & Wu, X.-F. 2026, arXiv e-prints, arXiv:2604.03769, doi: 10.48550/arXiv.2604.03769
-
[22]
Lorimer, D. R., Bailes, M., McLaughlin, M. A., Narkevic, D. J., & Crawford, F. 2007, Science, 318, 777, doi: 10.1126/science.1147532
-
[23]
R., & Kramer, M
Lorimer, D. R., & Kramer, M. 2004, Handbook of Pulsar
2004
-
[24]
Macquart, J.-P., Prochaska, J. X., McQuinn, M., et al. 2020, Nature, 581, 391, doi: 10.1038/s41586-020-2300-2
-
[25]
Marcote, B., Paragi, Z., Hessels, J. W. T., et al. 2017, ApJL, 834, L8, doi: 10.3847/2041-8213/834/2/L8
-
[26]
2014, ApJL, 780, L33, doi: 10.1088/2041-8205/780/2/L33
McQuinn, M. 2014, ApJL, 780, L33, doi: 10.1088/2041-8205/780/2/L33
-
[27]
2024, A&A, 683, A183, doi: 10.1051/0004-6361/202348247
Men, Y., & Barr, E. 2024, A&A, 683, A183, doi: 10.1051/0004-6361/202348247
-
[28]
2025, ApJ, 995, 183, doi: 10.3847/1538-4357/ae1a7c
Mo, J.-F., Zhu, W., Yang, Q.-R., Zheng, Y., & Feng, L.-L. 2025, ApJ, 995, 183, doi: 10.3847/1538-4357/ae1a7c
-
[29]
2021, ApJL, 909, L8, doi: 10.3847/2041-8213/abe7f0
Niu, C.-H., Li, D., Luo, R., et al. 2021, ApJL, 909, L8, doi: 10.3847/2041-8213/abe7f0
-
[30]
2022, Nature, 606, 873, doi: 10.1038/s41586-022-04755-5
Niu, C.-H., Aggarwal, K., Li, D., et al. 2022, Nature, 606, 873, doi: 10.1038/s41586-022-04755-5
-
[31]
2026, Science Bulletin, 71, 76, doi: 10.1016/j.scib.2025.11.023
Niu, C.-H., Li, D., Yang, Y.-P., et al. 2026, Science Bulletin, 71, 76, doi: 10.1016/j.scib.2025.11.023
-
[32]
Ocker, S. K., & Cordes, J. M. 2026, ApJ, 1002, 3, doi: 10.3847/1538-4357/ae5825
-
[33]
Platts, E., Caleb, M., Stappers, B. W., et al. 2021, MNRAS, 505, 3041, doi: 10.1093/mnras/stab1544
-
[34]
Pleunis, Z., Good, D. C., Kaspi, V. M., et al. 2021, ApJ, 923, 1, doi: 10.3847/1538-4357/ac33ac
-
[35]
Popov, S. B., & Postnov, K. A. 2010, in Evolution of Cosmic Objects through their Physical Activity, ed. H. A. Harutyunian, A. M. Mickaelian, & Y. Terzian, 129–132, doi: 10.48550/arXiv.0710.2006
-
[36]
Shannon, R. M. 2023, MNRAS, 523, 5109, doi: 10.1093/mnras/stad1740
-
[37]
R., Breitman, D., Michilli, D., et al
Sand, K. R., Breitman, D., Michilli, D., et al. 2023, ApJ, 956, 23, doi: 10.3847/1538-4357/acf221
-
[38]
2019, DM phase: Algorithm for correcting dispersion of radio signals,, Astrophysics Source Code Library, record ascl:1910.004 http://ascl.net/1910.004
Seymour, A., Michilli, D., & Pleunis, Z. 2019, DM phase: Algorithm for correcting dispersion of radio signals,, Astrophysics Source Code Library, record ascl:1910.004 http://ascl.net/1910.004
2019
-
[39]
Spitler, L. G., Scholz, P., Hessels, J. W. T., et al. 2016, Nature, 531, 202, doi: 10.1038/nature17168
-
[40]
Tendulkar, S. P., Bassa, C. G., Cordes, J. M., et al. 2017, ApJL, 834, L7, doi: 10.3847/2041-8213/834/2/L7
-
[41]
2013, Science, 341, 53, doi: 10.1126/science.1236789
Thornton, D., Stappers, B., Bailes, M., et al. 2013, Science, 341, 53, doi: 10.1126/science.1236789
-
[42]
Uttarkar, P. A., Shannon, R. M., Gourdji, K., et al. 2026, arXiv e-prints, arXiv:2602.16409, doi: 10.48550/arXiv.2602.16409
-
[43]
Wu, Q., Yu, H., & Wang, F. Y. 2020, ApJ, 895, 33, doi: 10.3847/1538-4357/ab88d2
-
[44]
2025, A&A, 698, L3, doi: 10.1051/0004-6361/202554550
Xiao, D. 2025, A&A, 698, L3, doi: 10.1051/0004-6361/202554550
-
[45]
Yao, J. M., Manchester, R. N., & Wang, N. 2017, ApJ, 835, 29, doi: 10.3847/1538-4357/835/1/29
-
[46]
2025, MNRAS, 544, 3180, doi: 10.1093/mnras/staf1910
Yuan, M., Niu, J., Feng, Y., et al. 2025, MNRAS, 544, 3180, doi: 10.1093/mnras/staf1910
-
[47]
2025, arXiv e-prints, arXiv:2507.14707, doi: 10.48550/arXiv.2507.14707
Zhang, J.-S., Wang, T.-C., Wang, P., et al. 2025, arXiv e-prints, arXiv:2507.14707, doi: 10.48550/arXiv.2507.14707
-
[48]
2026, ApJ, 998, 276, doi: 10.3847/1538-4357/ae314a
Zhang, L.-X., Tian, S., Shen, J., et al. 2026, ApJ, 998, 276, doi: 10.3847/1538-4357/ae314a
-
[49]
2022, Research in Astronomy and Astrophysics, 22, 124002, doi: 10.1088/1674-4527/ac98f7
Zhang, Y.-K., Wang, P., Feng, Y., et al. 2022, Research in Astronomy and Astrophysics, 22, 124002, doi: 10.1088/1674-4527/ac98f7
-
[50]
2023, ApJ, 955, 142, doi: 10.3847/1538-4357/aced0b
Zhang, Y.-K., Li, D., Zhang, B., et al. 2023, ApJ, 955, 142, doi: 10.3847/1538-4357/aced0b
-
[51]
2025, ApJL, 984, L40, doi: 10.3847/2041-8213/adcc30
Zhang, Z.-L., & Zhang, B. 2025, ApJL, 984, L40, doi: 10.3847/2041-8213/adcc30
-
[52]
Zheng, Z., Ofek, E. O., Kulkarni, S. R., Neill, J. D., & Juric, M. 2014, ApJ, 797, 71, doi: 10.1088/0004-637X/797/1/71 13
-
[53]
Zhou, D. J., Han, J. L., Jing, W. C., et al. 2023, MNRAS, 526, 2657, doi: 10.1093/mnras/stad2769
discussion (0)
Sign in with ORCID, Apple, or X to comment. Anyone can read and Pith papers without signing in.