REVIEW 3 major objections 5 minor 99 references
Role Detection in Bicycle-Sharing Networks Using Multilayer Stochastic Block Models
T0 review · 3 major / 5 minor · reviewed 2026-08-14 · deepseek-v4-flash
Pith's one-line read Hourly bicycle-sharing trip counts, modeled with time-dependent stochastic block models, expose the functional roles of docking stations as home, work, or mixed-use districts.
desk verdict A clean, honest methods paper for temporal degree-corrected SBMs whose role-detection claims hold at small spatial scales but not on full NYC; worth serious refereeing. read the letter →
The pith
A machine-rendered reading of the paper's core claim, the machinery that carries it, and where it could break.
The reading
What carries the argument
The load-bearing object is the time-dependent degree-corrected stochastic block model, a multilayer graph model in which node memberships $C_{ig}$ are fixed across 24 hourly layers but the block-to-block connectivity parameters $\omega_{ght}$ vary with the hour. The Poisson likelihood couples these parameters through the mean $\mu_{ijt}=\sum_{g,h} C_{ig}\,\omega_{ght}\,C_{jh}$, so the model explains each station's hourly in- and out-flow by its role strengths and the time-of-day currents between roles. The discrete version has a closed-form likelihood objective $\sum_t \sum_{g,h} m_{ght}\log(m_{ght}/(\kappa_g\kappa_h))$, where $m_{ght}$ is the observed trip count from block $g$ to block $h$ in hour $t$ and $\kappa_g$ is the total degree of block $g$; this objective is what a greedy local-reassignment algorithm optimizes. Degree correction is built in through the constraints $\sum_i C_{ig}=1$ for the mixed model and $\sum_{i\in g}\theta_i=1$ for the discrete model, so block divisions are not confused with station size.
What would settle it
Fit the discrete model to a large bike-share network after adding a distance-dependent factor to the mean edge count, such as replacing $\omega_{ght}$ with $\omega_{ght} f(d_{ij})$; if role labels still split the network along borough lines rather than by commute direction, the missing-distance explanation is wrong and the model's functional-role claim fails. Alternatively, compare the inferred home/work labels on Manhattan against independent origin-destination commuting data from a travel survey; systematic disagreement would falsify the role interpretation.
Extended reading notes
Core claim
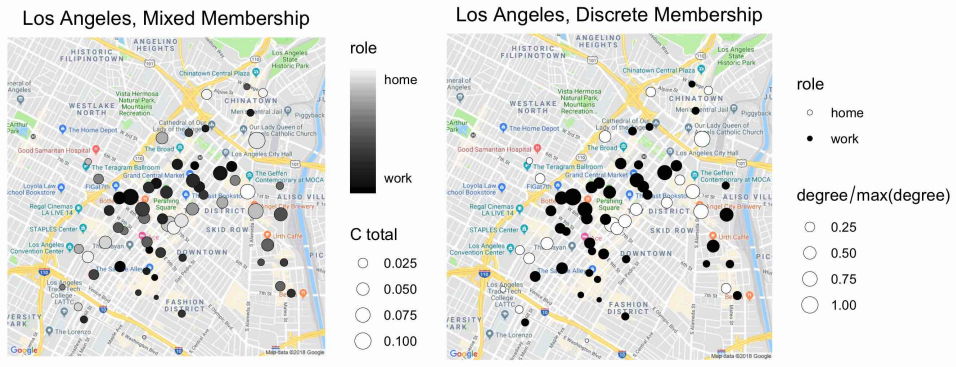
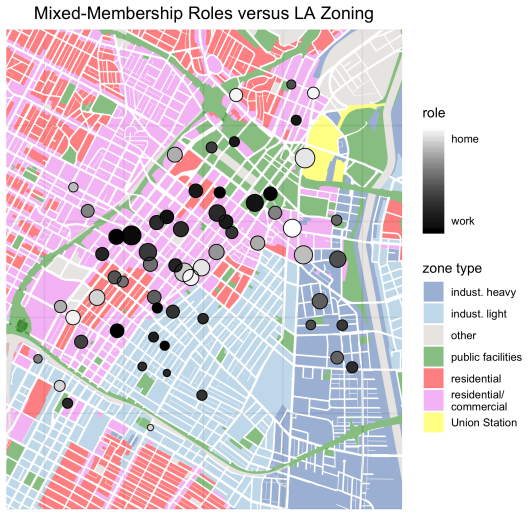
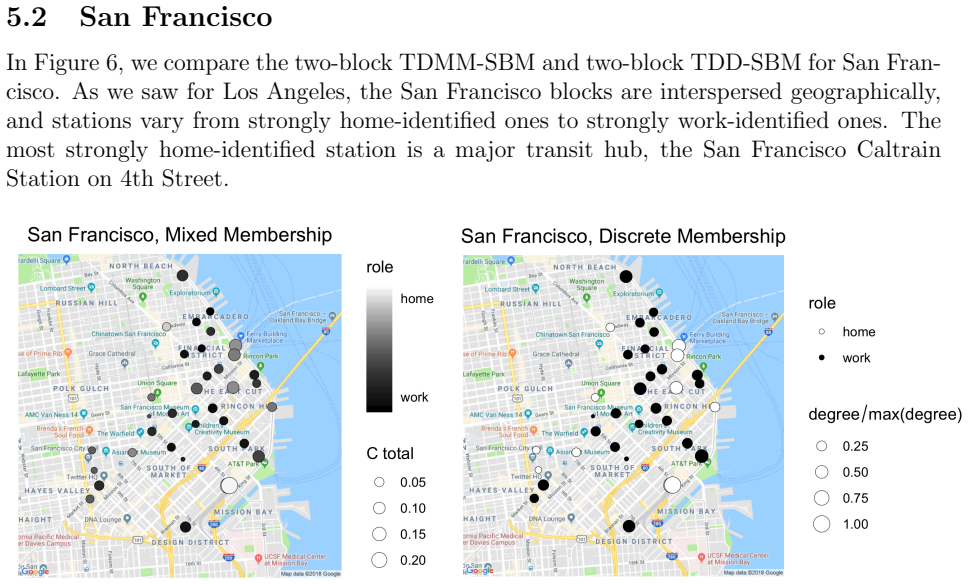
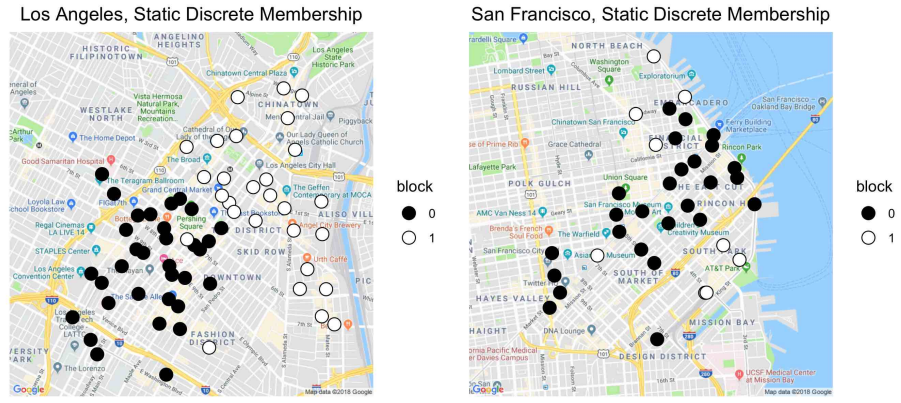
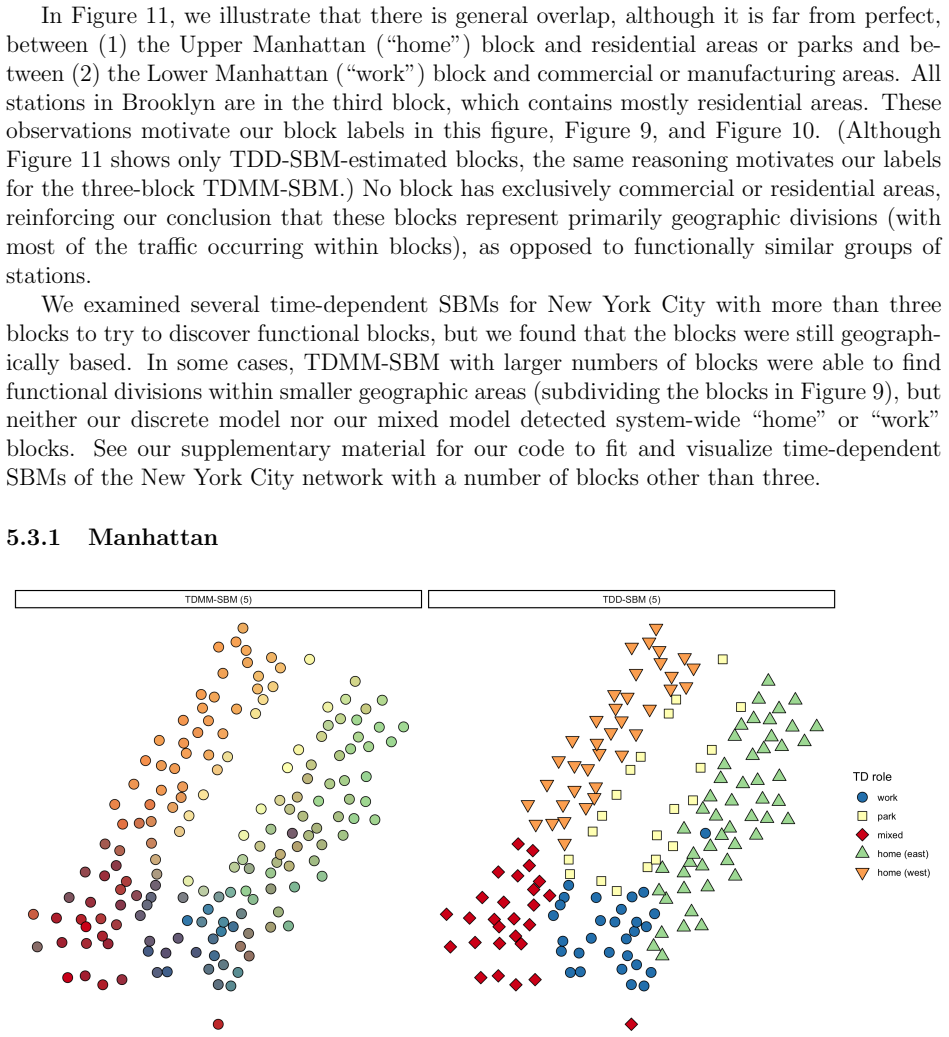
The central claim is that a Poisson model with mean number of trips from station $i$ to station $j$ in hour $t$ given by $\mu_{ijt}=\sum_{g,h} C_{ig}\,\omega_{ght}\,C_{jh}$ — where $C_{ig}$ is the strength of station $i$ in block $g$ and $\omega_{ght}$ is the directed activity from block $g$ to block $h$ during that hour — classifies docking stations into functional roles while describing city-specific traffic patterns. In the discrete version, each station belongs to exactly one block; in the mixed version, stations can split their membership across blocks. Fitting these models to weekday trips recovers home and work blocks in downtown Los Angeles and San Francisco, with the home–work split matching zoning maps apart from transit hubs such as Union Station and the Caltrain station. On the full New York City network, the same models return geographically based blocks rather than functional roles, which the authors attribute to the lack of a distance correction; fitting the Manhattan subnetwork restores functional blocks, including a park block with afternoon leisure traffic.
Load-bearing premise
Hourly trip counts between station pairs are independent Poisson variables whose means factor through station role strengths and hourly block-to-block rates, with no adjustment for the geographic distance between stations; if distance strongly shapes trip counts, the inferred roles on large systems are geographic rather than functional.
Editorial extensions
If this is right
- If the models hold, operators can label stations as home, work, mixed, or leisure-oriented from origin-destination records alone, without needing zoning maps.
- The estimated hourly block-to-block traffic $\hat{\omega}_{ght}$ gives a concise daily profile of each district, including commuting peaks and midday or leisure activity.
- Because the discrete model's degree-corrected likelihood has closed-form parameter estimates, the method can be run many times on networks with hundreds of stations to avoid poor local optima.
- The failure on the full New York City network shows the method's limit: without distance normalization, large spatial networks tend to split geographically, so the models are most reliable when all stations lie within cycling distance of one another.
Reading between the lines
- A natural extension is to include a distance factor inside the mean $\mu_{ijt}$ — for example, replacing $\omega_{ght}$ with $\omega_{ght} f(d_{ij})$ for a gravity- or radiation-style decay — which the paper's own New York result predicts should convert geographic blocks back into functional home/work blocks on the full network.
- The same fixed-membership, time-varying-activity structure could be applied to dockless vehicle systems by partitioning a city into grid cells and treating each cell's pickup and drop-off counts as the observed layers, a setting the authors mention as future work.
- Because the mixed-membership model expresses each station as a blend of roles, it could be used to forecast station-level demand by combining a station's $C_{ig}$ with the learned $\omega_{ght}$, potentially supporting dynamic rebalancing decisions.
- One could test the role labels against independent commute data, such as census or subway origin-destination flows, to see whether the home/work split reflects broader urban mobility rather than bike-share-specific demand.
Signed reviews
Editorial analysis
A structured set of objections, weighed in public.
Referee Report
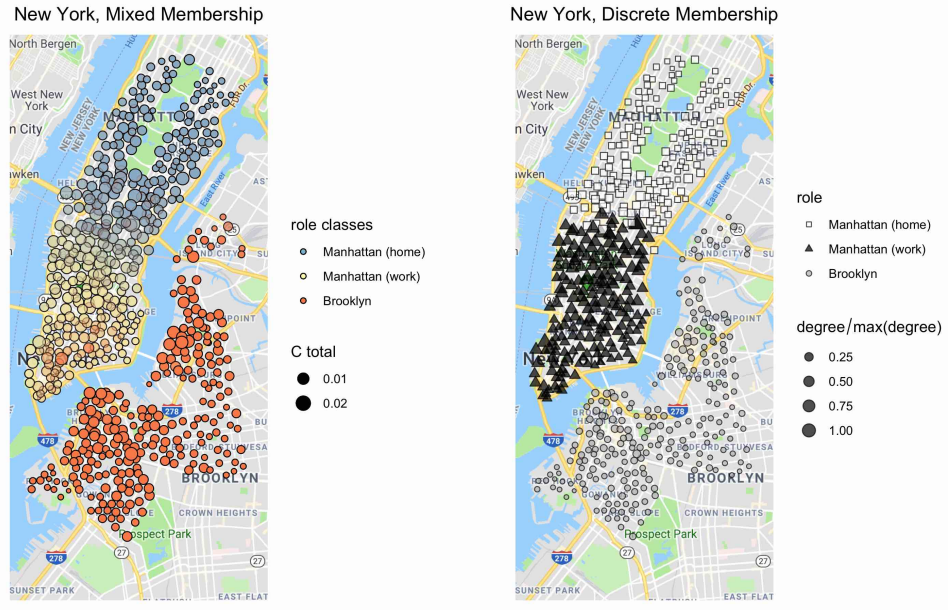
Summary. The paper proposes two time-dependent, degree-corrected stochastic block models for directed multilayer networks of bicycle-sharing trips: a mixed-membership model (TDMM-SBM) and a discrete-membership model (TDD-SBM). In both, hourly trip counts are modeled as independent Poisson variables with mean μ_ijt = Σ_{g,h} C_ig ω_ght C_jh, where block memberships are fixed over time and the block-to-block parameters ω_ght vary by hour. The authors derive closed-form maximum-likelihood estimators for the TDD-SBM, an iterative gradient-ascent procedure for the TDMM-SBM, and a Kernighan–Lin-type algorithm for block assignment. They apply the models to bike-share networks in downtown Los Angeles, San Francisco, and New York City, labeling blocks as 'home' or 'work' from the estimated ω_ght curves and comparing the assignments with city zoning maps. The paper includes a proof that the TDD-SBM reproduces expected node degrees and reports that on the full New York City network the models find geographic rather than functional blocks, which the authors attribute to the absence of a distance normalization; they therefore analyze a Manhattan subnetwork to recover functional roles.
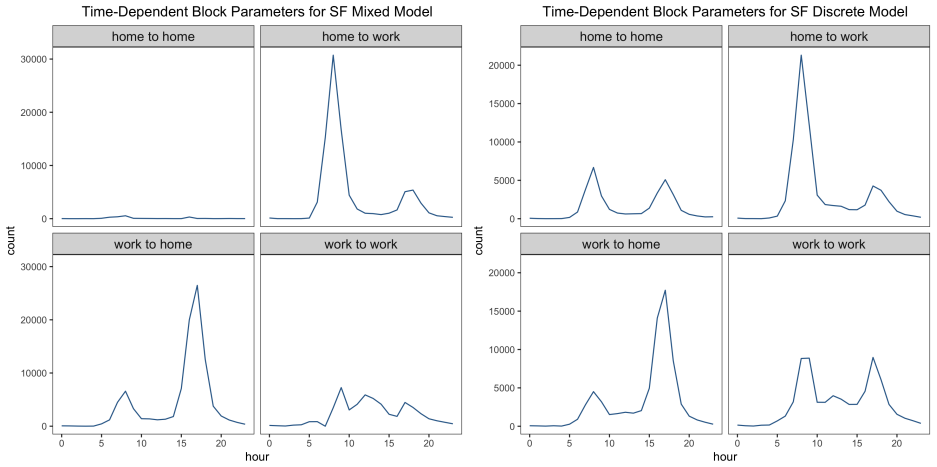
Significance. The methodological core is sound and useful: the TDD-SBM likelihood is clean, the closed-form MLEs are derived explicitly, the expected-degree proof in Appendix 6.2 is correct, and the authors provide reproducible code and data. The models also yield interpretable, city-specific temporal patterns, such as intra-block commuting peaks in San Francisco and a midday work-activity peak in Los Angeles. However, the empirical support for the paper's central claim—that the models 'successfully uncover work, home, and other districts' in three major cities—is not yet established. The full New York City experiment in Section 5.3 shows that the distance-free Poisson model collapses into geographic blocks, and the role labels are assigned heuristically and validated only visually. The contribution is therefore best viewed as a promising modeling framework whose advertised substantive findings require either a scoping of the claims or an explicitly distance-corrected model.
major comments (3)
- [Section 3.1 / Section 5.3] The Poisson mean μ_ijt in Eq. (2) contains no dependence on geographic distance, and the paper's own full-network analysis of New York City shows that two- and three-block fits split along the East River and by borough, with most traffic intra-block and no system-wide home/work structure, an outcome the authors attribute to the missing distance normalization. Because this is the largest system studied, it directly contradicts the abstract's general claim that the models 'successfully uncover work, home, and other districts' in three major cities, and it shows that the fitted model changes what it estimates when distance matters. I recommend either restricting the role-detection claims to networks whose stations are within biking distance, or adding a distance covariate to the model and showing that functional blocks survive on the full NYC network.
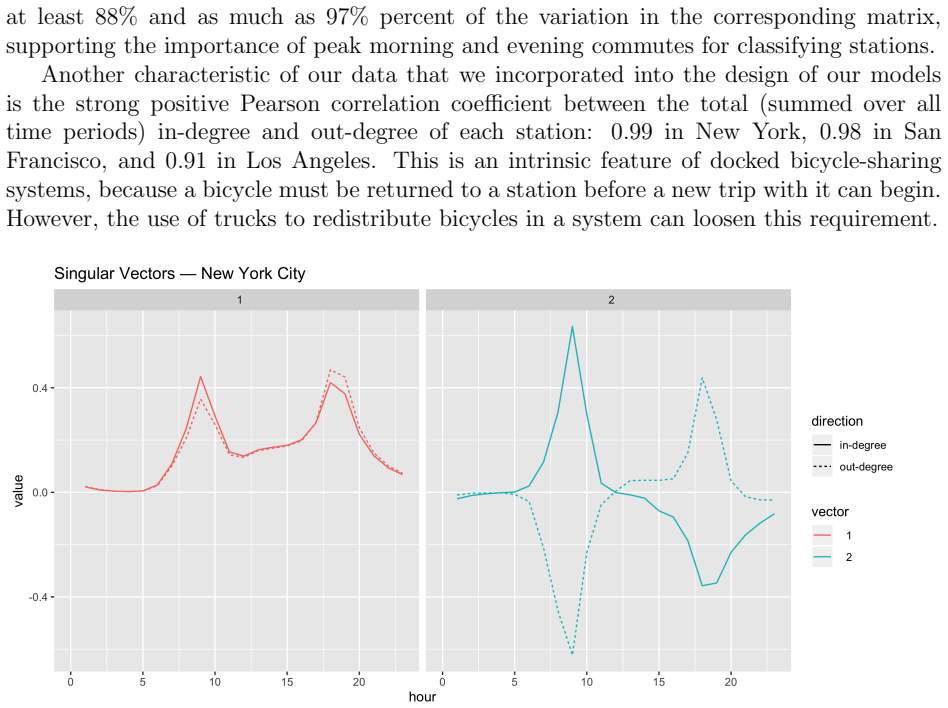
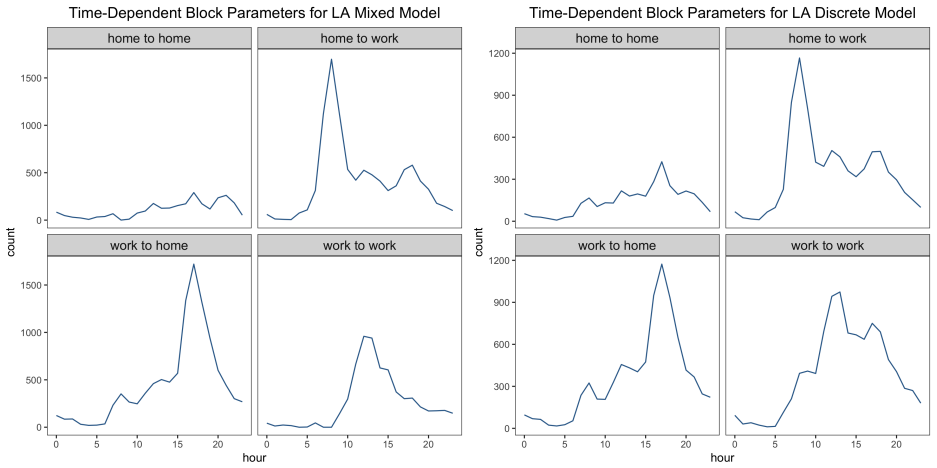
- [Section 5.1 / Figures 5 and 11] Role labels are assigned post hoc by heuristic inspection of the estimated block-to-block curves ω_ght, and the validation against zoning maps is visual only; no quantitative agreement measure or uncertainty on the labels is provided. Since 'role detection' is the paper's central output, this makes the home/work interpretation difficult to verify or falsify from the reported evidence. Please specify a deterministic labeling rule from the estimated parameters and report a quantitative comparison, such as agreement rates with zoning categories or confidence intervals from the HMC/Stan fits mentioned in Section 4.1.
- [Section 5.4 / Table 1 and Figure 14] The log-likelihood and AIC keep improving as K grows, and the authors state that models with seven or more blocks are overfitted and uninformative, so the choice of K in the reported role analyses (K=2, 3, 5) is not determined by a stated criterion. Because the conclusions about home/work roles depend on the selected K, the paper should include a stability analysis across K and across optimization restarts, or a cross-validated model-selection procedure; without it, the reported roles may be an artifact of the chosen K.
minor comments (5)
- [Table 1 caption] The caption writes 'TDD-SMB'; this should be 'TDD-SBM'.
- [Section 5.3.1] The first paragraph says 'a five-block TDD-SBM and TDD-SBM'; the second model should be 'TDMM-SBM'.
- [Section 2.1 and Appendix 6.1] The phrase 'principle components' should be 'principal components'.
- [Equation (2) and Section 3] The likelihood is written as L(G; ω, C) while G is also used for the vector of block assignments; please disambiguate the notation for the observed array.
- [Section 3.2] The displayed derivative with respect to θ_i is typographically ambiguous; the numerator should be parenthesized as (Σ_j \tilde A_ij + Σ_j \tilde A_ji)/θ_i.
Circularity Check
The model fitting is self-contained; only the post-hoc 'home'/'work' labeling is mildly self-referential, so the paper is not significantly circular.
-
self definitional
[Section 5.1, paragraph beginning 'Our model does not yield...' and Figure 4.]
"Our model does not yield “home” and “work” labels for each block on its own, so we use the time-dependent block-to-block parameter estimates ˆωght to assign these labels. We assign the labels heuristically under the assumption that the “home” block is the origin of many trips to the work block in the morning and the “work” block is the origin of many trips to the home block in the evening. Figure 4, which shows ˆωght for each possible value of g and h, with the hour t on the horizontal axis, supports our labeling."
The labels 'home' and 'work' are not inferred independently of the fitted block-to-block parameters; they are chosen by matching the orientation of the fitted ω_ght curves to the home-to-work-morning and work-to-home-evening assumption. Saying that Figure 4 'supports our labeling' is then a restatement of the same fitted parameters used to assign the labels, rather than an independent confirmation. The circularity is mild and explicitly disclosed, and the external zoning-map comparisons in Figures 5 and 11 provide genuinely independent evidence for the spatial roles.
full rationale
The central inference is not circular: the TDMM-SBM and TDD-SBM likelihoods in Sections 3.1–3.2 are derived from first principles, with explicit Poisson means and maximum-likelihood equations, and the parameters C_i and ω_ght are fit directly to the trip-count array A_ijt without using zoning data, role labels, or any home/work designation during estimation. The appendix proves the expected-degree property algebraically. The paper's own Section 5.3 admits that on the full New York City network the models recover geographic rather than functional blocks because distance is not normalized; that is a correctness limitation, not a circularity. The only self-referential step is the heuristic assignment of 'home' and 'work' names from the fitted ω_ght curves, followed by citing those same curves as support. Because the labels are post-hoc, do not feed back into the optimization, and the blocks are checked against external zoning maps, this does not undermine the core derivation. The paper would have been stronger if it had framed the labeling as an interpretive convention rather than a validation, but overall the derivation chain is self-contained.
Assumptions & free parameters
free parameters (4)
- Number of blocks K =
K=2 for LA and SF, K=3 for NYC, K=5 for Manhattan subnetwork
- Time layer width and weekday filter =
24 hourly layers; weekday trips only
- Trip and station cleaning thresholds =
Trips <=2 min removed; >=90 min (LA/SF) or >=120 min (NYC) removed; stations without at least one departure and…
- Optimization hyperparameters =
Delta=1e-4 initial step; convergence when log-likelihood stable to 4 significant digits for 600 steps; 10 TDMM…
assumptions (6)
- domain assumption Hourly trip counts between stations are conditionally independent Poisson random variables given the block parameters.
- domain assumption Each station's block membership is fixed across the 24 hourly layers.
- ad hoc to paper Stations are close enough that edge probabilities need no correction for geographic distance.
- domain assumption For every human mobility flow there is a countercurrent, so a single node-strength parameter can represent both in- and out-degree.
- standard math The identifiability constraint sum_i C_ig = 1 does not reduce the set of representable mean edge activities.
- domain assumption City zoning maps are a valid external reference for evaluating detected functional roles.
Cite this review
Pith. "Pith review of Role Detection in Bicycle-Sharing Networks Using Multilayer Stochastic Block Models." pith.science (2026). https://pith.science/paper/U7Q27HRN
@misc{pith2026190809440,
  author       = {Pith},
  title        = {Pith review of: Role Detection in Bicycle-Sharing Networks Using Multilayer Stochastic Block Models},
  year         = {2026},
  howpublished = {\url{https://pith.science/paper/U7Q27HRN}},
  note         = {Machine review of arXiv:1908.09440}
}
read the original abstract
In urban spatial networks, there is an interdependency between neighborhood roles and the transportation methods between neighborhoods. In this paper, we classify docking stations in bicycle-sharing networks to gain insight into the human mobility patterns of three major United States cities. We propose novel time-dependent stochastic block models (SBMs), with degree-heterogeneous blocks and either mixed or discrete block membership, which classify nodes based on their time-dependent activity patterns. We apply these models to (1) detect the roles of bicycle-sharing docking stations and (2) describe the traffic within and between blocks of stations over the course of a day. Our models successfully uncover work, home, and other districts; they also reveal activity patterns in these districts that are particular to each city. Our work has direct application to the design and maintenance of bicycle-sharing systems, and it can be applied more broadly to community detection in temporal and multilayer networks with heterogeneous degrees.
Figures

Figures from the paper (13 more)




Reference graph
Works this paper leans on
-
[1]
Barthelemy, Morphogenesis of Spatial Networks
M. Barthelemy, Morphogenesis of Spatial Networks. Cham, Switzerland: Springer International Publishing, 2018
2018
-
[2]
The statistical physics of cities,
M. Barthelemy, “The statistical physics of cities,” Nature Reviews Physics, vol. 1, pp. 406–415, 2019
2019
-
[3]
Human mobility: Models and applications,
H. Barbosa, M. Barthelemy, G. Ghoshal, C. R. James, M. Lenormand, T. Louail, R. Menezes, J. J. Ramasco, F. Simini, and M. Tomasini, “Human mobility: Models and applications,” Physics Reports, vol. 734, pp. 1–74, 2018
2018
-
[4]
The structure of interur- ban traffic: A weighted network analysis,
A. De Montis, M. Barthelemy, A. Chessa, and A. Vespignani, “The structure of interur- ban traffic: A weighted network analysis,” Environment and Planning B: Planning and Design, vol. 34, no. 5, pp. 905–924, 2007
2007
-
[5]
Detecting the dy- namics of urban structure through spatial network analysis,
C. Zhong, S. M. Arisona, X. Huang, M. Batty, and G. Schmitt, “Detecting the dy- namics of urban structure through spatial network analysis,” International Journal of Geographical Information Science, vol. 28, no. 11, pp. 2178–2199, 2014
2014
-
[6]
Structure of urban move- ments: Polycentric activity and entangled hierarchical flows,
C. Roth, S. M. Kang, M. Batty, and M. Barthelemy, “Structure of urban move- ments: Polycentric activity and entangled hierarchical flows,” PloS One, vol. 6, no. 1, p. e15923, 2011. 34
2011
-
[7]
Unraveling the hidden organisation of urban systems and their mobility flows
R. Gallotti, G. Bertagnolli, and M. De Domenico, “Disentangling activity-aware human flows reveals the hidden functional organization of urban systems,” 2019. arXiv:1908.02538
work page Pith review arXiv 2019
-
[8]
A multi-scale analysis of 27,000 urban street networks: Every US city, town, urbanized area, and Zillow neighborhood,
G. Boeing, “A multi-scale analysis of 27,000 urban street networks: Every US city, town, urbanized area, and Zillow neighborhood,” Environment and Planning B: Urban Analytics and City Science, p. 2399808318784595, 2018
2018
Show all 99 references
-
[9]
The scaling structure of the global road network,
E. Strano, A. Giometto, S. Shai, E. Bertuzzo, P. J. Mucha, and A. Rinaldo, “The scaling structure of the global road network,” Royal Society Open Science, vol. 4, p. 170590, 2017
2017
-
[10]
Digital urban sensing: A multi-layered approach,
E. Zhu, M. Khan, P. Kats, S. Santosh Bamne, and S. Sobolevsky, “Digital urban sensing: A multi-layered approach,” arXiv e-prints, 2018. 1809.01280
2018 arXiv
-
[11]
Active travel for all? The surge in public bike-sharing programs,
C. Schmidt, “Active travel for all? The surge in public bike-sharing programs,” Environmental Health Perspectives, vol. 128, Aug 2018. available at https://doi. org/10.1289/EHP3754
2018 doi
-
[12]
Bike share in the U.S.: 2017,
“Bike share in the U.S.: 2017,” tech. rep., National Association of City Transportation Officials, May 2018. Available at https://nacto.org/ bike-share-statistics-2017/
2017
-
[13]
Model-based count series clustering for bike sharing system usage mining: A case study with the V´ elib’ system of Paris,
C. Etienne and O. Latifa, “Model-based count series clustering for bike sharing system usage mining: A case study with the V´ elib’ system of Paris,” ACM Transactions on Intelligent Systems and Technology, vol. 5, no. 3, pp. 1–21, 2014
2014
-
[14]
Bike share: A synthesis of the litera- ture,
E. Fishman, S. Washington, and N. Haworth, “Bike share: A synthesis of the litera- ture,” Transport Reviews, vol. 33, no. 2, pp. 148–165, 2013
2013
-
[15]
The structure of spatial net- works and communities in bicycle sharing systems,
M. Z. Austwick, O. O’Brien, E. Strano, and M. Viana, “The structure of spatial net- works and communities in bicycle sharing systems,” PloS One, vol. 8, no. 9, p. e74685, 2013
2013
-
[16]
Community structures, inter- actions and dynamics in London’s bicycle sharing network,
F. Munoz-Mendez, K. Han, K. Klemmer, and S. Jarvis, “Community structures, inter- actions and dynamics in London’s bicycle sharing network,” in Proceedings of the 2018 ACM International Joint Conference and 2018 International Symposium on Pervasive and Ubiquitous Computing and...
2018
-
[17]
Madrid cycle track: Visualizing the cyclable city,
G. Romanillos and M. Zaltz Austwick, “Madrid cycle track: Visualizing the cyclable city,” Journal of Maps, vol. 12, no. 5, pp. 1218–1226, 2016
2016
-
[18]
The pulse of the cycling city: Visualising Madrid bike share system GPS routes and cycling flow,
G. Romanillos, B. Moya-G´ omez, M. Zaltz-Austwick, and P. J. Lam´ ıquiz-Daud´ en, “The pulse of the cycling city: Visualising Madrid bike share system GPS routes and cycling flow,” Journal of Maps, vol. 14, no. 1, pp. 34–43, 2018. 35
2018
-
[19]
Where do bikeshare bikes actually go? An analysis of capital bikeshare trips using GPS data,
J. Wergin and R. Buehler, “Where do bikeshare bikes actually go? An analysis of capital bikeshare trips using GPS data,” Transportation Research Record, vol. 2662, 01 2018
2018
-
[20]
Planning for bike share connectivity to rail transit,
G. P. Griffin and I. N. Sener, “Planning for bike share connectivity to rail transit,” Journal of Public Transportation, vol. 19, pp. 1–22, 2016
2016
-
[21]
Data-driven strategies for optimal bicycle network growth,
L. Natera, F. Battiston, G. I˜ niguez, and M. Szell, “Data-driven strategies for optimal bicycle network growth,” July 2019. arXiv:1907.07080
2019 arXiv
-
[22]
Temporal networks,
P. Holme and J. Saram¨ aki, “Temporal networks,” Physics Reports, vol. 519, no. 3, pp. 97–125, 2012
2012
-
[23]
Modern temporal network theory: A colloquium,
P. Holme, “Modern temporal network theory: A colloquium,” The European Physical Journal B, vol. 88, no. 9, 2015
2015
-
[24]
Community detection in networks: A user guide,
S. Fortunato and D. Hric, “Community detection in networks: A user guide,” Physics Reports, vol. 659, pp. 1–44, 2016
2016
-
[25]
Multilayer networks,
M. Kivel¨ a, A. Arenas, M. Barthelemy, J. P. Gleeson, Y. Moreno, and M. A. Porter, “Multilayer networks,” Journal of Complex Networks, vol. 2, no. 3, pp. 203–271, 2014
2014
-
[26]
Multilayer networks in a nutshell,
A. Aleta and Y. Moreno, “Multilayer networks in a nutshell,” Annual Review of Condensed Matter Physics, vol. 10, 2019. Advance online publication, available at https://doi.org/10.1146/annurev-conmatphys-031218-013259
2019 doi
-
[27]
WHAT IS... A multilayer network,
M. A. Porter, “WHAT IS... A multilayer network,” Notices of the American Mathematical Society, vol. 65, no. 11, pp. 1419–1423, 2018
2018
-
[28]
Structural equivalence of individuals in social networks,
F. Lorrain and H. White, “Structural equivalence of individuals in social networks,” Journal of Mathematical Sociology, vol. 1, pp. 49–80, 1971
1971
-
[29]
Role discovery in networks,
R. A. Rossi and N. K. Ahmed, “Role discovery in networks,” IEEE Transactions on Knowledge and Data Engineering, vol. 27, pp. 1112–1131, 2015
2015
-
[30]
Estimation and prediction for stochastic block- structures for graphs with latent block structure,
T. A. B. Snijders and K. Nowicki, “Estimation and prediction for stochastic block- structures for graphs with latent block structure,” Journal of Classification, vol. 14, pp. 75–100, 1997
1997
-
[31]
Estimation and prediction for stochastic blockstruc- tures,
K. Nowicki and T. A. B. Snijders, “Estimation and prediction for stochastic blockstruc- tures,” Journal of the American Statistical Association, vol. 96, no. 455, pp. 1077–1087, 2001
2001
-
[32]
Stochastic blockmodels and community structure in networks,
B. Karrer and M. E. Newman, “Stochastic blockmodels and community structure in networks,” Physical Review E, vol. 83, no. 1, p. 016107, 2011
2011
-
[33]
Bayesian stochastic blockmodeling,
T. P. Peixoto, “Bayesian stochastic blockmodeling,” arXiv:1705.10225, 2018. Chapter in “Advances in Network Clustering and Blockmodeling”, edited by P. Doreian, V. Batagelj, A. Ferligoj, (John Wiley & Sons, New York City, USA [forthcoming]). 36
2018 arXiv
-
[35]
Bike angels: An analysis of Citi Bike’s incentive program,
H. Chung, D. Freund, and D. B. Shmoys, “Bike angels: An analysis of Citi Bike’s incentive program,” in COMPASS, 2018
2018
-
[36]
Finding and evaluating community structure in networks,
M. E. J. Newman and M. Girvan, “Finding and evaluating community structure in networks,” Physical Review E, vol. 69, no. 2, p. 026113, 2004
2004
-
[37]
Communities in networks,
M. A. Porter, J.-P. Onnela, and P. J. Mucha, “Communities in networks,” Notices of the American Mathematical Society, vol. 56, no. 9, pp. 1082–1097, 1164–1166, 2009
2009
-
[38]
On community structure in complex networks: challenges and opportunities,
H. Cherifi, G. Palla, B. K. Szymanski, and X. Lu, “On community structure in complex networks: challenges and opportunities,” August 2019. arXiv:1908.04901
2019 arXiv
-
[39]
Generative benchmark models for mesoscale structure in multilayer networks,
M. Bazzi, L. G. Jeub, A. Arenas, S. D. Howison, and M. A. Porter, “Generative benchmark models for mesoscale structure in multilayer networks,” arXiv:1608.06196, 2016
2016 arXiv
-
[40]
Analytical computation of the epidemic threshold on temporal networks,
E. Valdano, L. Ferreri, C. Poletto, and V. Colizza, “Analytical computation of the epidemic threshold on temporal networks,” Physical Review X, vol. 5, no. 2, p. 021005, 2015
2015
-
[41]
Kantian fractionalization pre- dicts the conflict propensity of the international system,
S. J. Cranmer, E. J. Menninga, and P. J. Mucha, “Kantian fractionalization pre- dicts the conflict propensity of the international system,” Proceedings of the National Academy of Sciences of the United States of America, vol. 112, no. 38, pp. 11812–11816, 2015
2015
-
[42]
Stochastic block models for multiplex networks: an application to a multilevel network of researchers,
P. Barbillon, S. Donnet, E. Lazega, and A. Bar-Hen, “Stochastic block models for multiplex networks: an application to a multilevel network of researchers,” Journal of the Royal Statistical Society: Series A (Statistics in Society), vol. 180, no. 1, pp. 295– 314, 2017
2017
-
[43]
The structured backbone of temporal social ties,
T. Kobayashi, T. Takaguchi, and A. Barrat, “The structured backbone of temporal social ties,” Nature Communications, vol. 10, p. 220, Jan 2019
2019
-
[44]
Network analysis of particles and grains,
L. Papadopoulos, M. A. Porter, K. E. Daniels, and D. S. Bassett, “Network analysis of particles and grains,” Journal of Complex Networks, vol. 6, no. 4, pp. 485–565, 2018
2018
-
[45]
Community structure in time-dependent, multiscale, and multiplex networks,
P. J. Mucha, T. Richardson, K. Macon, M. A. Porter, and J.-P. Onnela, “Community structure in time-dependent, multiscale, and multiplex networks,” Science, vol. 328, no. 5980, pp. 876–878, 2010
2010
-
[46]
Null models and modularity based community detection in multi-layer networks,
S. Paul and Y. Chen, “Null models and modularity based community detection in multi-layer networks,” arXiv:1608.00623, 2016
2016 arXiv
-
[47]
Multilayer stochastic block models reveal the multilayer structure of complex networks,
T. Valles-Catala, F. A. Massucci, R. Guimera, and M. Sales-Pardo, “Multilayer stochastic block models reveal the multilayer structure of complex networks,” Physical Review X, vol. 6, no. 1, p. 011036, 2016. 37
2016
-
[48]
Clustering network layers with the strata multilayer stochastic block model,
N. Stanley, S. Shai, D. Taylor, and P. J. Mucha, “Clustering network layers with the strata multilayer stochastic block model,” IEEE Transactions on Network Science and Engineering, vol. 3, no. 2, pp. 95–105, 2016
2016
-
[49]
Detecting communities and their evo- lutions in dynamic social networks—A Bayesian approach,
T. Yang, Y. Chi, S. Zhu, Y. Gong, and R. Jin, “Detecting communities and their evo- lutions in dynamic social networks—A Bayesian approach,”Machine Learning, vol. 82, pp. 157–189, Feb 2011
2011
-
[50]
Random graph models for dynamic net- works,
X. Zhang, C. Moore, and M. E. Newman, “Random graph models for dynamic net- works,” The European Physical Journal B, vol. 90, no. 10, p. 200, 2017
2017
-
[51]
A local perspective on community structure in multilayer networks,
L. G. S. Jeub, M. W. Mahoney, P. J. Mucha, and M. A. Porter, “A local perspective on community structure in multilayer networks,” Network Science, vol. 5, no. 2, pp. 144– 163, 2017
2017
-
[52]
Dynamic stochastic blockmodels for time-evolving social networks,
K. S. Xu and A. O. Hero, “Dynamic stochastic blockmodels for time-evolving social networks,” IEEE Journal of Selected Topics in Signal Processing, vol. 8, no. 4, pp. 552– 562, 2014
2014
-
[53]
Statistical clustering of temporal networks through a dynamic stochastic block model,
C. Matias and V. Miele, “Statistical clustering of temporal networks through a dynamic stochastic block model,” Journal of the Royal Statistical Society: Series B (Statistical Methodology), vol. 79, no. 4, pp. 1119–1141, 2017
2017
-
[54]
A state-space mixed membership blockmodel for dynamic network tomography,
E. P. Xing, W. Fu, and L. Song, “A state-space mixed membership blockmodel for dynamic network tomography,” The Annals of Applied Statistics, vol. 4, pp. 535–566, 06 2010
2010
-
[55]
Evolving cluster mixed-membership blockmodel for time-varying networks,
Q. Ho, L. Song, and E. P. Xing, “Evolving cluster mixed-membership blockmodel for time-varying networks,” in Proceedings of the 14th International Conference on Artificial Intelligence and Statistics (G. Gordon, D. Dunson, and M. Dudik, eds.), pp. 342–350, 2011
2011
-
[56]
Community discovery in dynamic networks: A survey,
G. Rossetti and R. Cazabet, “Community discovery in dynamic networks: A survey,” ACM Comput. Surv., vol. 51, pp. 35:1–35:37, feb 2018
2018
-
[57]
Shared bicycles in a city: A signal processing and data analysis perspective,
P. Borgnat, P. Abry, P. Flandrin, C. Robardet, J.-B. Rouquier, and E. Fleury, “Shared bicycles in a city: A signal processing and data analysis perspective,” Advances in Complex Systems, vol. 14, no. 03, pp. 415–438, 2011
2011
-
[58]
The map equation,
M. Rosvall, D. Axelsson, and C. T. Bergstrom, “The map equation,” The European Physical Journal Special Topics, vol. 178, pp. 13–23, Nov 2009
2009
-
[59]
Examining travel patterns and characteristics in a bike- sharing network and implications for data-driven decision supports: Case study in the Washington DC area,
X.-F. Xie and Z. J. Wang, “Examining travel patterns and characteristics in a bike- sharing network and implications for data-driven decision supports: Case study in the Washington DC area,” Journal of Transport Geography, vol. 71, pp. 84–102, 2018
2018
-
[60]
Designing bike networks using the concept of network clusters,
M. Akbarzadeh, S. S. Mohri, and E. Yazdian, “Designing bike networks using the concept of network clusters,” Applied Network Science, vol. 3, no. 1, p. 12, 2018. 38
2018
-
[61]
Intertemporal community detection in bikeshare networks,
M. He, J. Glasser, S. Bhamidi, and N. Kaza, “Intertemporal community detection in bikeshare networks,” 2019. arXiv:1906.04582
2019 arXiv
-
[62]
A semiparametric extension of the stochas- tic block model for longitudinal networks: Semiparametric estimation in PPSBM,
C. Matias, T. Rebafka, and F. Villers, “A semiparametric extension of the stochas- tic block model for longitudinal networks: Semiparametric estimation in PPSBM,” Biometrika, vol. 105, pp. 665–680, 06 2018
2018
-
[63]
Citi Bike System Data,
NYCBS, “Citi Bike System Data,” 2017. Available at https://s3.amazonaws.com/ tripdata/201610-citibike-tripdata.zip; last checked 2019-05-05
2017
-
[64]
Bay Area Bike Share Open Data,
Bay Area Bike Share, “Bay Area Bike Share Open Data,” 2017. Available at https: //s3.amazonaws.com/babs-open-data/babs_open_data_year_3.zip last checked 2019-05-05; Archived main site: https://web.archive.org/web/20170303021745/ http://www.bayareabikeshare.com/open-data
2017
-
[65]
Metro Bike Share Trip Data,
LA Metro, “Metro Bike Share Trip Data,” 2017. Available at https://bikeshare. metro.net/wp-content/uploads/2017/01/Metro_trips_Q4_2016.zip; last checked 2019-05-05; the version was last modified on 2018-09-17
2017
-
[66]
M. E. J. Newman, Networks. Oxford, UK: Oxford University Press, Inc., second ed., 2018
2018
-
[67]
TP19: Spatial networks and human mobility: An application of the inter- vening opportunities model to the london cycle hire scheme
A. Taiyeb, “TP19: Spatial networks and human mobility: An application of the inter- vening opportunities model to the london cycle hire scheme.” Undergraduate Thesis, Department of Physics, University of Oxford (available at https://www.math.ucla. edu/~mason/research/aqil-TP19...
2014
-
[68]
Stochastic blockmodels: First steps,
P. W. Holland, K. B. Laskey, and S. Leinhardt, “Stochastic blockmodels: First steps,” Social Networks, vol. 5, no. 2, pp. 109–137, 1983
1983
-
[69]
Blockmodels: Interpretation and evaluation,
K. Faust and S. Wasserman, “Blockmodels: Interpretation and evaluation,” Social Networks, vol. 14, pp. 5–61, 1992
1992
-
[70]
Mixed membership stochas- tic blockmodels,
E. M. Airoldi, D. M. Blei, S. E. Fienberg, and E. P. Xing, “Mixed membership stochas- tic blockmodels,” Journal of Machine Learning Research, vol. 9, pp. 1981–2014, 2008
1981
-
[71]
Leger, Blockmodels: Latent and stochastic block model estimation by a ‘V-EM’ algorithm
INRA and J.-B. Leger, Blockmodels: Latent and stochastic block model estimation by a ‘V-EM’ algorithm. INRA, 1.1.1 ed., 2015. R package version 1.1.1
2015
-
[72]
Oriented and degree-generated block models: Gen- erating and inferring communities with inhomogeneous degree distributions,
Y. Zhu, X. Yan, and C. Moore, “Oriented and degree-generated block models: Gen- erating and inferring communities with inhomogeneous degree distributions,” Journal of Complex Networks, vol. 2, no. 1, pp. 1–18, 2013
2013
-
[73]
On equivalence of likelihood maximization of stochastic block model and constrained nonnegative matrix factorization,
Z.-Y. Zhang, Y. Gai, Y.-F. Wang, H.-M. Cheng, and X. Liu, “On equivalence of likelihood maximization of stochastic block model and constrained nonnegative matrix factorization,” Physica A, vol. 503, pp. 687–697, 2018
2018
-
[74]
Stan: A probabilistic programming language,
B. Carpenter, A. Gelman, M. Hoffman, D. Lee, B. Goodrich, M. Betancourt, M. Brubaker, J. Guo, P. Li, and A. Riddell, “Stan: A probabilistic programming language,” Journal of Statistical Software, Articles, vol. 76, pp. 1–32, 2017. 39
2017
-
[75]
RStan: The R interface to Stan,
Stan Development Team, “RStan: The R interface to Stan,” 2018. R package version 2.18.2
2018
-
[76]
An efficient heuristic procedure for partitioning graphs,
B. W. Kernighan and S. Lin, “An efficient heuristic procedure for partitioning graphs,” Bell System Technical Journal, vol. 49, no. 2, pp. 291–307, 1970
1970
-
[77]
R Foun- dation for Statistical Computing, Vienna, Austria, 2018
R Core Team, R: A Language and Environment for Statistical Computing. R Foun- dation for Statistical Computing, Vienna, Austria, 2018
2018
-
[78]
Rcpp: Seamless R and C++ integration,
D. Eddelbuettel and R. Fran¸ cois, “Rcpp: Seamless R and C++ integration,” Journal of Statistical Software, vol. 40, no. 8, pp. 1–18, 2011
2011
-
[79]
City of Los Angeles GIS Data: Zoning,
Department of City Planning, City of Los Angeles, “City of Los Angeles GIS Data: Zoning,” 2015
2015
-
[80]
Generalized summary of zoning regulations of city of Los Angeles,
Department of City Planning, City of Los Angeles, “Generalized summary of zoning regulations of city of Los Angeles,” January 2006
2006
-
[81]
San Francisco residents relying less on private auto- mobiles,
D. Weikel and S. Karlamangla, “San Francisco residents relying less on private auto- mobiles,” Los Angeles Times, February 23 2015
2015
-
[82]
NYC zoning districts,
Department of City Planning, New York City, “NYC zoning districts,” March 2018
2018
-
[83]
A new look at the statistical model identification,
H. Akaike, “A new look at the statistical model identification,” in Selected Papers of Hirotugu Akaike, pp. 215–222, Berlin, Germany: Springer-Verlag, 1974
1974
-
[84]
Bayesian model selection of stochastic block models,
X. Yan, “Bayesian model selection of stochastic block models,” in Proceedings of the 2016 IEEE/ACM International Conference on Advances in Social Networks Analysis and Mining, pp. 323–328, IEEE Press, 2016
2016
-
[85]
Model selection for degree-corrected block models,
X. Yan, C. Shalizi, J. E. Jensen, F. Krzakala, C. Moore, L. Zdeborov´ a, P. Zhang, and Y. Zhu, “Model selection for degree-corrected block models,” Journal of Statistical Mechanics: Theory and Experiment, vol. 2014, no. 5, p. P05007, 2014
2014
-
[86]
The ground truth about metadata and community detection in networks,
L. Peel, D. B. Larremore, and A. Clauset, “The ground truth about metadata and community detection in networks,” Science Advances, vol. 3, no. 5, p. e1602548, 2017
2017
-
[87]
Models for effective deployment and redistribution of bicycles within public bicycle-sharing systems,
J. Shu, M. Chou, Q. Liu, C. Teo, and I.-L. Wang, “Models for effective deployment and redistribution of bicycles within public bicycle-sharing systems,” Operations Research, vol. 61, pp. 1346–1359, 11 2013
2013
-
[88]
Dynamic vehicle redis- tribution and online price incentives in shared mobility systems,
J. Pfrommer, J. Warrington, G. Schildbach, and M. Morari, “Dynamic vehicle redis- tribution and online price incentives in shared mobility systems,” IEEE Transactions on Intelligent Transportation Systems, vol. 15, pp. 1567–1578, Aug 2014
2014
-
[89]
Predicting bike usage for new york city’s bike sharing system,
D. Singhvi, S. Singhvi, P. I. Frazier, S. G. Henderson, E. O. Mahony, D. B. Shmoys, and D. B. Woodard, “Predicting bike usage for new york city’s bike sharing system,” in Association for the Advancement of Artificial Intelligence Proceedings, 2015. 40
2015
-
[90]
A 3-step math heuristic for the static repositioning problem in bike-sharing systems,
I. Forma, T. Raviv, and M. Tzur, “A 3-step math heuristic for the static repositioning problem in bike-sharing systems,” Transportation Research Part B: Methodological, vol. 71, pp. 230–247, 01 2015
2015
-
[91]
Unrav- elling daily human mobility motifs,
C. M. Schneider, V. Belik, T. Couronn´ e, Z. Smoreda, and M. C. Gonz´ alez, “Unrav- elling daily human mobility motifs,” Journal of The Royal Society Interface, vol. 10, p. 20130246, 2013
2013
-
[92]
Understanding individual human mobility patterns,
M. C. Gonz´ alez, C. A. Hidalgo, and A.-L. Barab´ asi, “Understanding individual human mobility patterns,” Nature, vol. 453, no. 7196, p. 779, 2008
2008
-
[93]
The laws of migration,
E. J. Ravenstein, “The laws of migration,” Journal of the Statistical Society, vol. 46, pp. 167–235, 1885
-
[94]
Temporal scale of dynamic networks,
R. S. Caceres and T. Berger-Wolf, “Temporal scale of dynamic networks,” in Temporal Networks (P. Holme and J. Saram¨ aki, eds.), (Berlin, Germany), pp. 65–94, Springer- Verlag, 2013
2013
-
[95]
Null models for community detection in spatially embedded, temporal networks,
M. Sarzynska, E. A. Leicht, G. Chowell, and M. A. Porter, “Null models for community detection in spatially embedded, temporal networks,” Journal of Complex Networks, vol. 4, no. 3, pp. 363–406, 2016
2016
-
[96]
Finding community structure in networks using the eigenvectors of matrices,
M. E. J. Newman, “Finding community structure in networks using the eigenvectors of matrices,” Physical Review E, vol. 74, no. 3, p. 036104, 2006
2006
-
[97]
Configuring random graph models with fixed degree sequences,
B. K. Fosdick, D. B. Larremore, J. Nishimura, and J. Ugander, “Configuring random graph models with fixed degree sequences,” SIAM Review, vol. 60, no. 2, pp. 315–355, 2018
2018
-
[98]
Equivalence between modularity optimization and maximum like- lihood methods for community detection,
M. E. J. Newman, “Equivalence between modularity optimization and maximum like- lihood methods for community detection,” Physical Review E, vol. 94, no. 5, p. 052315, 2016
2016
-
[99]
Relating modularity maximization and stochastic block models in multilayer networks,
A. R. Pamfil, S. D. Howison, R. Lambiotte, and M. A. Porter, “Relating modularity maximization and stochastic block models in multilayer networks,” SIAM Journal on Mathematics of Data Science (in press; arXiv:1804.01964), 2019
2019 arXiv
-
[100]
Uncovering space- independent communities in spatial networks,
P. Expert, T. S. Evans, V. D. Blondel, and R. Lambiotte, “Uncovering space- independent communities in spatial networks,” Proceedings of the National Academy of Sciences of the United States of America, vol. 108, pp. 7663–7668, 2011. 41
2011
Reviewed August 14, 2026 · model on record in the stance chip above.
Discussion (0). Continue with ORCID to comment.