REVIEW 4 major objections 5 minor 9 references
Exploring and Reshaping the Weight Distribution in LLM
T0 review · 4 major / 5 minor · reviewed 2026-08-05 · deepseek-v4-flash
Pith's one-line read The paper argues that cosine distances between singular-value vectors of LLM weight matrices form power-law distributions, and that reshaping LoRA initialization to match a larger model's distribution improves fine-tuning.
desk verdict A simple, genuinely new LoRA-initialization heuristic built on a shaky empirical foundation—worth a careful referee, not a pass. read the letter →
The pith
A machine-rendered reading of the paper's core claim, the machinery that carries it, and where it could break.
The reading
What carries the argument
The central object is the Matrix of Singular Values (MSV): each projection type's top-r singular values from every layer are stacked into one matrix, and the cosine distance (DSV) between singular-value vectors across MSVs is measured. The load-bearing step is the distribution generator that creates synthetic weight matrices whose pairwise DSV profile—power-law or Gaussian—matches a reference model; those generated matrices are then used to initialize LoRA's low-rank A and B matrices. The qualitative reference-weight grouping (RW/member) is what carries the transfer: it tells the generator which projection types should be treated as close neighbors.
What would settle it
Run the same LoRA fine-tuning on SmolLM2-135M with initialization reshaped to the reference model's DSV signature, and compare against the same initialization with the assignment of the seven projection types to reference groups randomly permuted; if the permuted version performs equally well, the claimed transfer mechanism is falsified.
Extended reading notes
Core claim
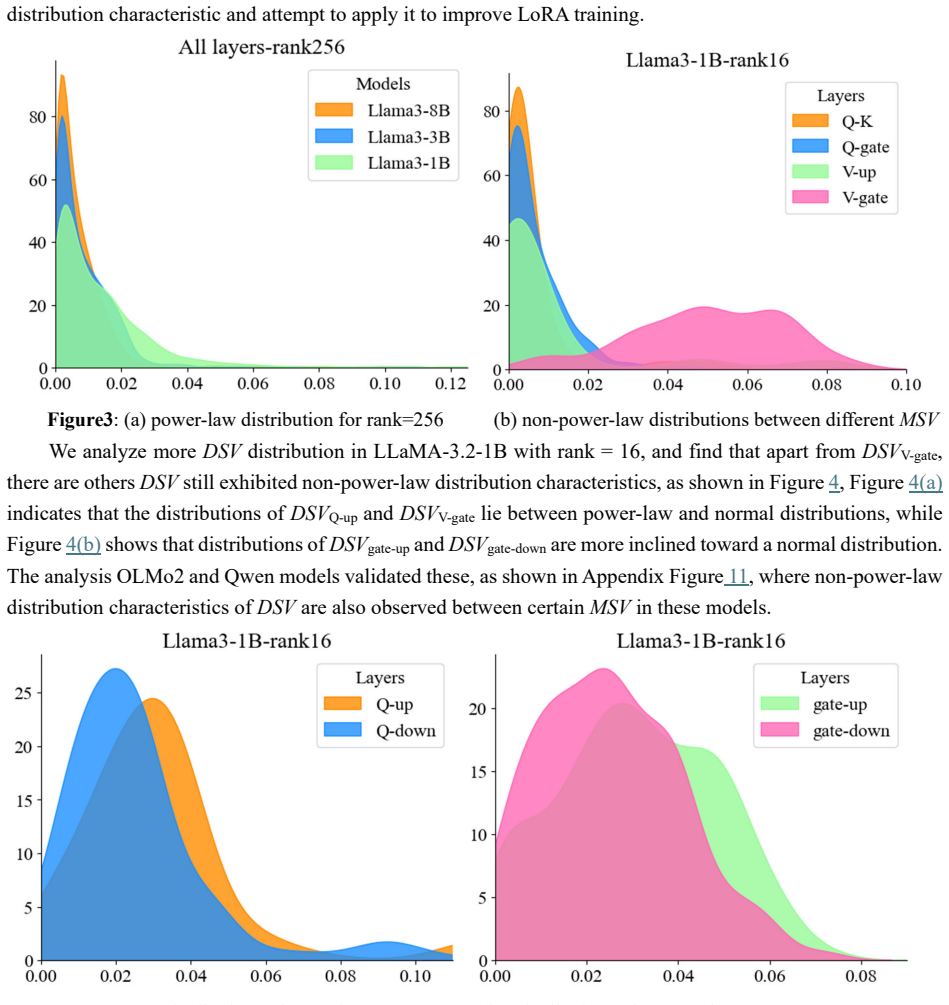
Using decoder-only LLaMA models and then OLMo, Qwen, and SmolLM2, the authors compute singular-value vectors (SVr) from Q, K, V, O, gate, up, and down projection matrices in each layer, group same-type vectors into a Matrix of Singular Values (MSV), and evaluate the cosine distance DSV between these vectors. Their central empirical claim is that the DSV values between MSVs display a power-law distribution in the large majority of cases, at ranks 16, 64, and 256, across all tested model families; some pairs (for example DSV between V-proj and gate-proj, or gate-up and gate-down) instead resemble normal or intermediate distributions. They interpret this as evidence that within a model, most pr
Load-bearing premise
The whole transfer step rests on the untested assumption that a larger model's weight distribution is inherently more reasonable, so reshaping a small model's LoRA weights to imitate it is what causes the measured gains.
Editorial extensions
If this is right
- The DSV power-law profile is reusable as a structural descriptor of an LLM's internal weight organization, distinct from raw parameter statistics.
- LoRA fine-tuning can be improved without altering model architecture, training objective, or the number of trainable parameters; the change is confined to initialization.
- In the reported experiments, using the largest available reference model (LLaMA3-8B) gives the most consistent gains across both target models and all three benchmarks.
- Because the reshaping happens only at initialization, it adds no overhead to LoRA inference and does not change the fine-tuning pipeline beyond the initial values.
Reading between the lines
- A direct comparison against other singular-component LoRA initializations on the same benchmarks would clarify whether the gain comes from matching a distribution signature or simply from any non-default structured initialization.
- A scrambled-reference control—permuting which projection types are treated as members of which reference group—would test whether the specific DSV signature is causal or whether any power-law-like initialization helps.
- The paper's assumption that a larger model's distribution is inherently more reasonable could be replaced by a quantitative model-similarity metric built from fitted power-law exponents and group memberships; the reported alpha values (1.05–2.9) suggest such a metric is feasible.
- The generator could be used to initialize adapters in other parameter-efficient fine-tuning methods or to synthesize weight matrices for probing experiments, but the paper does not test those uses.
Editorial analysis
A structured set of objections, weighed in public.
Referee Report
Summary. This paper studies the cosine distances between the top-r singular-value vectors (SV) of weight projection matrices in LLMs. It claims that, across LLaMA, OLMo, Qwen, and SmolLM models, these cosine distances (DSV) are typically power-law distributed, while some block-type pairs deviate toward normal. It then proposes a qualitative method for describing a model's distribution characteristics, designs a Gaussian/Pareto-based generator to produce matrices whose pairwise DSV follows a desired distribution, and uses this generator to reshape LoRA initialization for a smaller model using a larger 'reference' model. Experiments on SmolLM2-135M and LLaMA3.2-1B with LoRA fine-tuning report small accuracy gains on GPQA, ARC-Challenge, and HellaSwag. The central claims are that DSV power-law behavior is widespread and that matching a larger model's DSV distribution improves LoRA training.
Significance. If the distributional claim and the reshaping effect were firmly established, this would be a practically interesting low-cost LoRA initialization scheme. The paper's strengths are its broad empirical coverage across multiple model families and scales, and its simple, computationally cheap method. However, as presented, the evidence is not sufficient for the claims: the power-law classification rests on visual inspection and a naive fit without goodness-of-fit statistics, the generator validation is circular by construction, and no manipulation check shows that the reshaped LoRA tensors actually possess the reference distribution. The paper also provides no code, no uncertainty quantification, and no statistical comparison against alternative initialization controls. Hence the significance of the claimed contribution is currently not established.
major comments (4)
- [§2.2, Table 1 and Figures 2-4] The power-law claim is supported only by visual inspection of histograms and by fitting scipy.stats.genpareto without reporting goodness-of-fit statistics, confidence intervals, or comparisons against alternative distributions (e.g., log-normal, exponential, Weibull). For the per-MSV-pair histograms that drive the qualitative classification, each pair contributes only 16×16=256 distances, which is too small to identify a tail law reliably. Even for the aggregated all-SV distributions, no statistical test is given. Since the qualitative method and all subsequent reshaping depend on classifying distributions as power-law vs non-power-law, this is load-bearing, not a presentation issue.
- [§3.2, Figure 8] The distribution generator is designed so that the claimed effect holds by construction. Matrix B is generated by adding Gaussian increments to Gaussian template A, where the number of increments p is drawn from a Pareto distribution. For small p, the distance between A and B will be small and concentrated near zero, which naturally produces a power-law-looking DSV distribution. Figure 8 is therefore a sanity check of the implementation, not independent validation of any empirical relationship. The statement that the generator 'can be used to construct A and B matrices whose data and DSV all conform to the expected distribution' is true by design and gives no support to the paper's empirical power-law claim. Additionally, the truncation 'if p > n, replace p with n' changes the intended Pareto count distribution, but its effect is not analyzed.
- [§4.1, §4.2] The causal link from reference-model distribution to improved LoRA training is missing. The validation in §3.2 is performed only on synthetic matrices; the reshaped lora_A and lora_B tensors are never analyzed to confirm that their pairwise DSV distribution matches the reference model's distribution. Without this manipulation check, the benchmark differences in Table 4 cannot be attributed to 'reshaping according to the reference distribution.' They could be due to incidental properties of the generator, such as a shared Gaussian template, sparse large increments, or a different initialization scale, all of which can affect optimization independently of the reference model. The assumption that 'the larger model with more weights is more reasonable' (stated in §4.1) is asserted without any controlled test, such as comparing against a same-size or shuffled reference distribution.
- [§4.2, Table 4] The reported improvements are small and not statistically established. For example, SmolLM135M-(Smo-1.7B) on HellaSwag is 0.4364 vs 0.4386 for normal LoRA (i.e., worse), and on ARC-Challenge the gain is 0.2995 vs 0.2978, within a typical run-to-run variation. No error bars, repeated seeds, or significance tests are provided. The claim in the abstract that the method 'achieves a certain improvement' is therefore not supported. A comparison against other initialization schemes (e.g., Gaussian initialization with matched variance, or random orthogonal initialization) is also missing, so even the direction of the effect is unclear.
minor comments (5)
- [§2.1, Eq. (1)] The SVD notation is garbled: 'X = U s V' with inconsistent matrix dimensions, and the formula for cosine distance is written with an equals sign inside the sum. Please use standard notation and clarify that s is the diagonal matrix of singular values.
- [Figure 2 and text around Eq. (2)] The heatmap is described as showing cosine similarity while the text says 'distance.' Please be consistent and specify whether the plotted values are similarity or distance.
- [§3.2] The term 'Gaussian Process' is used for what appears to be a Gaussian random count or Gaussian increment; a Gaussian process is a different object. Please choose terminology that matches the actual procedure.
- [Table 4 and Appendix Table 5] The experimental setup is underspecified: LoRA rank, target modules, number of random seeds, and evaluation prompts are not given. The 'SmolLM' row (without LoRA) should be clearly distinguished from 'SmolLM135M-LoRA.'
- [Throughout] There are numerous typos and formatting issues: e.g., 'It is not aa easy work', 'non-poer-law', 'Pissia' should be 'PiSSA', and the reference list contains inconsistent capitalization. A careful proofread is needed.
Circularity Check
Generator validation is circular by construction, but the central LoRA benchmark comparison is an independent empirical test.
-
self definitional
[Section 3.2, 'Simulating distribution with randoms', and Figure 8]
"If the distance DSVA-B between matrices A and B approximates power-law distribution, indicating that the data in matrices A and B differ only slightly. Suppose the data in matrix A follow Gaussian distribution. Then we generate a number of random numbers whose count follows Pareto distribution. Add these data to matrix A and get the final matrix B. It is expected the distance between A and B follows power-law distribution."
The generator defines B as A plus Gaussian increments whose count p is drawn from a Pareto distribution (Step 2). Therefore the number of nonzero differences between B and A is Pareto-distributed by design, and the cosine distance DSV(A,B) is dominated by that sparse Pareto count. Figure 8's power-law DSV is an algebraic consequence of the construction, not an independent empirical validation. The paper presents it as evidence that 'the distribution generator can be used to construct A and B matrices whose data and DSV between the data all conform to the expected distribution,' but this is the same property that was engineered into the generator. It does not verify that real model MSVs or the reshaped LoRA matrices actually possess the reference model's DSV distribution.
full rationale
The only clear circularity is in Section 3.2: the synthetic generator is constructed so that the distance between A and B is controlled by a Pareto-distributed increment count, so the Figure 8 match is a circular confirmation rather than an independent test. This does not, however, make the central LoRA claim circular: the benchmark experiments (GPQA, Arc_Challenge, HellaSwag) compare reshaped LoRA against normal LoRA and the pre-trained model on external datasets, so the reported improvements are empirically testable and not forced by the construction. The paper's assumption that a larger model's weight distribution is 'more reasonable' is unsupported and may be a confound, but it is an assumption, not a circular reduction. No load-bearing self-citations were found; the references are external. The score reflects one definitional circular step in a supporting validation, while the main empirical claim retains independent content.
Assumptions & free parameters
free parameters (4)
- Pareto alpha per model =
1.78, 2.86, 2.9, 2.18, 1.94, 1.42, 1.05 (Table 1)
- Rank r for SVD =
16, 64, 256
- Gaussian template parameters (mu, sigma)
- Pareto parameters for count p
assumptions (5)
- domain assumption Singular-value vectors of weight matrices are representative features of layer weight distributions.
- domain assumption Cosine distance distribution between SV is a meaningful descriptor of model similarity and quality.
- ad hoc to paper Larger models have more reasonable weight distributions, so mimicking them improves smaller models.
- ad hoc to paper The distribution generator produces data with the intended DSV distribution.
- ad hoc to paper Classification of DSV distributions as power-law versus non-power-law by visual inspection is reliable.
Cite this review
Pith. "Pith review of Exploring and Reshaping the Weight Distribution in LLM." pith.science (2026). https://pith.science/paper/UC3BSUIO
@misc{pith2026250900046,
  author       = {Pith},
  title        = {Pith review of: Exploring and Reshaping the Weight Distribution in LLM},
  year         = {2026},
  howpublished = {\url{https://pith.science/paper/UC3BSUIO}},
  note         = {Machine review of arXiv:2509.00046}
}
read the original abstract
The performance of Large Language Models is influenced by their characteristics such as architecture, model sizes, decoding methods and so on. Due to differences in structure or function, the weights in different layers of large models have varying distributions. This paper explores the correlations between different types of layers in terms of weights distribution and studies the potential impact of these correlations on LoRA training effectiveness. Firstly, the study reveals that in the model the cosine distances between weights of different layers manifest power-law distribution. We extract Query-projection, down-projection and other weight matrices from the self-attention layers and MLP layers, calculate the singular values of the matrices using singular value decomposition, and organize a certain number of singular values into matrices according to projection's type. By analyzing the probability distribution of the cosine distances between these matrices, it is found that the cosine distances values between them have distinct power-law distribution characteristics. Secondly, based on the results of distance calculations and analysis across different layers of model, a qualitative method is proposed to describe the distribution characteristics of different models. Next, to construct weights that align with the distribution characteristics, a data generator is designed using a combination of Gaussian process and Pareto distribution functions. The generator is used to simulate the generation of data that aligns with specific distribution characteristics. Finally, based on the aforementioned distribution characteristics and data generation method, the weights in LoRA initialization are reshaped for training. Experimental results indicate that, without altering the model structure or training process, this method achieves a certain improvement in the performance of LoRA training.
Figures


Figures from the paper (11 more)


Reference graph
Works this paper leans on
-
[2]
These research findings had improved LoRA training for large models to varying degrees
and independently training certain components to improve performance. These research findings had improved LoRA training for large models to varying degrees. However, the original intent of LoRA was to sacrifice some perfo rmance in order to reduce complexity of training and * Corresponding author minimize resource consumption. Employing overly complex me...
work page 2016
-
[3]
Huang, Z., Shao, W., Wang, X., Lin, L., & Luo, P. (2021). Rethinking the pruning criteria for convolutional neural network. Advances in Neural Information Processing Systems, 34, 16305-16318. Jiang, C., Chan, C. M., Xue, W., Liu, Q., & Guo, Y . (2025, April). Importance weighting can help large language models self-improve. In Proceedings of the AAAI Conf...
arXiv 2021
-
[4]
about small-scale models proposed an activation-aware per-channel scaling method to help bridge the performance degradation on-device LLMs. The selected salient weights which were considered more important for LLMs' performance were retained the precision of these parameters as FP16 and the other unimportant weights were quantized. Even the weights discar...
work page 2025
-
[9]
It has with no significant difference from the loss in normal LoRA fine-tuning training
The results show that the loss values stabilize and converge after about 100 steps. It has with no significant difference from the loss in normal LoRA fine-tuning training. Table 3: Characteristic of distribution for models Model Referenced Weight Member SmolLM2-135M Q-proj K-proj V-proj O-proj gate-proj up- proj down-proj SmolLM2-1.7B Q-proj K-proj V-pro...
arXiv 2018
-
[100]
Li, J., Y uan, X., & Kuruoglu, E. E. (2024). Exploring Weight Distributions and Dependence in Neural Networks With α-Stable Distributions. IEEE Transactions on Artificial Intelligence, 5(11), 5519-5529. Liu, S. Y ., Wang, C. Y ., Yin, H., Molchanov, P., Wang, Y . C. F., Cheng, K. T., & Chen, M. H. (2024, July). Dora: Weight-decomposed low-rank adaptation....
arXiv 2024
-
[1980]
Let the weight matrix in any given layer be represented by matrix X
to reduce computational complexity at the cost of some accuracy. Let the weight matrix in any given layer be represented by matrix X. Performing singular value decomposition on X yields the corresponding U, s, and V. The specifics are as follows. Let 𝑋∈𝑅 ൈ, there exist 𝑈∈𝑅 ൈ, 𝑉∈𝑅 ൈ and 𝑠∈𝑅 ൈ, then 𝑋ൌ𝑈 s𝑉 where s ൌ𝑑 𝑖 𝑎 𝑔 ሺ 𝜎ଵ, 𝜎ଶ …, 𝜎ሻ∈𝑅 ൈ. r i...
work page 2023
-
[2018]
suggested that the weights of NN models after training conform to the T-location scal e statistical distribution rather than the normal distribution. Other distribution models, such as multivariate α-stable distribution (Li et al., 2024), were also used in modeling and analyzing model parameters. Although changing and optimizing the architecture is consid...
work page 2024
-
[2024]
Others achieved better tr aining outcomes by freezing (Zhang et al., 2023)(Liu et al.,
work page 2023
Show all 9 references
-
[2025]
In addition to the models themselves, the referen ce models also include SmolLM2-1.7B and LLaMA3.2-8B- Instruct, which have more weights
and LLaMA3.2-1B-Instruct (Dubey et al., 2024). In addition to the models themselves, the referen ce models also include SmolLM2-1.7B and LLaMA3.2-8B- Instruct, which have more weights. The evaluation is conducted using three datasets: GPQA Diamond Zero-Shot, Arc_Challenge, and...
2024
Reviewed August 5, 2026 · model on record in the stance chip above.
Discussion (0). Continue with ORCID to comment.