E_(rm peak)-α Correlation in Time Resolved GRB Spectra: A Bottom-Up Approach with Optically Thin Inverse Compton Scattering Model
Pith reviewed 2026-06-28 05:07 UTC · model grok-4.3
The pith
Optically thin inverse Compton scattering produces a positive E_peak-α correlation in gamma-ray burst spectra as they evolve from hard to soft.
A machine-rendered reading of the paper's core claim, the machinery that carries it, and where it could break.
Core claim
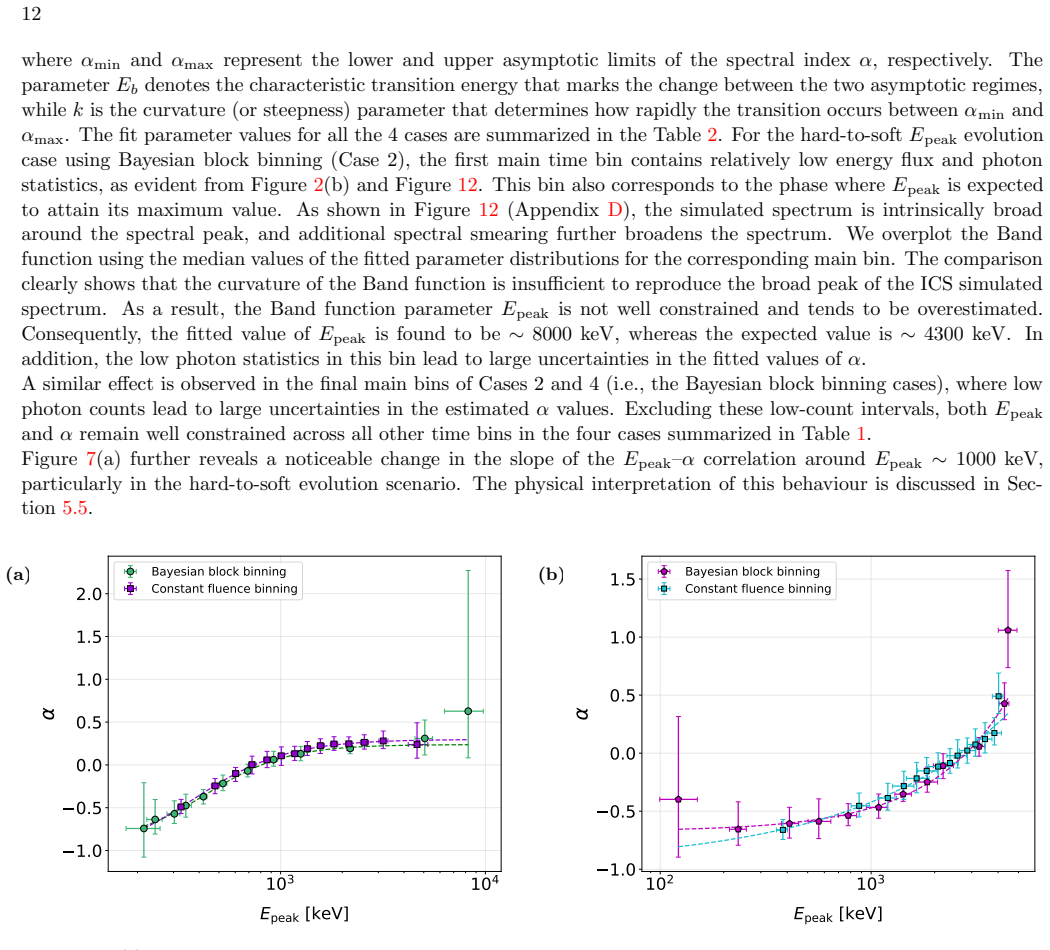
In a bottom-up simulation of optically thin inverse Compton scattering, the time-resolved spectra fitted by the Band function produce a positive E_peak-α correlation, with α evolving smoothly from Planck-like values greater than +0.5 to softer values less than -0.67. This holds for both hard-to-soft and intensity-tracking behaviors within a single emission pulse when analyzed with either Bayesian block or constant-fluence binning, and the evolution does not require invoking a switch between radiation mechanisms.
What carries the argument
The optically thin inverse Compton scattering process in a standard fireball jet, whose generated spectra when modeled by the Band function trace out the observed positive correlation in the E_peak-α plane.
If this is right
- The observed positive E_peak-α correlation in GRB data can be explained by a single radiation mechanism without transitions.
- Hard alpha values greater than +0.5 in spectra indicate optically thin ICS rather than standard synchrotron emission.
- Smooth alpha evolution within a single pulse does not require invoking a change in radiation mechanisms.
- This correlation provides a diagnostic signature for identifying the dominant prompt emission process in GRBs.
Where Pith is reading between the lines
- Confirmation would encourage detailed ICS modeling in GRB jet simulations to match time-resolved data.
- Observers could use the E_peak-α plane evolution as a primary test for mechanism identification in future bursts.
- The approach might apply to spectral analysis of other transients showing similar hard-to-soft patterns.
Load-bearing premise
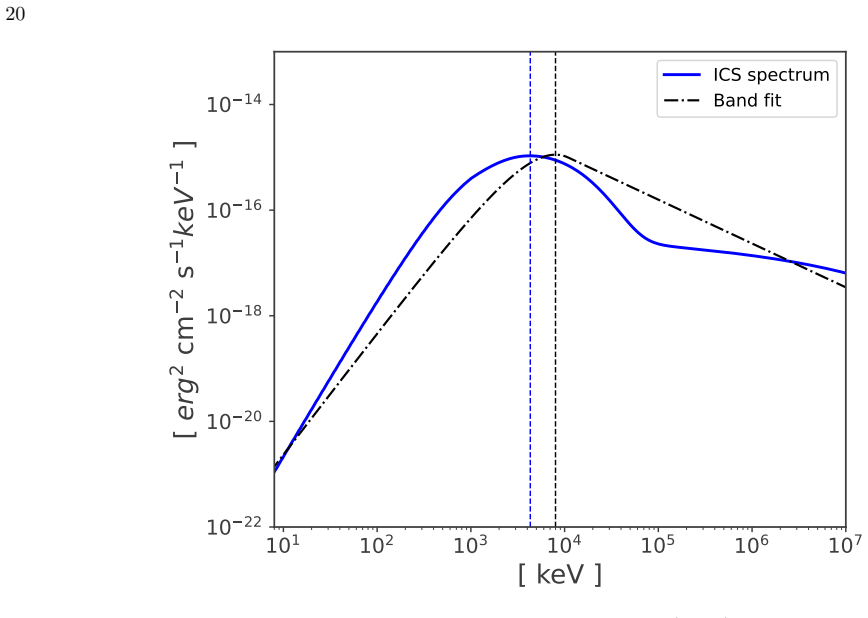
The simulated optically thin ICS spectra can be consistently and accurately represented by the empirical Band function across the full range of alpha values without systematic residuals that would alter the recovered correlation.
What would settle it
Detection of GRB pulses where alpha stays below -0.67 throughout without showing the hard-to-soft transition in the E_peak-α plane while fitting the Band function would falsify the predicted positive correlation from optically thin ICS.
Figures
read the original abstract
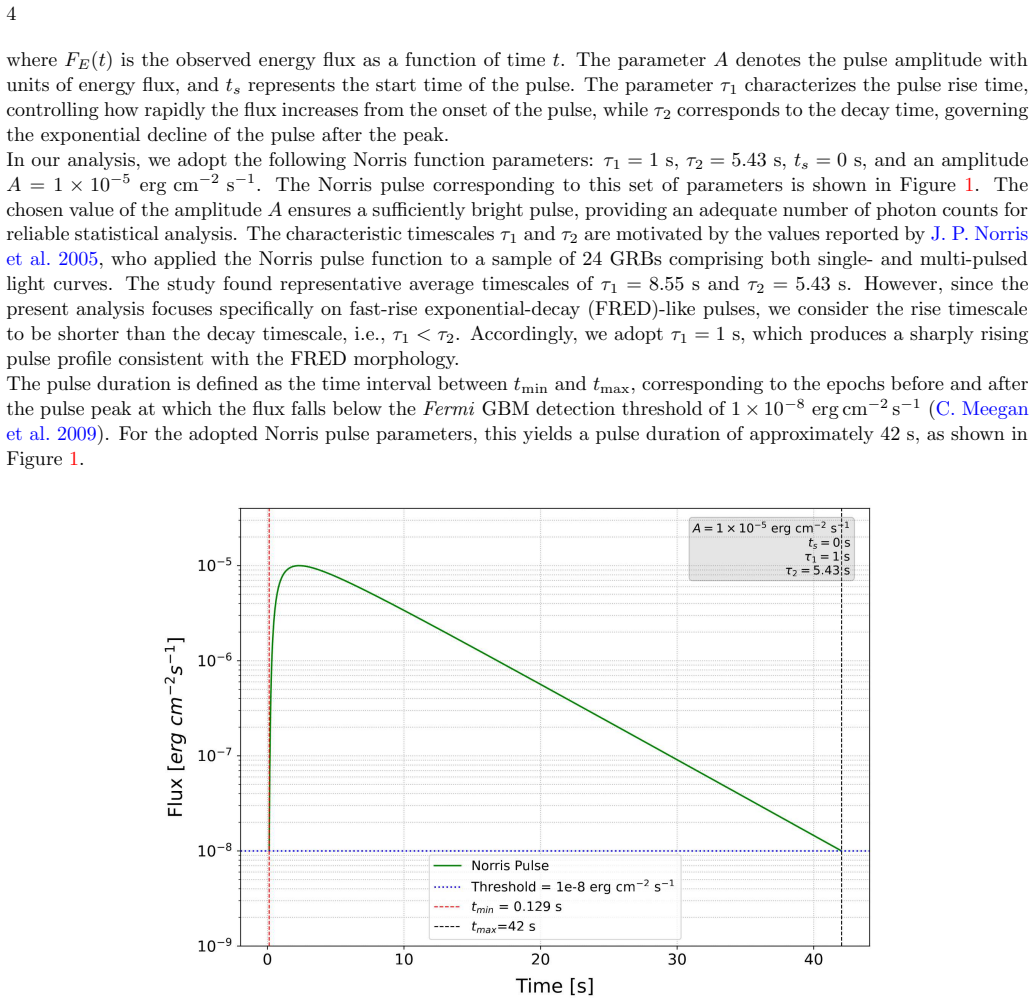
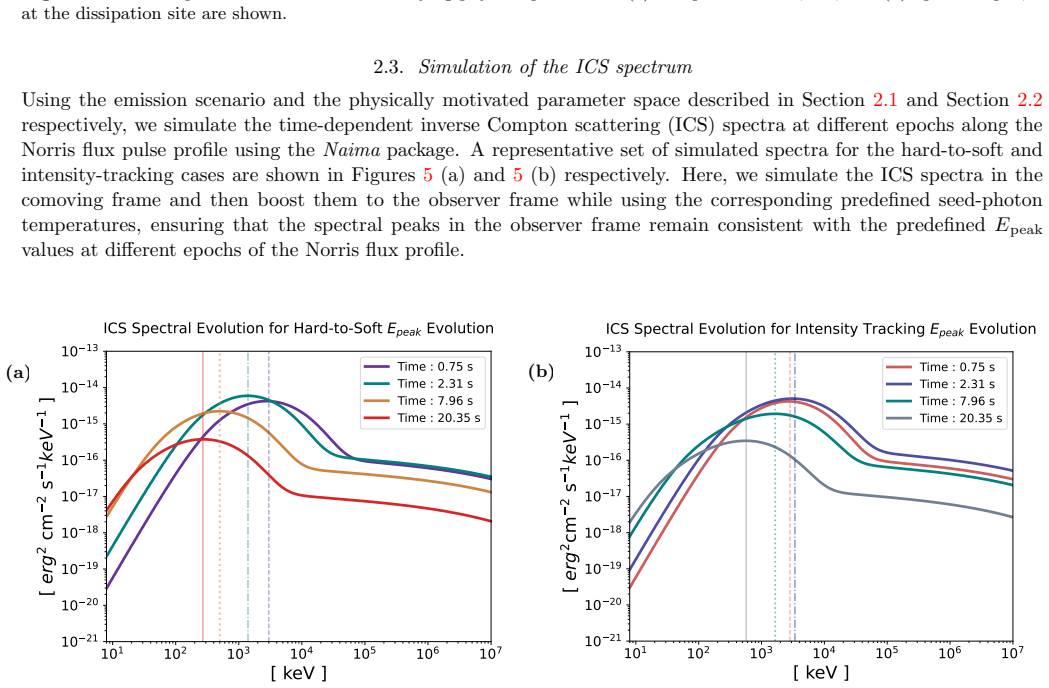
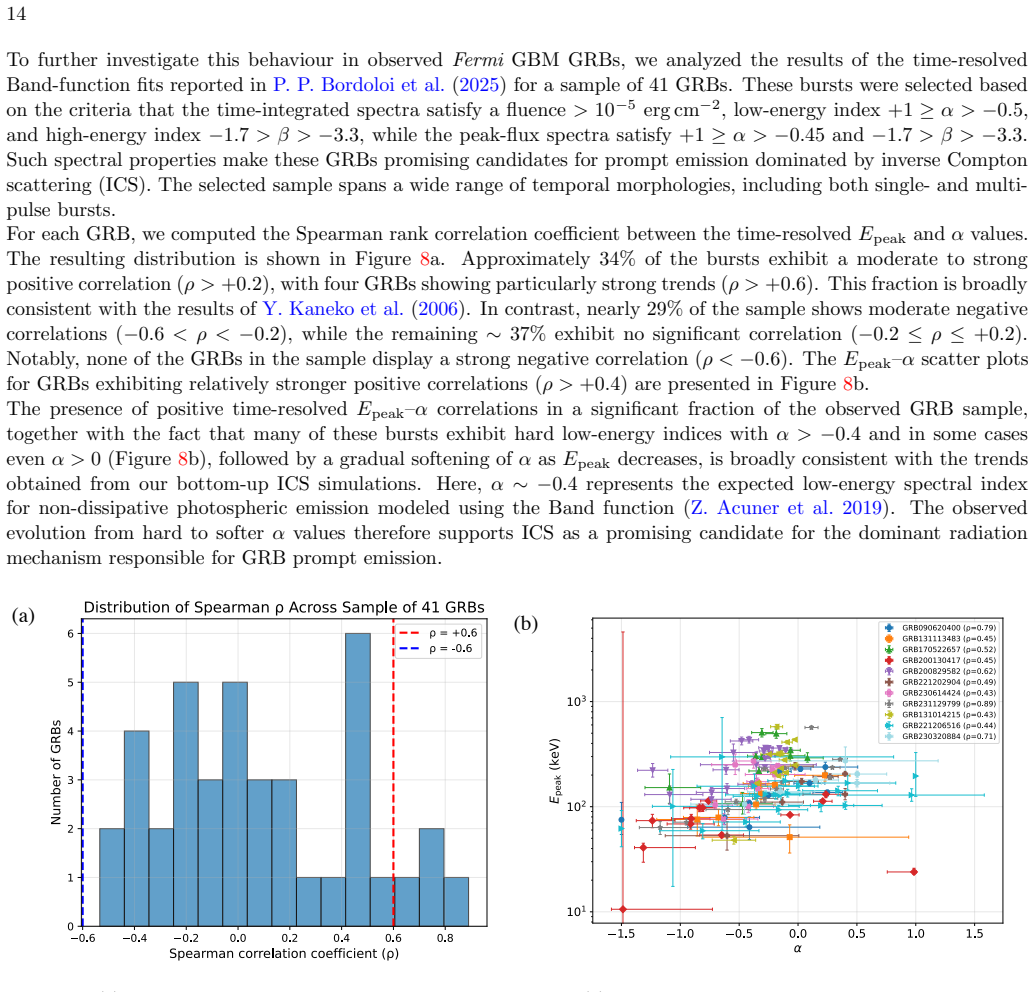
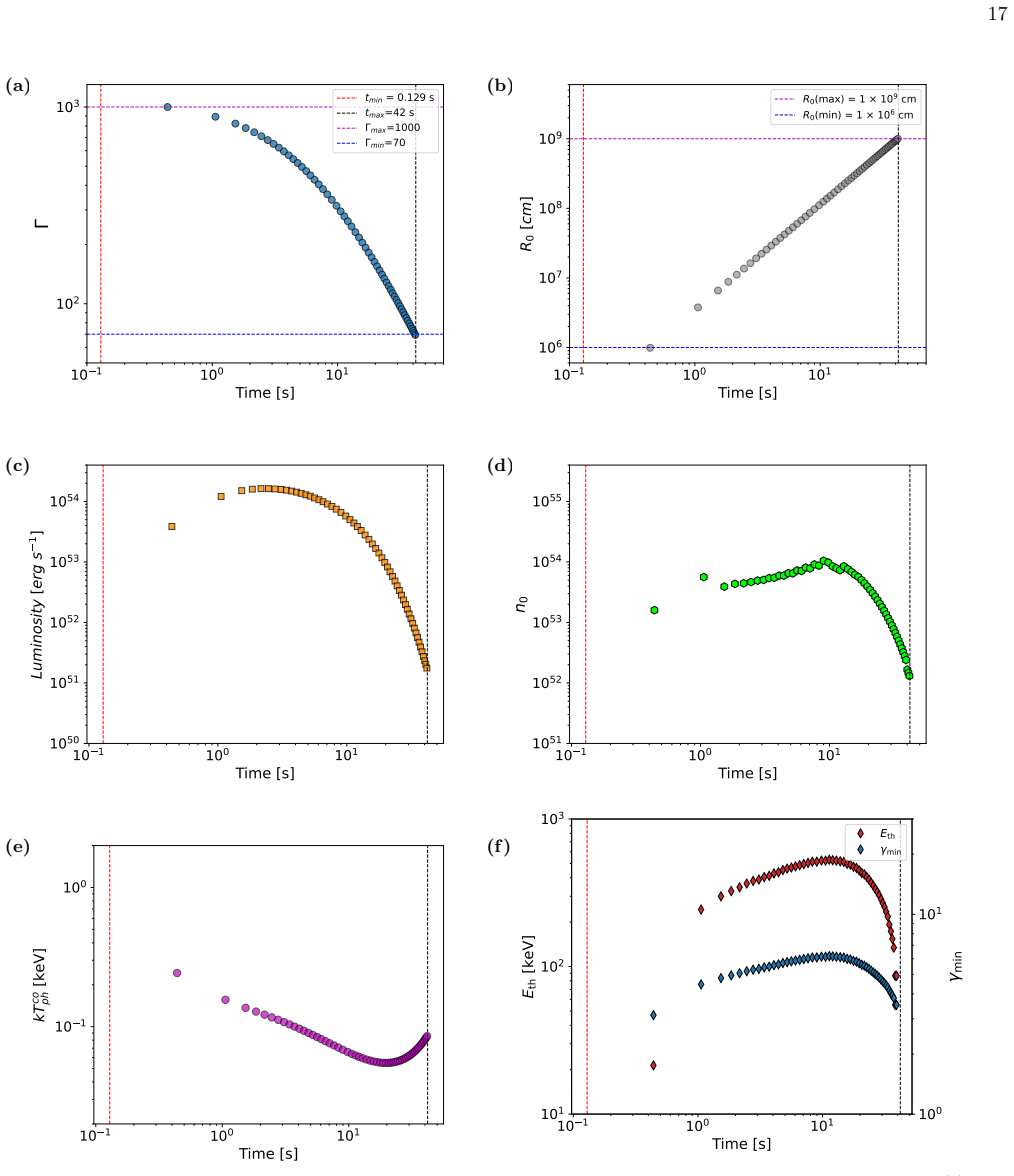
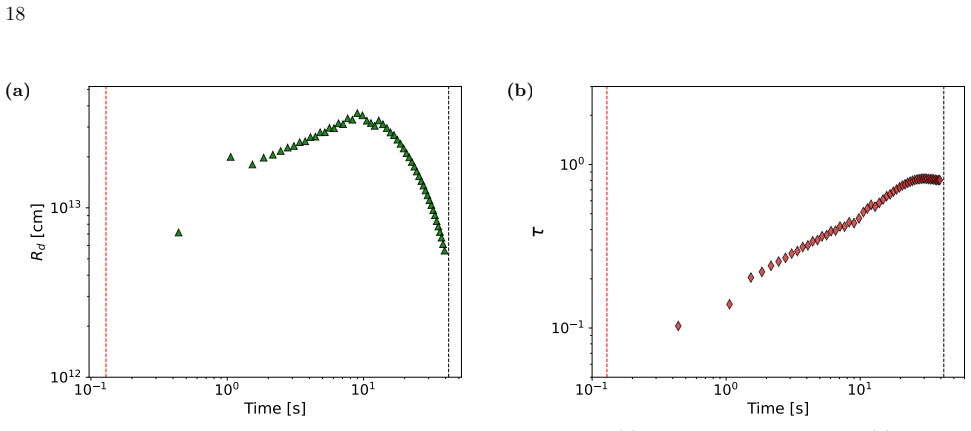
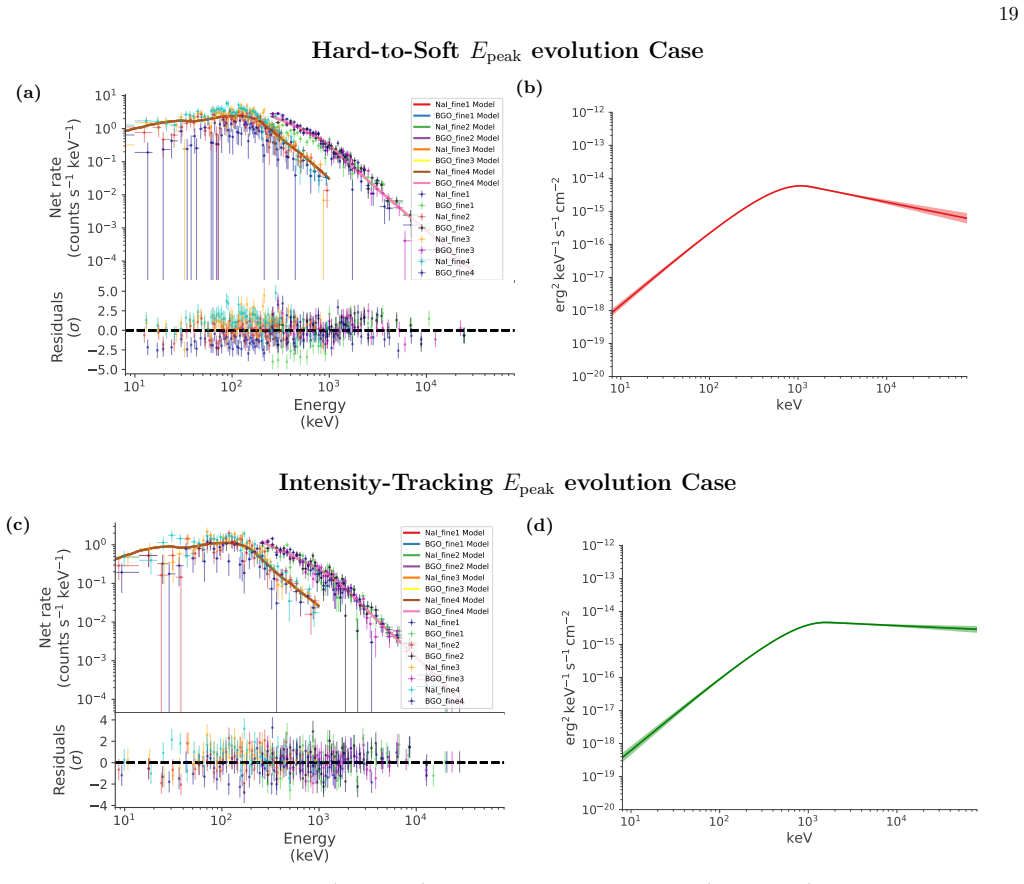
Gamma-ray bursts (GRBs) are the brightest explosions in the Universe, yet the origin of their emission remains uncertain. Time-resolved spectral analysis offers key insights into the evolution of spectral shapes, constraining both radiation mechanisms and emission-site microphysics. Observationally, GRB spectra are well described by the empirical Band function, characterized by the peak energy ($E_{\mathrm{peak}}$) and low-energy spectral index ($\alpha$). We investigate the temporal evolution of spectra produced by optically thin inverse-Compton scattering (ICS) within a standard fireball jet framework, focusing on the scenarios that can produce the two commonly observed spectral evolution patterns: hard-to-soft evolution and intensity tracking, within a single emission pulse. The evolution is analysed using both Bayesian block and constant-fluence binning, with the observed spectrum modeled consistently using the Band function. Using this bottom-up approach, we find that optically thin ICS yields a positive $E_{\mathrm{peak}}$-$\alpha$ correlation, with $\alpha$ evolving from hard (Planck-like, $> +0.5$) to softer ($< -0.67$) values. Such hard $\alpha$ values are inconsistent with standard synchrotron emission. This characteristic evolution in the $E_{\mathrm{peak}}$-$\alpha$ plane, therefore, provides a diagnostic signature of optically thin ICS as the dominant radiation mechanism during the prompt phase of GRBs. Furthermore, this type of smooth evolution of $\alpha$ within a single pulse does not require invoking a transition between different radiation mechanisms, unless additional observational evidence supports such a change.
Editorial analysis
A structured set of objections, weighed in public.
Referee Report
Summary. The paper claims that bottom-up simulations of optically thin inverse-Compton scattering (ICS) spectra within a standard fireball framework, when fitted with the empirical Band function, produce a positive E_peak-α correlation. Alpha evolves smoothly from hard (Planck-like, > +0.5) to soft (< -0.67) values within a single pulse, reproducing both hard-to-soft and intensity-tracking patterns; this evolution is presented as a diagnostic signature of ICS dominance during the GRB prompt phase, without requiring transitions between radiation mechanisms.
Significance. If the central result holds after validation, the work would supply a microphysical origin for the observed E_peak-α correlation and for the hard-alpha regime that is difficult for synchrotron models, thereby strengthening the case for optically thin ICS as a viable prompt-emission process. The bottom-up construction from standard fireball assumptions and the use of two independent binning methods are positive features that avoid direct parameter fitting to the target correlation.
major comments (3)
- [modeling and results sections (implied by abstract description of consistent Band modeling)] The central claim rests on Band-function fits to the simulated ICS spectra recovering unbiased E_peak and α across the full reported range (α > +0.5 to < -0.67). No fit residuals, χ² values, or example spectra are shown to demonstrate that the ICS curvature is adequately captured by the Band shape in the hard-α regime, where systematic bias is known to be possible; this directly affects whether the reported positive correlation is physical or an artifact of the fitting procedure.
- [results and discussion (implied by abstract)] No quantitative comparison of the simulated E_peak-α tracks (slope, scatter, or pulse-to-pulse behavior) to any observed GRB time-resolved catalog is provided, so the diagnostic claim cannot be evaluated for consistency with real data.
- [analysis methods (implied by abstract)] The manuscript states that both Bayesian-block and constant-fluence binning were used, yet supplies no robustness test showing that the recovered correlation is insensitive to the choice of binning method or to the specific fluence thresholds.
minor comments (1)
- [abstract] Notation for E_peak and α is introduced with LaTeX but the abstract does not define the precise energy range or normalization convention used for the Band fits.
Simulated Author's Rebuttal
We thank the referee for the thoughtful and constructive report. The comments highlight important aspects for strengthening the validation of our results. We address each major comment below and indicate the planned revisions.
read point-by-point responses
-
Referee: The central claim rests on Band-function fits to the simulated ICS spectra recovering unbiased E_peak and α across the full reported range (α > +0.5 to < -0.67). No fit residuals, χ² values, or example spectra are shown to demonstrate that the ICS curvature is adequately captured by the Band shape in the hard-α regime, where systematic bias is known to be possible; this directly affects whether the reported positive correlation is physical or an artifact of the fitting procedure.
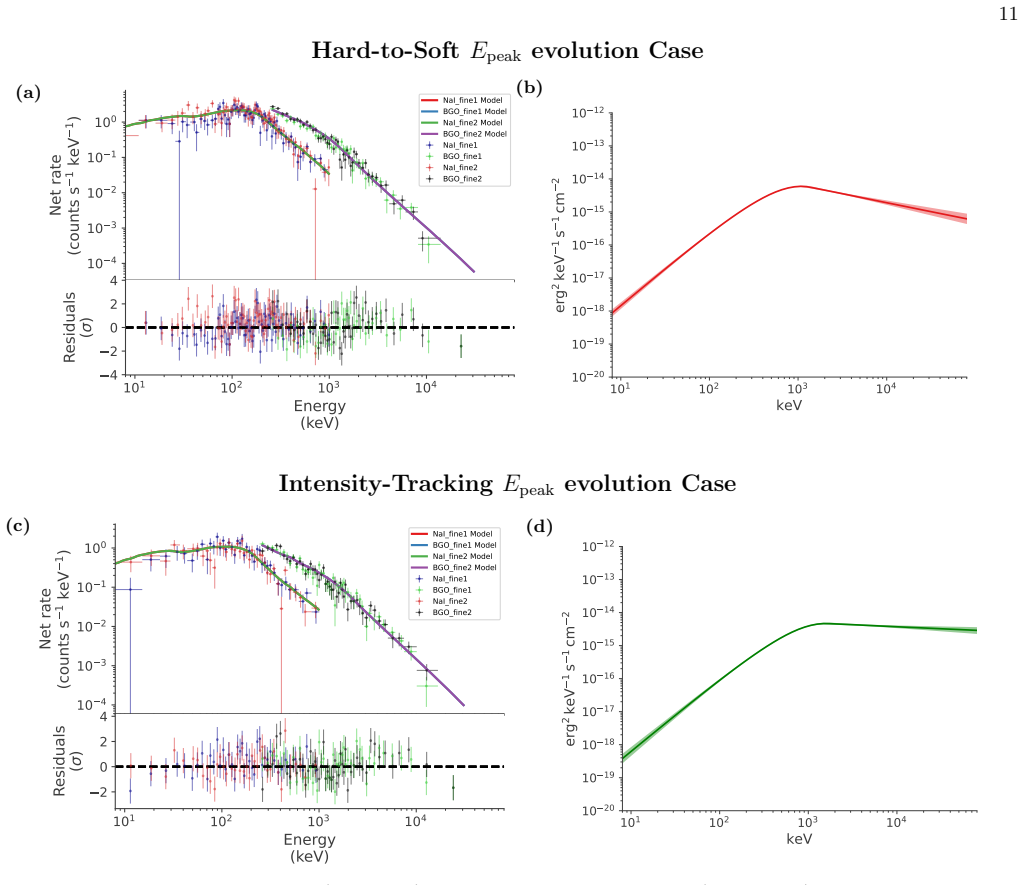
Authors: We agree that explicit demonstration of fit quality is necessary to support the central claim, especially given known biases in the hard-α regime. In the revised manuscript we will add representative time-resolved spectra (with data, model, and residuals) together with the corresponding χ² values and degrees of freedom for bins spanning α > +0.5 to α < -0.67. These additions will confirm that the Band function provides an adequate description of the simulated ICS spectra without introducing systematic bias in the recovered E_peak–α correlation. revision: yes
-
Referee: No quantitative comparison of the simulated E_peak-α tracks (slope, scatter, or pulse-to-pulse behavior) to any observed GRB time-resolved catalog is provided, so the diagnostic claim cannot be evaluated for consistency with real data.
Authors: The manuscript’s scope is to establish, via a bottom-up simulation from standard fireball assumptions, that optically thin ICS produces a positive E_peak–α correlation with the observed range of α values. While a direct quantitative match to catalog statistics (slope, scatter, etc.) would provide additional support, it lies outside the present theoretical focus. We will expand the discussion section to reference existing time-resolved catalogs and note the qualitative agreement with the reported hard-to-soft and intensity-tracking patterns, but a full statistical comparison is reserved for follow-up work. revision: partial
-
Referee: The manuscript states that both Bayesian-block and constant-fluence binning were used, yet supplies no robustness test showing that the recovered correlation is insensitive to the choice of binning method or to the specific fluence thresholds.
Authors: We will add a dedicated robustness subsection (or appendix) that recomputes the E_peak–α tracks using both binning schemes across a range of fluence thresholds. The resulting correlation slopes and scatter will be compared directly to demonstrate that the reported positive correlation is insensitive to these analysis choices. revision: yes
Circularity Check
No significant circularity; bottom-up simulation derives correlation from physical ICS model
full rationale
The paper constructs spectra from first-principles optically thin inverse-Compton scattering in a standard fireball jet, then applies Band-function fitting as an observational analysis step. The reported positive E_peak-α correlation emerges as an output of this forward modeling rather than being imposed by parameter fitting, self-definition, or load-bearing self-citation. No equation or step reduces the target correlation to an input by construction, and the derivation chain remains independent of the final diagnostic claim.
Axiom & Free-Parameter Ledger
axioms (2)
- domain assumption Standard fireball jet framework governs the emission region and dynamics
- domain assumption Optically thin inverse Compton scattering is the sole radiation process considered
Reference graph
Works this paper leans on
-
[1]
2019, MNRAS, 487, 5508, doi: 10.1093/mnras/stz1356
Acuner, Z., Ryde, F., & Yu, H.-F. 2019, MNRAS, 487, 5508, doi: 10.1093/mnras/stz1356
-
[2]
Aghanim, N., et al. 2020, Astron. Astrophys., 641, A6, doi: 10.1051/0004-6361/201833910
-
[3]
2015, MNRAS, 454, L31, doi: 10.1093/mnrasl/slv114
Ahlgren, B., Larsson, J., Nymark, T., Ryde, F., & Pe’er, A. 2015, MNRAS, 454, L31, doi: 10.1093/mnrasl/slv114
-
[4]
1993, ApJ, 413, 281, doi: 10.1086/172995
Band, D., Matteson, J., Ford, L., et al. 1993, ApJ, 413, 281, doi: 10.1086/172995
-
[5]
Bordoloi, P. P., & Iyyani, S. 2025, ApJ, 994, 10, doi: 10.3847/1538-4357/ae073a
-
[6]
Bordoloi, P. P., Mittal, S., & Iyyani, S. 2025, arXiv e-prints, arXiv:2511.20310, doi: 10.48550/arXiv.2511.20310
-
[7]
M., Fleischhack, H., Vianello, G., et al
Burgess, J. M., Fleischhack, H., Vianello, G., et al. 2021,, 2.2.4 Zenodo, doi: 10.5281/zenodo.5646954
-
[8]
Burgess, J. M., Preece, R. D., & et al. 2014, ApJ, 784, 17, doi: 10.1088/0004-637X/784/1/17
-
[9]
2015, ApJ, 801, 103, doi: 10.1088/0004-637X/801/2/103
Gao, H., & Zhang, B. 2015, ApJ, 801, 103, doi: 10.1088/0004-637X/801/2/103
-
[10]
2018, A&A, 609, A112, doi: 10.1051/0004-6361/201731598
Ghirlanda, G., Nappo, F., Ghisellini, G., et al. 2018, A&A, 609, A112, doi: 10.1051/0004-6361/201731598
-
[11]
Gruber, D., Goldstein, A., von Ahlefeld, V. W., et al. 2014, The Astrophysical Journal Supplement Series, 211, 12, doi: 10.1088/0067-0049/211/1/12
-
[12]
2018, Journal of Astrophysics and Astronomy, 39, 75, doi: 10.1007/s12036-018-9567-9
Iyyani, S. 2018, Journal of Astrophysics and Astronomy, 39, 75, doi: 10.1007/s12036-018-9567-9
-
[13]
Iyyani, S., Ryde, F., Burgess, J. M., Pe’er, A., & B´ egu´ e, D. 2016, MNRAS, 456, 2157, doi: 10.1093/mnras/stv2751
-
[14]
2013, MNRAS, 433, 2739, doi: 10.1093/mnras/stt863
Iyyani, S., Ryde, F., & et al. 2013, MNRAS, 433, 2739, doi: 10.1093/mnras/stt863
-
[15]
Kaneko, Y., Preece, R. D., & et al. 2006, ApJ, 166, 298, doi: 10.1086/505911
-
[16]
The Physics of Gamma-Ray Bursts and Relativistic Jets
Kumar, P., & Zhang, B. 2015, PhR, 561, 1, doi: 10.1016/j.physrep.2014.09.008
work page internal anchor Pith review doi:10.1016/j.physrep.2014.09.008 2015
-
[17]
2019, The Astrophysical Journal Supplement Series, 245, 7, doi: 10.3847/1538-4365/ab42de
Li, L. 2019, The Astrophysical Journal Supplement Series, 245, 7, doi: 10.3847/1538-4365/ab42de
-
[18]
2020, The Astrophysical Journal, 894, 100, doi: 10.3847/1538-4357/ab8014
Li, L. 2020, The Astrophysical Journal, 894, 100, doi: 10.3847/1538-4357/ab8014
-
[19]
2010, ApJ, 720, 1146, doi: 10.1088/0004-637X/720/2/1146 21
Lu, R.-J., Hou, S.-J., & Liang, E.-W. 2010, ApJ, 720, 1146, doi: 10.1088/0004-637X/720/2/1146 21
-
[20]
2009, ApJ, 702, 791, doi: 10.1088/0004-637X/702/1/791 M´ esz´ aros, P
Meegan, C., Lichti, G., & et al. 2009, ApJ, 702, 791, doi: 10.1088/0004-637X/702/1/791 M´ esz´ aros, P. 2006, Reports on Progress in Physics, 69, 2259, doi: 10.1088/0034-4885/69/8/R01
-
[21]
Norris, J. P., Bonnell, J. T., Kazanas, D., et al. 2005, The Astrophysical Journal, 627, 324, doi: 10.1086/430294 Pe’er, A., Ryde, F., & et al. 2007, ApJL, 664, L1, doi: 10.1086/520534
-
[22]
2016, ApJ, 821, 12, doi: 10.3847/0004-637X/821/1/12
Preece, R., Goldstein, A., Bhat, N., et al. 2016, ApJ, 821, 12, doi: 10.3847/0004-637X/821/1/12
-
[23]
Preece, R. D., Briggs, M. S., & et al. 1998, ApJL, 506, L23, doi: 10.1086/311644
-
[24]
Racusin, J. L., Oates, S. R., & et al. 2011, ApJ, 738, 138, doi: 10.1088/0004-637X/738/2/138
-
[25]
B., & Lightman, A
Rybicki, G. B., & Lightman, A. P. 1986, Radiative Processes in Astrophysics
1986
-
[26]
1998, ApJL, 497, L17, doi: 10.1086/311269
Sari, R., Piran, T., & Narayan, R. 1998, ApJL, 497, L17, doi: 10.1086/311269
-
[27]
Scargle, J. D. 1998, ApJ, 504, 405, doi: 10.1086/306064
-
[28]
Vianello, G., Lauer, R. J., Younk, P., et al. 2015, ArXiv e-prints. https://arxiv.org/abs/1507.08343
Pith/arXiv arXiv 2015
-
[29]
2024, The Astrophysical Journal, 962, 85, doi: 10.3847/1538-4357/ad14fb
Yan, Z.-Y., Yang, J., Zhao, X.-H., Meng, Y.-Z., & Zhang, B.-B. 2024, The Astrophysical Journal, 962, 85, doi: 10.3847/1538-4357/ad14fb
-
[30]
2015, Proc
Zabalza, V. 2015, Proc. of International Cosmic Ray Conference 2015, 922
2015
discussion (0)
Sign in with ORCID, Apple, or X to comment. Anyone can read and Pith papers without signing in.