REVIEW 3 major objections 4 minor 35 references
Revisiting Data Quality Control and Multiple-star Modeling in Wide Binary Gravity Tests: Confirmation of MOND-type Gravitational Anomaly at Low Acceleration
T0 review · 3 major / 4 minor · reviewed 2026-08-02 · deepseek-v4-flash
Pith's one-line read The low-acceleration gravitational anomaly in wide binaries survives both stringent data-quality control and realistic modeling of hidden companion stars, confirming a MOND-type velocity boost at more than 5σ significance.
desk verdict Careful, mostly persuasive re-analysis showing the low-acceleration anomaly survives the Pittordis triple model and Cookson quality cuts; main weaknesses are an untested f_trip constancy assumption and no shipped code/data. read the letter →
The pith
A machine-rendered reading of the paper's core claim, the machinery that carries it, and where it could break.
The reading
What carries the argument
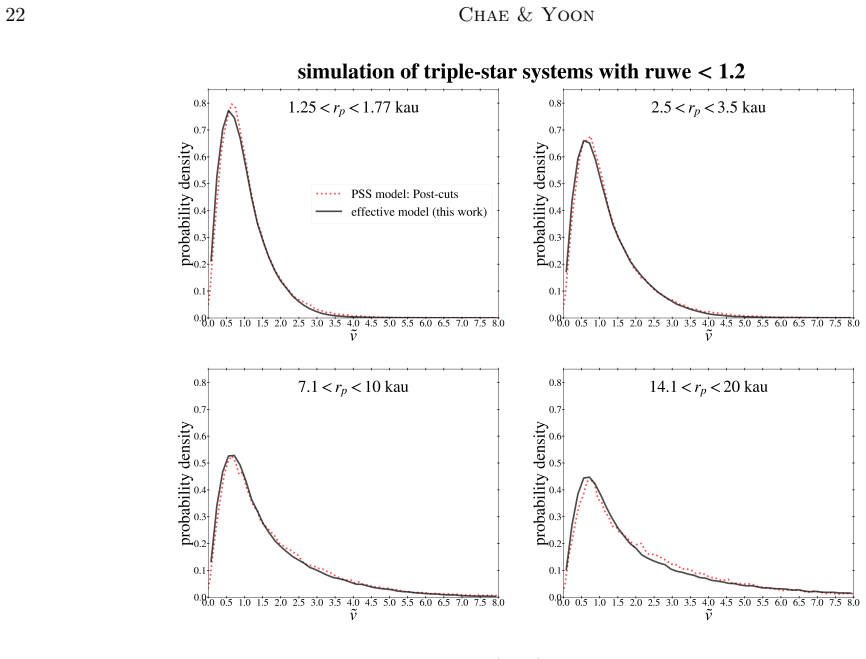
The central object is the normalized sky-plane velocity v-tilde = v_p / v_c(r_p), the observed 2D relative velocity divided by the Newtonian circular speed at the projected separation; in Newtonian gravity its median should be nearly flat in separation, so a rising v-tilde profile is a gravity signal. Two tools carry the argument: the acceleration-plane test, which projects each binary's logarithmic Newtonian and empirical acceleration onto a diagonal coordinate and measures the orthogonal deviation from Newton, and a forward model of apparent binaries with hidden companion stars, encoded by an effective lower limit on the inner orbit semi-major axis that reproduces the proposed 'realistic'
What would settle it
Measure the hidden-companion fraction directly in the 3–30 kau separation range—for example, by searching each primary for a resolved or astrometric companion via high-resolution imaging and radial-velocity monitoring rather than inferring it statistically—and check whether the fraction equals the Newtonian-calibrated value. If the hidden-companion fraction rises steeply with projected separation, or if the astrometric quality cut admits more short-period inner binaries at large separations, the rising v-tilde profile could be partly spurious; if it stays flat, the anomaly is gravitational.
Extended reading notes
Core claim
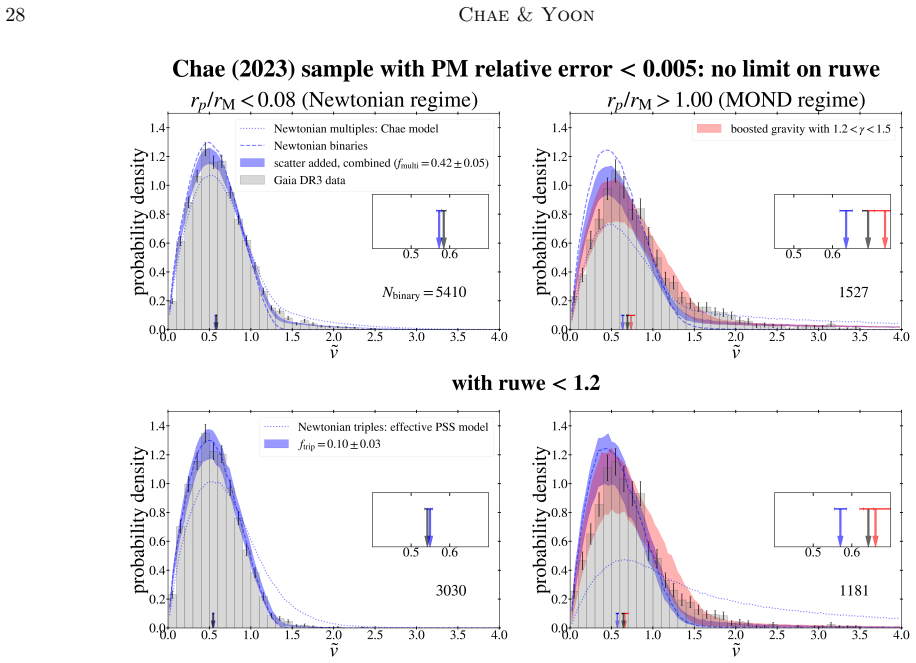
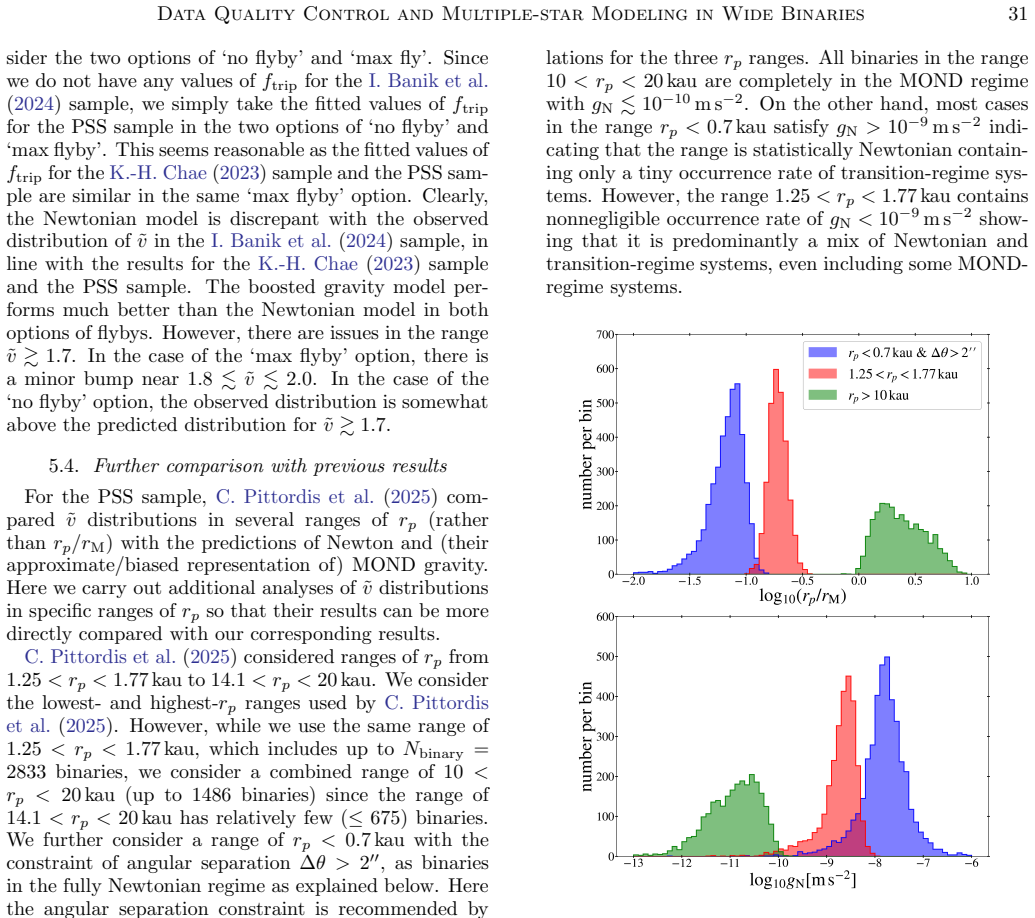
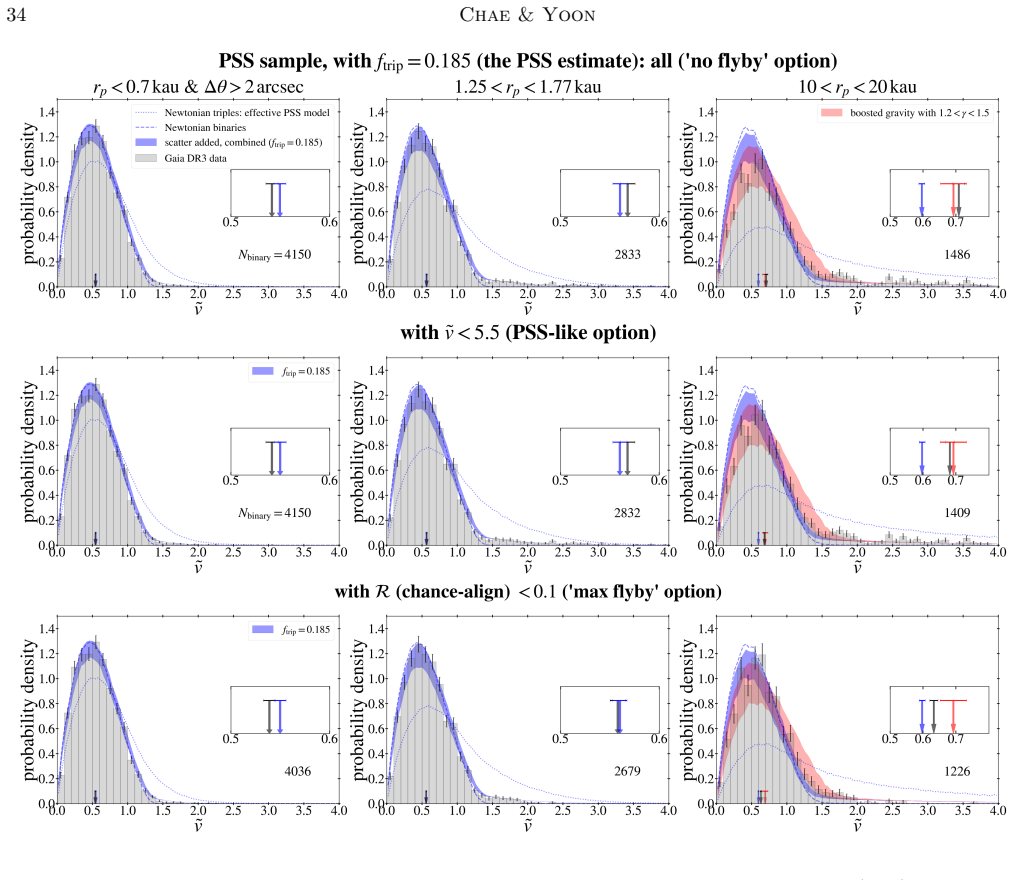
The central claim is that wide binary stars with projected separations larger than a few thousand astronomical units show a relative velocity that rises above the Newtonian prediction as the internal acceleration drops below roughly 10^-9 m/s^2, and that this rise survives the two main challenges raised against it. Implementing the most sophisticated triple-star model currently proposed, the authors calibrate the hidden-companion fraction using high-acceleration Newtonian binaries; with that calibration, the low-acceleration bins still show a positive deviation from Newton, with combined significance exceeding 5σ. Applying the full set of quality cuts advocated by skeptical studies—distance
Load-bearing premise
The fraction of apparent binaries hiding an unseen companion star, measured in the high-acceleration Newtonian regime, is assumed to stay constant as binaries move to larger separations; if it actually grows with separation, some of the rising velocity signal could be contamination rather than gravity.
Editorial extensions
If this is right
- The low-acceleration anomaly is not an artifact of hidden triples: a nearly pure nearby subsample with a fitted triple fraction of about 0.03 still shows the velocity boost.
- A quality cut based on the uncertainty of v-tilde is biased: it selectively removes lower-mass and higher-velocity systems at large separations, so future studies should use absolute velocity-error cuts or direct uncertainty propagation.
- The hidden-companion fraction must be calibrated in the Newtonian regime free of chance alignments; using a value fitted to the low-acceleration region biases the test toward Newtonian gravity.
- The observed velocity boost, corresponding to γ ≈ 1.3–1.6, agrees with realistic two-body QUMOND predictions under the Galactic external field, while approximate test-particle MOND models overpredict the effect in the transition regime.
- Reports of no anomaly based on samples with fewer than about 100 MOND-regime binaries are statistically unable to distinguish Newton from a γ = 1.4 boost, so their null result is expected even if modified gravity is correct.
Reading between the lines
- If the constancy of the hidden-companion fraction across separations is confirmed, the v-tilde profile versus r_p/r_M could be used to map the MOND interpolation function in the external-field-dominated regime, where current constraints are weakest.
- Targeted follow-up of wide binaries in the 3–30 kau range—high-resolution imaging and radial-velocity monitoring to find hidden companions directly rather than statistically—would settle whether the calibrated triple fraction truly holds at large separations.
- The bias analysis suggests a practical prescription for the next generation of astrometric surveys: use absolute proper-motion velocity errors and direct uncertainty propagation, and verify Newtonian predictions in the high-acceleration regime before interpreting low-acceleration bins.
- A direct 3D orbit analysis of the small d<150 pc sample with radial velocities could independently confirm the statistical result and potentially distinguish AQUAL from QUMOND in the transition regime.
Signed reviews
Editorial analysis
A structured set of objections, weighed in public.
Referee Report
Summary. The paper reexamines the wide-binary gravity tests from Gaia DR3 that have yielded conflicting conclusions about a low-acceleration anomaly. It focuses on two challenges raised by null-result studies: data quality cuts (especially the Banik cut on the uncertainty of the normalized velocity) and the modeling of hierarchical systems with hidden companions. The authors implement the Pittordis et al. (2025) 'PSS' triple model via an effective algorithm (Eq. 18), calibrate the hidden-companion fraction f_trip in the Newtonian regime, and then run acceleration-plane, v-tilde-distribution, and median-v-tilde-profile tests on three samples (Chae 2023, Banik et al. 2024, PSS 2025). Their central claim is that the low-acceleration anomaly (δ_obs-newt > 0 at g_N ≲ 1e-9 m/s^2) survives all reasonable choices of data quality cuts and multiple-star modeling, with a combined significance >5σ, and that the observed trend agrees with the realistic QUMOND orbit solutions of Pflamm-Altenburg (2025). They further argue that the Banik cut introduces an r_p-dependent bias, that Cookson et al. (2026) had too few MOND-regime binaries (N=61) to discriminate models, and that the PSS preference for Newton is traceable to an overestimated f_trip and an inaccurate MOND transition-regime model.
Significance. If the main claim holds, the paper is a significant contribution to the wide-binary gravity debate: it addresses the two most prominent criticisms (data quality and hidden companions) with a unified modeling framework and shows that a MOND-type anomaly remains. Its strengths include the calibration of f_trip in the Newtonian regime rather than fitting the low-acceleration signal, the use of external numerical QUMOND solutions rather than a model tuned to the data, and the explicit power calculation in Figure 39 showing that Cookson et al.'s sample is too small to distinguish Newton from boosted gravity. The Pflamm-Altenburg comparison is a genuinely new element that goes beyond earlier approximate MOND treatments. The main caveat, discussed below, is that the r_p-independence of f_trip is asserted rather than directly tested; this is the weakest link in an otherwise well-constructed analysis.
major comments (3)
- [§5.2, Eq. (18), Figs. 25, 29, 53] The central assumption that f_trip is independent of the outer projected separation is asserted at the end of §5.2.2, but it is not tested. f_trip is calibrated in one Newtonian bin (x0 ≈ -8.0) and then held fixed across all bins. However, the sample-defining cuts (ruwe<1.2, ipd_frac_multi_peak=0, CMD cut, distance limit) are applied to member stars, and the probability of passing those cuts could correlate with distance and stellar mass distributions that vary with r_p. Figure 9 demonstrates that a different contaminant fraction, f_flyby, changes strongly with r_p, so an r_p-dependent f_trip is not implausible. A per-bin increase of f_trip from ~0.1 to ~0.4 could in principle produce the observed rise in median v-tilde without modified gravity. Figure 53 excludes a single global f_trip=0.41 because it destroys the Newtonian-regime agreement, but it does not exclude a per-bin f_trip(r_p)
- [§7 (summary bullets; Figs. 25, 29, 43)] The headline 'combined statistical significance of >5σ' is not defined. Multiple bins, three different tests, and several overlapping samples are used, so the effective number of independent trials is unclear. As written, the >5σ claim is not falsifiable because the reader cannot tell which comparisons are being combined and how. Please specify the exact combination rule — for example, a single pre-specified bin/test, a meta-analysis with a stated correlation model, or a false-discovery-rate control — and provide the resulting p-value. This is particularly important because the paper itself reports different significances in different tests (e.g., 2.3σ in one configuration of Figure 36, 4.6σ in Figure 31, etc.).
- [§3, Fig. 13 and §5.4] The paper states that I. Banik et al. (2024) used an erroneous Newtonian benchmark, with their ⟨v⟩=0.64 for α=1 being 0.55 and their 'Newtonian' consequently boosted by ≈1.37 in the effective gravitational constant. This is a serious claim about a published null result and is used in §5.4 to explain why Banik et al. preferred Newton. It is not needed for the internally calibrated measurement of the anomaly, but it is central to the paper's dismissal of one of the main contrary studies. Please provide a step-by-step reproduction of the relevant calculation, or a numerical table with the same inputs, so that the 0.55 value and the boost factor can be independently checked. If this is simply taken from previous papers, the derivation should be restated here.
minor comments (4)
- [Title and §5.1] There are typographical issues: 'T ests' in the typeset title and 'f pb' in §5.1 where 'η_phot' is introduced. Please proofread the final PDF version.
- [Fig. 13] The figure mixes theoretical prediction bands, sample-specific colored bands, and individual points with several curves. Please separate the Newtonian benchmark comparison into a dedicated panel or expand the legend, as the current figure is difficult to read.
- [§5.1 and abstract] The acronyms 'PSS' and 'CMD' are used without expansion at first appearance. The Gaia parameter 'ipd_frac_multi_peak' is typeset inconsistently; define it once and use a uniform notation.
- [§7] The paper honestly states that the distinction between realistic and approximate MOND solutions is 'not conclusive from the present studies.' This caveat should also appear in the abstract, where the agreement with Pflamm-Altenburg (2025) is currently presented more strongly than the body supports.
Circularity Check
No significant circularity: the MOND-regime signal is not fitted but is measured relative to a Newtonian benchmark calibrated in the Newtonian regime, and MOND comparisons use external numerical solutions.
full rationale
The paper's central claim—that the low-acceleration anomaly survives proper data-quality control and multiple-star modeling—is not circular. The hidden-companion fraction f_trip is calibrated in the Newtonian regime (e.g., 'we calibrate f_trip using the high-acceleration bin (≳10^−8.3 m s^−2)' and Figure 25's 'f_trip is determined by matching data with the Newtonian prediction in the rightmost bin'); it is then held fixed when evaluating the MOND-regime residual δ_obs−newt. Thus the MOND-regime excess is an observed residual, not a fitted parameter. The MOND comparison uses independent external numerical solutions (J. Pflamm-Altenburg 2025), not a model tuned to the present data. The paper also applies the triple model of Pittordis et al. (2025) and the quality framework of Cookson et al. (2026), both external benchmarks. Self-citations are numerous—especially to Chae's own acceleration-plane methodology and mass-luminosity relation—but the load-bearing ingredients (samples, eccentricities, external MOND orbit solutions, and the PSS triple model) are independent or re-derived here. The f_trip constancy assumption is a stated modeling assumption, not a definitional identity, and the paper explicitly tests robustness by showing that a single large f_trip cannot simultaneously fit both the Newtonian and MOND regimes (Figure 53). No step reduces by construction to its own inputs.
Assumptions & free parameters
free parameters (3)
- f_trip (fraction of triples) =
0.10±0.03 (Chae sample, ruwe<1.2); 0.12±0.03 / 0.07±0.03 (PSS sample); 0.03±0.03 (d<150 pc)
- a_inn,min coefficients in Equation (18) =
11.7 − 5.5 log10(r_p/kau)
- f_flyby (chance-alignment fraction) options =
no flyby / PSS-like (remove v-tilde > 5.5) / max flyby (R>0.1 or no R)
assumptions (5)
- standard math Random orbital phase and isotropic orientation for wide binary orbits.
- domain assumption Newtonian gravity is valid at g_N > 10^-8.3 m/s^2, and MOND effects are negligible there.
- domain assumption The Pittordis et al. triple model, with the effective implementation of Equation (18), fully captures hierarchical-system contamination in ruwe<1.2 samples.
- domain assumption The external-field-effect QUMOND solution by Pflamm-Altenburg (2025) is the correct MOND benchmark for wide binaries.
- domain assumption The El-Badry et al. (2021) R parameter reliably separates gravitationally-bound pairs from chance alignments.
Cite this review
Pith. "Pith review of Revisiting Data Quality Control and Multiple-star Modeling in Wide Binary Gravity Tests: Confirmation of MOND-type Gravitational Anomaly at Low Acceleration." pith.science (2026). https://pith.science/paper/UVICTTZV
@misc{pith2026260714450,
  author       = {Pith},
  title        = {Pith review of: Revisiting Data Quality Control and Multiple-star Modeling in Wide Binary Gravity Tests: Confirmation of MOND-type Gravitational Anomaly at Low Acceleration},
  year         = {2026},
  howpublished = {\url{https://pith.science/paper/UVICTTZV}},
  note         = {Machine review of arXiv:2607.14450}
}
abstract
Wide binary stars provide natural laboratories for directly probing gravity in the low-acceleration regime, as dark matter inferred from any viable gravity has negligible effects on their internal dynamics. Various recent studies including Bayesian 3D analyses have shown that wide binaries with separations greater than several thousand astronomical units experience MOND-type gravity with a boost factor of $\gamma\approx 1.3-1.6$. However, results claiming preference for, or no deviation from, standard gravity have also been published during the same period, particularly highlighting the roles of data quality control and realistic modeling of multiple-star (i.e., triple and higher-order) systems that host hidden companion stars. Here we carefully reexamine the issues of data quality control and modeling multiple-star systems in statistical gravity tests based on sky-projected 2D velocities of wide binary stars. Through extensive tests including the acceleration-plane test, the $\tilde v$-distribution test, and the median-$\tilde v$-profile test (where $\tilde v$ is the sky-plane 2D relative velocity normalized by the Newtonian circular velocity between the two stars), we show that proper data quality control or reasonable variation in multiple-star modeling cannot remove the low-acceleration gravitational anomaly but confirms the MOND-type gravitational anomaly, particularly consistent with recent realistic MOND solutions of wide binary orbits. We find that studies claiming no evidence for the low-acceleration gravitational anomaly are consequences of bypassed calibration of the fraction of multiple-star systems using the Newtonian-regime data, bias-introduction in data quality control that is not taken into account in gravity tests, or insufficient statistics in the low-acceleration regime.
Figures


Figures from the paper (48 more)










Reference graph
Works this paper leans on
-
[1]
2024, MNRAS, 527, 4573, doi: 10.1093/mnras/stad3393
Banik, I., Pittordis, C., Sutherland, W., et al. 2024, MNRAS, 527, 4573, doi: 10.1093/mnras/stad3393
-
[2]
2018, MNRAS, 480, 2660, doi: 10.1093/mnras/sty2007
Banik, I., & Zhao, H. 2018, MNRAS, 480, 2660, doi: 10.1093/mnras/sty2007
-
[3]
1984, ApJ, 286, 7, doi: 10.1086/162570
Bekenstein, J., & Milgrom, M. 1984, ApJ, 286, 7, doi: 10.1086/162570
doi:10.1086/162570 1984
-
[4]
2023, ApJ, 952, 128, doi: 10.3847/1538-4357/ace101
Chae, K.-H. 2023, ApJ, 952, 128, doi: 10.3847/1538-4357/ace101
-
[5]
2024a, ApJ, 960, 114, doi: 10.3847/1538-4357/ad0ed5
Chae, K.-H. 2024a, ApJ, 960, 114, doi: 10.3847/1538-4357/ad0ed5
-
[6]
2024b, ApJ, 972, 186, doi: 10.3847/1538-4357/ad61e9
Chae, K.-H. 2024b, ApJ, 972, 186, doi: 10.3847/1538-4357/ad61e9
-
[7]
2025, ApJ, 985, 210, doi: 10.3847/1538-4357/adce09
Chae, K.-H. 2025, ApJ, 985, 210, doi: 10.3847/1538-4357/adce09
-
[8]
2026, ApJL, 998, L43, doi: 10.3847/2041-8213/ae40ef
Chae, K.-H. 2026, ApJL, 998, L43, doi: 10.3847/2041-8213/ae40ef
Show all 35 references
-
[9]
K., & Gong, I.-T
Chae, K.-H., Bernardi, M., Sheth, R. K., & Gong, I.-T. 2019, ApJ, 877, 18, doi: 10.3847/1538-4357/ab18f8
2019 doi
-
[10]
2026, arXiv e-prints, arXiv:2601.21728
Chae, K.-H., Lee, B.-C., Hernandez, X., et al. 2026, arXiv e-prints, arXiv:2601.21728. https://arxiv.org/abs/2601.21728
2026
-
[11]
2022, ApJ, 928, 24, doi: 10.3847/1538-4357/ac5405
Chae, K.-H., & Milgrom, M. 2022, ApJ, 928, 24, doi: 10.3847/1538-4357/ac5405
2022 doi
-
[12]
2023, A&A, 678, A19, doi: 10.1051/0004-6361/202347111
Chevalier, S., Babusiaux, C., Merle, T., & Arenou, F. 2023, A&A, 678, A19, doi: 10.1051/0004-6361/202347111
2023 doi
-
[13]
A., Banik, I., El-Badry, K., et al
Cookson, S. A., Banik, I., El-Badry, K., et al. 2026, MNRAS, 547, stag342, doi: 10.1093/mnras/stag342
2026 doi
-
[14]
El-Badry, K., Rix, H.-W., & Heintz, T. M. 2021, MNRAS, 506, 2269, doi: 10.1093/mnras/stab323
2021 doi
-
[15]
2005, MNRAS, 363, 603, doi: 10.1111/j.1365-2966.2005.09474.x
Famaey, B., & Binney, J. 2005, MNRAS, 363, 603, doi: 10.1111/j.1365-2966.2005.09474.x
2005
-
[16]
D., L´ epine, S., & Medan, I
Hartman, Z. D., L´ epine, S., & Medan, I. 2022, ApJ, 934, 72, doi: 10.3847/1538-4357/ac72a0 Data Quality Control and Multiple-star Modeling in Wide Binaries49
2022 doi
-
[17]
2023, MNRAS, 525, 1401, doi: 10.1093/mnras/stad2306
Hernandez, X. 2023, MNRAS, 525, 1401, doi: 10.1093/mnras/stad2306
2023 doi
-
[18]
2024a, MNRAS, 533, 729, doi: 10.1093/mnras/stae1823
Hernandez, X., Chae, K.-H., & Aguayo-Ortiz, A. 2024a, MNRAS, 533, 729, doi: 10.1093/mnras/stae1823
-
[19]
2025, MNRAS, 537, 2925, doi: 10.1093/mnras/staf210
Hernandez, X., & Kroupa, P. 2025, MNRAS, 537, 2925, doi: 10.1093/mnras/staf210
2025 doi
-
[20]
2024b, MNRAS, 528, 4720, doi: 10.1093/mnras/stad3446
Aguayo-Ortiz, A. 2024b, MNRAS, 528, 4720, doi: 10.1093/mnras/stad3446
-
[21]
Hwang, H.-C., Ting, Y.-S., & Zakamska, N. L. 2022, MNRAS, 512, 3383, doi: 10.1093/mnras/stac675
2022 doi
-
[22]
Makarov, V. V. 2026, AJ, 171, 79, doi: 10.3847/1538-3881/ae2757
2026 doi
-
[23]
McGaugh, S. S. 2008, ApJ, 683, 137, doi: 10.1086/589148
2008 doi
-
[24]
S., Lelli, F., & Schombert, J
McGaugh, S. S., Lelli, F., & Schombert, J. M. 2016, PhRvL, 117, 201101, doi: 10.1103/PhysRevLett.117.201101
2016 doi
-
[25]
1983, ApJ, 270, 365, doi: 10.1086/161130
Milgrom, M. 1983, ApJ, 270, 365, doi: 10.1086/161130
1983 doi
-
[26]
2010, MNRAS, 403, 886, doi: 10.1111/j.1365-2966.2009.16184.x
Milgrom, M. 2010, MNRAS, 403, 886, doi: 10.1111/j.1365-2966.2009.16184.x
2010
-
[27]
J., & Mamajek, E
Pecaut, M. J., & Mamajek, E. E. 2013, ApJS, 208, 9, doi: 10.1088/0067-0049/208/1/9
2013 doi
-
[28]
2025, A&A, 703, A68, doi: 10.1051/0004-6361/202555656
Pflamm-Altenburg, J. 2025, A&A, 703, A68, doi: 10.1051/0004-6361/202555656
2025 doi
-
[29]
2019, MNRAS, 488, 4740, doi: 10.1093/mnras/stz1898
Pittordis, C., & Sutherland, W. 2019, MNRAS, 488, 4740, doi: 10.1093/mnras/stz1898
2019 doi
-
[30]
2025, The Open Journal of Astrophysics, 8, 109, doi: 10.33232/001c.142887
Pittordis, C., Sutherland, W., & Shepherd, P. 2025, The Open Journal of Astrophysics, 8, 109, doi: 10.33232/001c.142887
2025 doi
-
[31]
2025, A&A, 699, A151, doi: 10.1051/0004-6361/202555115
Saglia, R., Pasquini, L., Patat, F., et al. 2025, A&A, 699, A151, doi: 10.1051/0004-6361/202555115
2025 doi
-
[32]
J., & Olling, R
Shaya, E. J., & Olling, R. P. 2011, ApJS, 192, 2, doi: 10.1088/0067-0049/192/1/2
2011 doi
-
[33]
Vallenari, A., Brown, A. G. A., Prusti, T., et al. 2023, A&A, 674, A1, doi: 10.1051/0004-6361/202243940
2023 doi
-
[34]
2025, ApJ, 992, 102, doi: 10.3847/1538-4357/ae0190
Yoon, Y., Tian, Y., & Chae, K.-H. 2025, ApJ, 992, 102, doi: 10.3847/1538-4357/ae0190
2025 doi
-
[35]
H., Lieberz, P., Banik, I., Haghi, H., & Kroupa, P
Zonoozi, A. H., Lieberz, P., Banik, I., Haghi, H., & Kroupa, P. 2021, MNRAS, 506, 5468, doi: 10.1093/mnras/stab2068
2021 doi
Reviewed August 2, 2026 · model on record in the stance chip above.
Discussion (0). Continue with ORCID to comment.