REVIEW 3 major objections 4 minor 76 references
Effects of Ultraviolet Radiation on Sub-Neptune Exoplanet Hazes Through Laboratory Experiments
T0 review · 3 major / 4 minor · reviewed 2026-08-15 · deepseek-v4-flash
Pith's one-line read Exposing laboratory water-world haze analogues to simulated M-dwarf stellar flares changes their transmittance and reflectance, with higher-energy UV producing stronger changes and signs of haze degradation.
desk verdict New laboratory UV-irradiation dataset for water-world haze analogs, but the paper's headline claim overstates what its own statistics support; the valuable part is the carefully hedged body. read the letter →
The pith
A machine-rendered reading of the paper's core claim, the machinery that carries it, and where it could break.
The reading
What carries the argument
The load-bearing objects are two thin films of laboratory photochemical haze deposited on MgF2 substrates, alongside paired transmittance and reflectance measurements from the far-ultraviolet through the mid-infrared. The analysis keys on functional-group absorption bands assigned to O-H, C-H, C=O, C-O, and C≡N bonds, whose relative changes before and after UV exposure are used to infer compositional and chemical changes. Film thickness is estimated from interference fringes, the optical oscillations produced by multiple reflections within the thin film, using an assumed refractive index, and the fringe pattern also provides a time-resolved readout of physical change during irradiation. The two bandpass filters, peaking at 350 nm and 228 nm, serve as lower- and higher-energy flare simulators, and the comparison between them is what carries the claim that higher-energy flares produce stronger alterations.
What would settle it
Measure a replicate set of methane-derived haze films with atomic force microscopy surface roughness and spectroscopic ellipsometry both before and after UV exposure; if the reflectance and transmittance changes disappear once roughness and thickness are accounted for, the claim that stellar-flare UV chemically degrades the haze would not hold.
Extended reading notes
Core claim
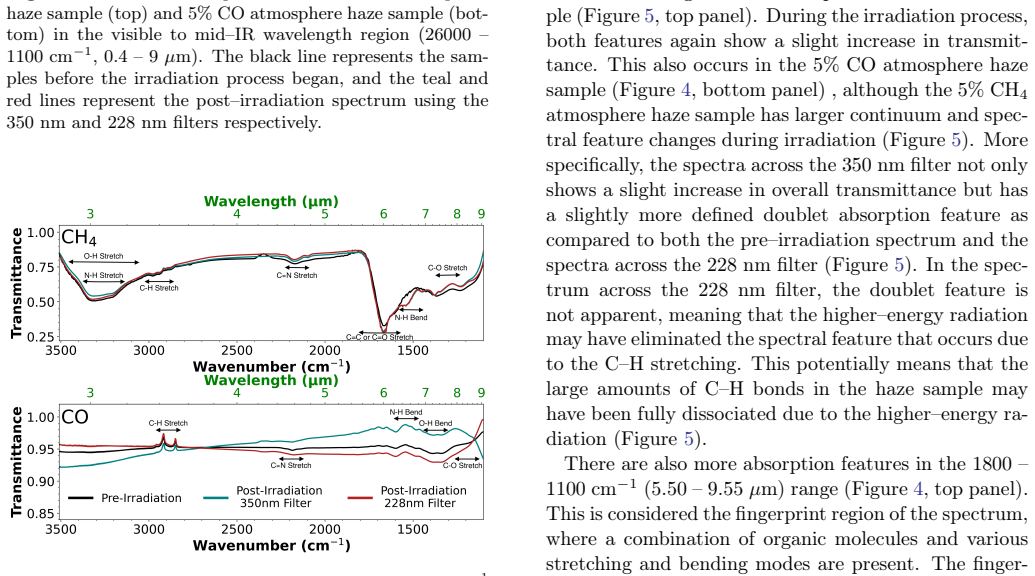
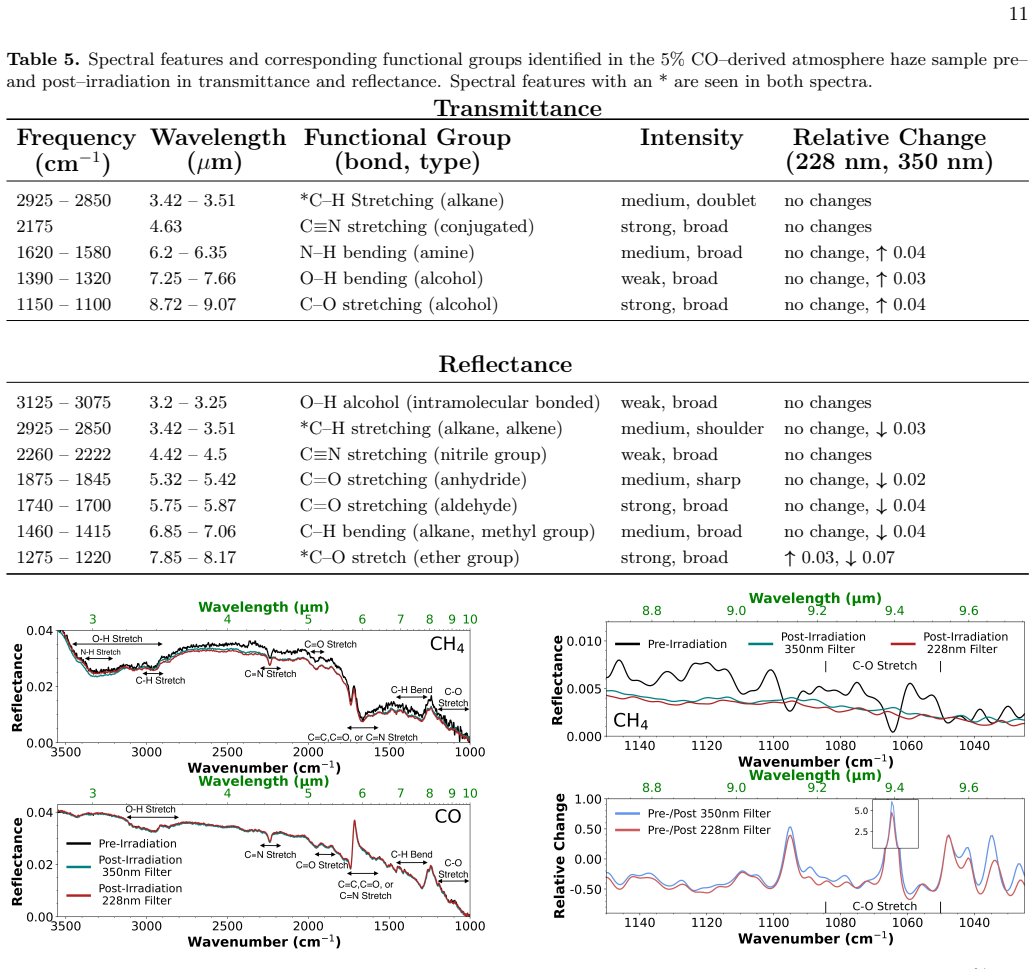
The central claim is that simulated stellar flare UV radiation measurably alters water-world haze analogues, and that the alteration scales with flare energy. Two haze films were produced from high-metallicity water-dominated gas mixtures that differed only in their minor carbon source, 5% CO versus 5% CH4, and each was exposed for ten hours to 350 nm and then 228 nm UV light. The methane-derived haze showed larger spectral changes in both transmittance and reflectance, including loss of O-H, C-H, and C-O features, and its integrated reflectance decreased significantly under the 228 nm filter. The CO-derived haze showed no significant change in thickness or integrated reflectance. The paper interprets these changes as UV-driven dissociation and degradation of haze material, with the implication that high-energy stellar activity could thin or erode water-world haze layers if production does not keep pace.
Load-bearing premise
The reflectance and transmittance changes are attributed to UV-driven chemical change in the haze, but pre-irradiation surface roughness was not measured and the film thickness changes fall within the error bars, so the shifts could instead come from film geometry, substrate effects, or noise.
Editorial extensions
If this is right
- If these laboratory changes carry to real atmospheres, transmission spectra of water-world sub-Neptunes around active M dwarfs should show wavelength-dependent haze opacity changes after flares, not the static haze properties used in current models.
- High-energy flare UV can reduce the reflectance and, potentially, the thickness of methane-bearing water-world hazes, so the haze layer may not survive to shield the lower atmosphere unless haze production replenishes it.
- Haze composition matters: the CO-bearing haze showed no significant reflectance or thickness response under these conditions, so flare-driven degradation should be strongest in atmospheres with substantial methane photochemistry.
- Future retrieval and radiative-transfer models should incorporate flare-processed haze optical constants, since pre- and post-flare spectra differ enough to shift retrieved abundances and particle properties.
Reading between the lines
- A natural testable extension is a dose-response series: expose replicate methane-derived films to increasing UV fluence and check whether integrated reflectance falls monotonically, which would separate degradation from threshold effects.
- Because only two UV bandpasses were tested and XUV was excluded, real M-dwarf flares may degrade hazes more severely than these measurements show, making the reported changes a lower bound for very active stars.
- The chemical-degradation read rests on film-level optics; measuring refractive index and extinction coefficient before and after irradiation, rather than assuming a single refractive index value, would let the inferred mass loss be checked independently.
- If haze destruction is confirmed, water-world habitability becomes a balance between photochemical haze production and flare-driven destruction, so coupling these laboratory rates with atmospheric production models would yield a haze lifetime.
Signed reviews
Editorial analysis
A structured set of objections, weighed in public.
Referee Report
Summary. This paper reports laboratory experiments in which two photochemical haze analogs, one produced from an H2O/N2/CO2/CH4 mixture and one from H2O/N2/CO2/CO, are deposited as thin films on MgF2 substrates and then exposed to UV radiation through two bandpass filters centered at 350 nm and 228 nm. The authors measure transmittance and reflectance from the visible to mid-IR before and after irradiation, and they monitor UV-visible reflectance every 1.5 hours during the 10-hour exposures. The central claim, stated in the abstract and conclusion, is that both simulated flares altered the overall transmittance and reflectance of the hazes, that the higher-energy 228 nm exposure produced more pronounced changes, and that the hazes show signs of degradation that may be relevant to atmospheric retention on water-world exoplanets. The body of the paper, however, reports that the CO-derived sample showed no significant change in integrated reflectance or thickness, and that the 350 nm CH4-derived sample did not show a statistically preferred reflectance decline.
Significance. If the main claim were fully supported, this would be a valuable first laboratory study of UV-induced changes in water-world haze analogs, with implications for interpreting transmission spectra of sub-Neptunes around M dwarfs and for models of haze longevity and atmospheric escape. The paper has notable strengths: a broad spectral range (0.2-9 microns) that overlaps with HST, JWST, and HWO; explicit statistical comparisons of flat versus sloped fits to time-series reflectance; and an unusually candid acknowledgment of several limitations in the body text, including unmeasured pre-irradiation roughness, thickness changes that are within 1-2 sigma, and the absence of replicate samples. The experimental data are likely useful to the exoplanet haze community. However, the abstract and conclusion go beyond what the body's own statistics support, and the physical attribution of the observed reflectance change to chemical degradation is not yet secure. The work is therefore significant but in need of substantial reframing.
major comments (3)
- [Abstract and Section 3.5] The abstract states that 'both simulated flares altered the overall transmittance and reflectance of the hazes,' but the statistics reported in Sections 3.5.1 and 3.5.2 do not support that claim. For the CH4-derived sample under the 350 nm filter, the flat fit has reduced chi-squared 1.1 and the sloped fit 0.77, and after rescaling the sloped fit to reduced chi-squared 1, the delta-BIC drops to 1.75, which the authors themselves describe as not statistically preferred. For the CO-derived sample, both filters yield reduced chi-squared values of 0.22 and 0.36, corresponding to no measurable change. The only statistically preferred decline is the 228 nm CH4 time series, with delta-BIC 3.1. The conclusion in Section 5 that 'UV irradiation does affect the spectra of both haze samples' is similarly stronger than the body's evidence. The abstract and conclusion should be revised to state that a reflectance decline is observed for the CH4-derived haze under the 228 nm filter, while the other combinations show no significant integrated change.
- [Sections 3.1, 3.5.1, and Table 3] The physical attribution of the observed reflectance change to chemical degradation of the haze material is fragile because the surface roughness was not measured before irradiation, the film thickness changes are admitted to be within 1-2 sigma, and there are no replicate samples. Section 3.1 states that pre-irradiation images are unavailable and only post-irradiation RMS roughness values are reported (17.67 nm for CO, 3.08 nm for CH4). Section 3.5.1 and Table 3 show that the CH4 film thickness changes from 0.911 +/- 0.094 microns to 0.862 +/- 0.021 and 0.891 +/- 0.056 microns, overlapping within error. The 228 nm CH4 reflectance decline could therefore arise from film morphology, substrate effects, or noise rather than from bond-selective photochemistry. The authors note the roughness confounder in the Conclusion, but the atmospheric implications in the Discussion depend on a chemical degradation mechanism. At minimum, the paper should frame the results as optical property changes with an unresolved physical mechanism, and should temper the language of 'degradation' and 'destruction' accordingly.
- [Section 4, Discussion] The comparison between the experimental UV flux and a real M-dwarf flare undermines the term 'simulated flare.' The paper states that the lamp output is 1.1 W/m2 over 10 hours and that the quiescent radiation of an M dwarf such as GJ 1214 is approximately 3.5 W/m2, described as 'three times stronger' than the simulated flare. If this comparison is correct, the experiment exposes the hazes to a sub-quiescent UV fluence, not a flare, which is typically orders of magnitude more luminous than quiescence. The authors do note that real flares have higher energy and that larger changes are expected, and they frame the work as a baseline, but the abstract and title language of 'simulated flares' is misleading. The authors should either correct the flux comparison if the bandpasses are different, or explicitly identify the experiment as a low-fluence UV-exposure baseline rather than a flare simulation.
minor comments (4)
- [Section 3.5.1] There is a typo in the sentence 'We further verify our results by carrying out the BIC text' — 'text' should be 'test.'
- [Figures 9 and 10 captions] The captions state that pre- and post-irradiation uncorrected spectra are offset vertically by 0.065, while the corrected and smoothed data are plotted as is. This is somewhat confusing because the top panels appear to mix offset and non-offset spectra; the caption should clarify which curves are offset and which are not.
- [Conclusion, Section 5] The sentence 'we note that the changes we observe for each filter are within 1-sigma uncertainty across the 228 nm filter, and within 2-sigma uncertainty over the 350 nm filter' is not easy to reconcile with Table 3, because the combined pre- and post-irradiation uncertainties for both filters are larger than the differences. The authors should specify how the sigma values are computed (e.g., using only the post-irradiation error bar rather than propagated pre- and post-irradiation errors).
- [Table 1] The table header contains a formatting artifact: 'T able 1' should be 'Table 1' in the table caption.
Circularity Check
No circularity: the paper's central results are direct laboratory measurements of transmittance and reflectance before and after UV irradiation, not derived quantities that reduce to their inputs.
full rationale
This is an experimental laboratory study with no derivation chain whose outputs are forced by inputs. The central claims are measurements: transmittance and reflectance spectra of two haze samples taken before and after irradiation through two bandpass filters, plus time-series integrated reflectance fits. None of these measured quantities is constructed from a fitted parameter that is then renamed as a prediction. The only borrowed numerical input is the assumed refractive index n = 1.7, taken from previous laboratory experiments (He et al. 2022), used in Equation (1) to calculate film thickness from interference fringes. That thickness calculation does not drive the main spectral results, and the paper explicitly states that pre- and post-irradiation thicknesses overlap within error bars (Section 3.1, Table 3, and Section 5), so even if the refractive-index assumption were questioned, it does not force the reflectance or transmittance changes. Self-citations to PHAZER laboratory methods (He et al. 2017; Hörst et al. 2018) are methodological provenance rather than load-bearing circular support. The gap between the abstract's statement that 'both simulated flares altered the overall transmittance and reflectance' and the body's own statistics (e.g., the 350 nm CH4 change is not statistically preferred, and the CO sample shows no change) is a statistical robustness and interpretation concern, not a circularity concern. Therefore the appropriate finding is no significant circularity, score 0.
Assumptions & free parameters
free parameters (1)
- Film refractive index n =
1.7 (assumed, from He et al. 2022)
assumptions (4)
- domain assumption AC glow discharge produces haze analogues representative of photochemical hazes in sub-Neptune water-world atmospheres.
- domain assumption The H2O-dominated, 1000x-solar-metallicity gas composition with 10% N2, 10% CO2, and 5% CO or CH4 captures the important haze-forming chemistry of water-world sub-Neptunes.
- domain assumption Optical changes measured on a thin solid film on a MgF2 substrate can be extrapolated to suspended haze particles in an atmosphere.
- domain assumption A 10-hour exposure at 1.1 W/m2 through the 215-245 nm and 320-380 nm bandpasses is a meaningful representation of M-dwarf flare UV input.
Cite this review
Pith. "Pith review of Effects of Ultraviolet Radiation on Sub-Neptune Exoplanet Hazes Through Laboratory Experiments." pith.science (2026). https://pith.science/paper/VFR4Q6CF
@misc{pith2026250513692,
  author       = {Pith},
  title        = {Pith review of: Effects of Ultraviolet Radiation on Sub-Neptune Exoplanet Hazes Through Laboratory Experiments},
  year         = {2026},
  howpublished = {\url{https://pith.science/paper/VFR4Q6CF}},
  note         = {Machine review of arXiv:2505.13692}
}
read the original abstract
Temperate sub-Neptune exoplanets could contain large inventories of water in various phases, such as water-worlds with water-rich atmospheres or even oceans. Both space-based and ground-based observations have shown that many exoplanets likely also contain photochemically-generated hazes. Haze particles are a key source of organic matter and may impact the evolution or origin of life. In addition, haze layers could provide a mechanism for lower-atmospheric shielding and ultimately atmospheric retention. Often orbiting close to M-dwarf stars, these planets receive large amounts of radiation, especially during flaring events, which may strip away their atmospheres. M-dwarf stars are known to have higher stellar activity than other types of stars, and stellar flares have the potential to accelerate atmospheric escape. In this work, we present results on laboratory investigations of UV radiation effects simulating two different stellar flare energies on laboratory-produced exoplanet hazes made under conditions analogous to water-world atmospheres. We find that both simulated flares altered the overall transmittance and reflectance of the hazes, and higher energy "flares" make those alterations more pronounced. On a larger scale, these laboratory-made hazes show potential signs of degradation over the simulated flaring period. Our results provide insight into the effects that stellar flaring events have on potential exoplanet haze composition and the ability for water-world-like exoplanets to retain their atmospheres.
Figures


Figures from the paper (7 more)




Reference graph
Works this paper leans on
-
[1]
Arney, G., Domagal-Goldman, S. D., Meadows, V. S., et al. 2016, Astrobiology, 16, 873, doi: 10.1089/ast.2015.1422
arXiv 2016
-
[2]
Arney, G. N., Meadows, V. S., Domagal-Goldman, S. D., et al. 2017, ApJ, 836, 49, doi: 10.3847/1538-4357/836/1/49
-
[3]
2024, arXiv e-prints, arXiv:2403.03325, doi: 10.48550/arXiv.2403.03325
Benneke, B., Roy, P.-A., Coulombe, L.-P., et al. 2024, arXiv e-prints, arXiv:2403.03325, doi: 10.48550/arXiv.2403.03325
-
[4]
Benner, S. A., Kim, H.-J., & Biondi, E. 2019, Life, 9, 84, doi: 10.3390/life9040084
-
[5]
Benz, A. O., & Güdel, M. 2010, ARA&A, 48, 241, doi: 10.1146/annurev-astro-082708-101757
-
[6]
Borucki, W. J., Koch, D. G., Basri, G., et al. 2011, ApJ, 736, 19, doi: 10.1088/0004-637X/736/1/19
-
[7]
Brande, J., Crossfield, I. J. M., Kreidberg, L., et al. 2024, ApJL, 961, L23, doi: 10.3847/2041-8213/ad1b5c
-
[8]
Brasseur, C. E., Osten, R. A., & Fleming, S. W. 2019, ApJ, 883, 88, doi: 10.3847/1538-4357/ab3df8
Show all 76 references
-
[9]
P., Lemarchand, G
Buccino, A. P., Lemarchand, G. A., & Mauas, P. J. D. 2007, Icarus, 192, 582, doi: 10.1016/j.icarus.2007.08.012
2007 doi
-
[10]
L., Hörst, S
Cable, M. L., Hörst, S. M., Hodyss, R., et al. 2012, Chemical Reviews, 112, 1882, doi: 10.1021/cr200221x
2012 doi
-
[11]
Gudipati, M. S. 2018, Nature Astronomy, 2, 489, doi: 10.1038/s41550-018-0439-7
2018 doi
-
[12]
2019, Journal of Geophysical Research (Planets), 124, 2599, doi: 10.1029/2018JE005758
Liu, Y. 2019, Journal of Geophysical Research (Planets), 124, 2599, doi: 10.1029/2018JE005758
2019 doi
-
[13]
J., & Kempton, E
Corrales, L., Gavilan, L., Teal, D. J., & Kempton, E. M. R. 2023, ApJL, 943, L26, doi: 10.3847/2041-8213/acaf86
2023 doi
-
[14]
1954, The Strengths of Chemical Bonds (Academic Press)
Cottrell, T. 1954, The Strengths of Chemical Bonds (Academic Press). https://books.google.com/books?id=7J09AAAAIAAJ
1954
-
[15]
Crossfield, I. J. M., & Kreidberg, L. 2017, AJ, 154, 261, doi: 10.3847/1538-3881/aa9279
2017 doi
-
[16]
R., & Patel, M
Dartnell, L. R., & Patel, M. R. 2014, International Journal of Astrobiology, 13, 112, doi: 10.1017/S1473550413000335
2014 doi
-
[17]
D., & Seager, S
Deming, L. D., & Seager, S. 2017, Journal of Geophysical Research (Planets), 122, 53, doi: 10.1002/2016JE005155 do Amaral, L. N. R., Barnes, R., Segura, A., & Luger, R. 2022, ApJ, 928, 12, doi: 10.3847/1538-4357/ac53af 18 Huseby et al
2017 doi
-
[18]
A., et al
Dragomir, D., Benneke, B., Pearson, K. A., et al. 2015, ApJ, 814, 102, doi: 10.1088/0004-637X/814/2/102
2015 doi
-
[19]
M., Pineda, J
Duvvuri, G. M., Pineda, J. S., Berta-Thompson, Z. K., et al. 2021, ApJ, 913, 40, doi: 10.3847/1538-4357/abeaaf
2021 doi
-
[20]
2017, Earth and Planetary Science Letters, 479, 34, doi: 10.1016/j.epsl.2017.09.026
Fleury, B., Carrasco, N., Millan, M., Vettier, L., & Szopa, C. 2017, Earth and Planetary Science Letters, 479, 34, doi: 10.1016/j.epsl.2017.09.026
2017 doi
-
[21]
S., Henderson, B
Fleury, B., Gudipati, M. S., Henderson, B. L., & Swain, M. 2019, ApJ, 871, 158, doi: 10.3847/1538-4357/aaf79f
2019 doi
-
[22]
M., Linsky, J
Fontenla, J. M., Linsky, J. L., Garrison, J., et al. 2016, ApJ, 830, 154, doi: 10.3847/0004-637X/830/2/154
2016 doi
-
[23]
2022, A&A, 661, A23, doi: 10.1051/0004-6361/202141097
Foster, G., Poppenhaeger, K., Ilic, N., & Schwope, A. 2022, A&A, 661, A23, doi: 10.1051/0004-6361/202141097
2022 doi
-
[24]
2013, ApJ, 766, 81, doi: 10.1088/0004-637X/766/2/81
Fressin, F., Torres, G., Charbonneau, D., et al. 2013, ApJ, 766, 81, doi: 10.1088/0004-637X/766/2/81
2013 doi
-
[25]
J., Petigura, E
Fulton, B. J., Petigura, E. A., Howard, A. W., et al. 2017, VizieR Online Data Catalog, J/AJ/154/109, doi: 10.26093/cds/vizier.51540109
2017 doi
-
[26]
R., Moran, S
Gao, P., Wakeford, H. R., Moran, S. E., & Parmentier, V. 2021, Journal of Geophysical Research (Planets), 126, e06655, doi: 10.1029/2020JE006655
2021 doi
-
[27]
P., Lee, E
Gao, P., Thorngren, D. P., Lee, E. K. H., et al. 2020, Nature Astronomy, 4, 951, doi: 10.1038/s41550-020-1114-3
2020 doi
-
[28]
C., & Mason, N
Gavilan, L., Carrasco, N., Vrønning Hoffmann, S., Jones, N. C., & Mason, N. J. 2018, ApJ, 861, 110, doi: 10.3847/1538-4357/aac8df
2018 doi
- [29]
-
[30]
M., Radke, M., & Yant, M
He, C., Hörst, S. M., Radke, M., & Yant, M. 2022, PSJ, 3, 25, doi: 10.3847/PSJ/ac4793
2022 doi
-
[31]
M., Riemer, S., et al
He, C., Hörst, S. M., Riemer, S., et al. 2017, ApJL, 841, L31, doi: 10.3847/2041-8213/aa74cc
2017 doi
-
[32]
M., Lewis, N
He, C., Hörst, S. M., Lewis, N. K., et al. 2018b, AJ, 156, 38, doi: 10.3847/1538-3881/aac883 —. 2020a, PSJ, 1, 51, doi: 10.3847/PSJ/abb1a4 —. 2020b, Nature Astronomy, 4, 986, doi: 10.1038/s41550-020-1072-9
-
[33]
E., et al
He, C., Radke, M., Moran, S. E., et al. 2024, Nature Astronomy, 8, 182, doi: 10.1038/s41550-023-02140-4
2024 doi
-
[34]
J., Jao, W
Henry, T. J., Jao, W. C., Winters, J. G., et al. 2019, VizieR Online Data Catalog, J/AJ/155/265, doi: 10.26093/cds/vizier.51550265 Hörst, S. M. 2017, Journal of Geophysical Research (Planets), 122, 432, doi: 10.1002/2016JE005240 Hörst, S. M., & Tolbert, M. A. 2014, ApJ, 781, 5...
2019 doi
-
[35]
S., Corbett, H., Law, N
Howard, W. S., Corbett, H., Law, N. M., et al. 2020, ApJ, 902, 115, doi: 10.3847/1538-4357/abb5b4
2020 doi
-
[36]
J., Schwartz, R
Hurford, G. J., Schwartz, R. A., Krucker, S., et al. 2003, ApJL, 595, L77, doi: 10.1086/378179
2003 doi
-
[37]
Charlson, R. J. 2000, Reviews of Geophysics, 38, 267, doi: 10.1029/1998RG000045 Jovanović, L., Gautier, T., Vuitton, V., et al. 2020, Icarus, 346, 113774, doi: 10.1016/j.icarus.2020.113774
2000
-
[38]
F., Whitmire, D
Kasting, J. F., Whitmire, D. P., & Reynolds, R. T. 1993, Icarus, 101, 108, doi: 10.1006/icar.1993.1010
1993
-
[39]
2024, ApJ, 967, 95, doi: 10.3847/1538-4357/ad3e7e
Kawamura, Y., Yoshida, T., Terada, N., et al. 2024, ApJ, 967, 95, doi: 10.3847/1538-4357/ad3e7e
2024 doi
- [40]
-
[41]
S., & Schaefer, L
Kite, E. S., & Schaefer, L. 2021, ApJL, 909, L22, doi: 10.3847/2041-8213/abe7dc
2021 doi
-
[42]
A., Benneke, B., Deming, D., & Homeier, D
Knutson, H. A., Benneke, B., Deming, D., & Homeier, D. 2014a, Nature, 505, 66, doi: 10.1038/nature12887
-
[43]
A., Dragomir, D., Kreidberg, L., et al
Knutson, H. A., Dragomir, D., Kreidberg, L., et al. 2014b, ApJ, 794, 155, doi: 10.1088/0004-637X/794/2/155
-
[44]
2022, A&A, 667, A15, doi: 10.1051/0004-6361/202243436
Konings, T., Baeyens, R., & Decin, L. 2022, A&A, 667, A15, doi: 10.1051/0004-6361/202243436
2022 doi
-
[45]
L., Désert, J.-M., et al
Kreidberg, L., Bean, J. L., Désert, J.-M., et al. 2014, Nature, 505, 69, doi: 10.1038/nature12888
2014 doi
-
[46]
Kreidberg, L., Mollière, P., Crossfield, I. J. M., et al. 2022, AJ, 164, 124, doi: 10.3847/1538-3881/ac85be
2022 doi
-
[47]
2009, Optical Properties, 287–318, doi: 10.1016/B978-0-08-054819-7.00010-8
Krevelen, D., & Nijenhuis, K. 2009, Optical Properties, 287–318, doi: 10.1016/B978-0-08-054819-7.00010-8
2009 doi
-
[48]
Lammer, H., Lichtenegger, H. I. M., Kulikov, Y. N., et al. 2007, Astrobiology, 7, 185, doi: 10.1089/ast.2006.0128
2007
-
[49]
E., Berta-Thompson, Z
Libby-Roberts, J. E., Berta-Thompson, Z. K., Désert, J.-M., et al. 2020, AJ, 159, 57, doi: 10.3847/1538-3881/ab5d36
2020 doi
-
[50]
L., Ip, W
Lin, C. L., Ip, W. H., Hou, W. C., Huang, L. C., & Chang, H. Y. 2019, ApJ, 873, 97, doi: 10.3847/1538-4357/ab041c
2019 doi
-
[51]
L., Fontenla, J., & France, K
Linsky, J. L., Fontenla, J., & France, K. 2014, ApJ, 780, 61, doi: 10.1088/0004-637X/780/1/61
2014 doi
-
[52]
J., Miguel, Y., Tsai, S.-M., et al
Louca, A. J., Miguel, Y., Tsai, S.-M., et al. 2023, MNRAS, 521, 3333, doi: 10.1093/mnras/stac1220
2023 doi
-
[53]
Loyd, R. O. P., France, K., Youngblood, A., et al. 2016, ApJ, 824, 102, doi: 10.3847/0004-637X/824/2/102
2016 doi
-
[54]
2015, Astrobiology, 15, 57, doi: 10.1089/ast.2014.1215
Luger, R., Barnes, R., Lopez, E., et al. 2015, Astrobiology, 15, 57, doi: 10.1089/ast.2014.1215
2015
-
[55]
2022, Science, 377, 1211, doi: 10.1126/science.abl7164 19
Luque, R., & Pallé, E. 2022, Science, 377, 1211, doi: 10.1126/science.abl7164 19
2022 doi
-
[56]
I., Rigby, F., & Barrier, E
Madhusudhan, N., Moses, J. I., Rigby, F., & Barrier, E. 2023, Faraday Discussions, 245, 80, doi: 10.1039/D3FD00075C
2023 doi
-
[57]
S., Ackerman, A
Marley, M. S., Ackerman, A. S., Cuzzi, J. N., & Kitzmann, D. 2013, in Comparative Climatology of Terrestrial Planets, ed. S. J. Mackwell, A. A. Simon-Miller, J. W. Harder, & M. A. Bullock, 367–392, doi: 10.2458/azu_uapress_9780816530595-ch015
2013 doi
-
[58]
L., & Rugheimer, S
Miguel, Y., Kaltenegger, L., Linsky, J. L., & Rugheimer, S. 2015, MNRAS, 446, 345, doi: 10.1093/mnras/stu2107
2015 doi
-
[59]
E., Hörst, S
Moran, S. E., Hörst, S. M., Vuitton, V., et al. 2020, PSJ, 1, 17, doi: 10.3847/PSJ/ab8eae
2020 doi
-
[60]
E., Hörst, S
Moran, S. E., Hörst, S. M., He, C., et al. 2022, Journal of Geophysical Research (Planets), 127, e06984, doi: 10.1029/2021JE006984
2022 doi
-
[61]
2009, A&A, 501, 1139, doi: 10.1051/0004-6361/200810301
Mordasini, C., Alibert, Y., & Benz, W. 2009, A&A, 501, 1139, doi: 10.1051/0004-6361/200810301
2009 doi
-
[62]
V., Fortney, J
Morley, C. V., Fortney, J. J., Kempton, E. M. R., et al. 2013, ApJ, 775, 33, doi: 10.1088/0004-637X/775/1/33
2013 doi
-
[63]
I., Line, M
Moses, J. I., Line, M. R., Visscher, C., et al. 2013, ApJ, 777, 34, doi: 10.1088/0004-637X/777/1/34
2013 doi
-
[64]
1987, Journal of Physics E Scientific Instruments, 20, 894, doi: 10.1088/0022-3735/20/7/015
Neri, F., Saitta, G., & Chiofalo, S. 1987, Journal of Physics E Scientific Instruments, 20, 894, doi: 10.1088/0022-3735/20/7/015
1987 doi
-
[65]
2020, ApJL, 895, L47, doi: 10.3847/2041-8213/ab93d7
Ohno, K., & Kawashima, Y. 2020, ApJL, 895, L47, doi: 10.3847/2041-8213/ab93d7
2020 doi
-
[66]
L., Hauschildt, P
Peacock, S., Barman, T., Shkolnik, E. L., Hauschildt, P. H., & Baron, E. 2019, ApJ, 871, 235, doi: 10.3847/1538-4357/aaf891
2019 doi
-
[67]
D., McLain, J
Pirim, C., Gann, R. D., McLain, J. L., & Orlando, T. M. 2015, Icarus, 258, 109, doi: 10.1016/j.icarus.2015.06.006
2015 doi
-
[68]
Rancourt, J. D. 1987, in Optical thin films. User’s handbook. https://api.semanticscholar.org/CorpusID:110836929
1987
-
[69]
Ranjan, S., Wordsworth, R., & Sasselov, D. D. 2017, ApJ, 843, 110, doi: 10.3847/1538-4357/aa773e
2017 doi
-
[70]
B., Xu, J., Thompson, S
Rimmer, P. B., Xu, J., Thompson, S. J., et al. 2018, Science Advances, 4, eaar3302, doi: 10.1126/sciadv.aar3302
2018 doi
-
[71]
2015, ApJ, 809, 57, doi: 10.1088/0004-637X/809/1/57
Mohanty, S. 2015, ApJ, 809, 57, doi: 10.1088/0004-637X/809/1/57
2015 doi
-
[72]
2005, The Physics of Thin Film Optical
Stenzel, O. 2005, The Physics of Thin Film Optical
2005
- [73]
-
[74]
N., Force, M., Briggs, R
Tran, B. N., Force, M., Briggs, R. G., et al. 2008, Icarus, 193, 224, doi: 10.1016/j.icarus.2007.09.010
2008 doi
-
[75]
E., He, C., et al
Vuitton, V., Moran, S. E., He, C., et al. 2021, PSJ, 2, 2, doi: 10.3847/PSJ/abc558
2021 doi
-
[76]
I., Fortney, J
Yu, X., Moses, J. I., Fortney, J. J., & Zhang, X. 2021, ApJ, 914, 38, doi: 10.3847/1538-4357/abfdc7
2021 doi
Reviewed August 15, 2026 · model on record in the stance chip above.
Discussion (0). Continue with ORCID to comment.