REVIEW 3 major objections 5 minor 20 references
STA-Risk: A Deep Dive of Spatio-Temporal Asymmetries for Breast Cancer Risk Prediction
T0 review · 3 major / 5 minor · reviewed 2026-08-07 · deepseek-v4-flash
Pith's one-line read STA-Risk claims that jointly modeling left-right and across-exam asymmetries in longitudinal mammograms improves 1- to 5-year breast cancer risk prediction beyond prior models.
desk verdict Plausible asymmetry-aware architecture with a clear write-up, but the SOTA-comparison claim is missing the two closest baselines and the evaluation ignores within-patient correlation. read the letter →
The pith
A machine-rendered reading of the paper's core claim, the machinery that carries it, and where it could break.
The reading
What carries the argument
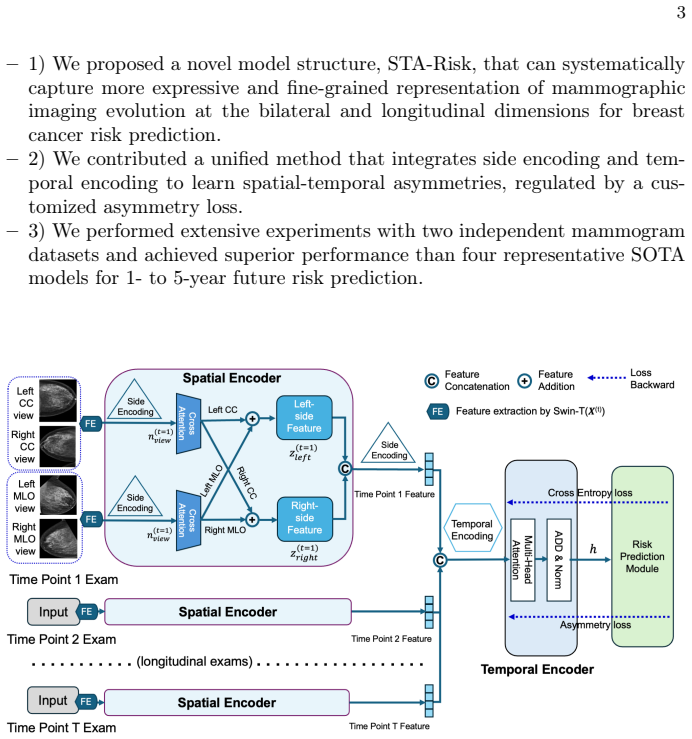
The engine is a two-stage Transformer. A tiny Swin Transformer extracts patch features from each of the four mammographic views; a learnable side embedding $v_{\mathrm{left}} / v_{\mathrm{right}}$ is added so left and right identity survives attention. A sinusoidal temporal embedding $TEmb(\tau_t)$, computed from the month distance to the reference exam, records irregular visit intervals. After cross-attention, each exam yields left and right embeddings $z_{\mathrm{left}}^{(t)}$ and $z_{\mathrm{right}}^{(t)}$; the asymmetry loss penalizes the distances $D_t = \| z_{\mathrm{left}}^{(t)} - z_{\mathrm{right}}^{(t)} \|$ and $\Delta_t = \| z_{\mathrm{left}}^{(t)} - z_{\mathrm{left}}^{(t+1)} \|$ (and symmetrically for the right side) with target-dependent margins. An additive-hazard head converts the final history embedding into cumulative 1- to 5-year risk.
What would settle it
Recompute the AUC and C-index for STA-Risk and LoMaR using a clustered bootstrap that resamples women rather than exams, or evaluate on a cohort where each woman contributes exactly one reference exam; if STA-Risk's margin over LoMaR disappears, the superiority claim is not supported.
Extended reading notes
Core claim
The central claim is that fine-grained spatiotemporal asymmetry, captured simultaneously from bilateral (left-right) and longitudinal (across-exam) comparisons, carries predictive signal for future breast cancer that is not fully exploited by single-exam models or by simple left-right subtraction. STA-Risk preserves breast-side identity by adding a learnable side embedding to patch features, preserves chronological order by adding a sinusoidal temporal embedding based on months before the reference exam, and uses a margin-based asymmetry loss on the Euclidean distance between left and right embeddings and on exam-to-exam embedding changes. The authors show that the complete model outperforms four representative baselines on both datasets for 1- to 5-year risk prediction, and their ablation studies attribute gains to all three components, with temporal encoding especially important for longer horizons.
Load-bearing premise
The evaluation treats each mammogram exam of a patient as an independent risk sample, so repeated correlated exams from the same woman enter the test set as separate observations; if serial exams are correlated, the reported C-index and AUC are optimistically biased.
Editorial extensions
If this is right
- If the reported gains hold, screening programs could use a woman's serial mammograms to rank her 1- to 5-year risk without waiting for a visible lesion.
- The model's handling of irregular intervals means it can be applied to real screening histories where exams are not exactly one year apart.
- Ablation results imply that temporal attention is the largest contributor for long-horizon predictions, while side encoding and asymmetry loss add smaller consistent gains.
- Because the model outputs cumulative risk for k=1..5 from one history embedding, it can be recalibrated for different screening intervals without retraining.
Reading between the lines
- Not tested in the paper: the per-exam sampling design probably inflates apparent discrimination; a patient-clustered evaluation or one-sample-per-woman test would give a more conservative estimate of real-world ranking.
- Not tested in the paper: the side-embedding plus temporal-embedding recipe could transfer to other paired longitudinal imaging tasks, such as retinal or lung follow-up, where asymmetry is clinically meaningful.
- Not tested in the paper: the margin hyperparameters in the asymmetry loss were tuned on the same data used to report results; external validation with fixed margins would test whether the loss's benefit is robust.
Editorial analysis
A structured set of objections, weighed in public.
Referee Report
Summary. The paper proposes STA-Risk, a Transformer-based model for breast cancer risk prediction from longitudinal screening mammograms. The model combines a side encoding that preserves left/right breast identity, a temporal encoding that handles irregular exam intervals, and a customized asymmetry loss that regularizes bilateral and longitudinal differences. The authors evaluate on two datasets (CSAW-CC and an independent case-control cohort) using patient-level 5-fold cross-validation, reporting C-index and AUC for 1- to 5-year risk prediction, and compare against Mirai, LRP-NET, LoMaR, and PRIME+. The reported results show STA-Risk with the highest C-index on both datasets (0.722 and 0.732) and an ablation study indicating that the full combination of side encoding, temporal encoding, and asymmetry loss performs best.
Significance. If the reported performance holds, the paper makes a useful contribution to mammography-based risk prediction by explicitly modeling bilateral asymmetry and longitudinal tissue evolution in a unified architecture. The clinical motivation is strong, the method is described clearly, and the evaluation includes two datasets with patient-level splits and an ablation study, which are good practices. The promise of released source code is also a positive. However, the central superiority claim is not yet fully established: the evaluation treats repeated exams from the same patient as independent samples, the comparison omits the closest asymmetry-aware baselines (AsymMirai and RADIFUSION), and the ablation differences are comparable to fold-to-fold variability. These are fixable with additional analysis and experiments, so the contribution is potentially valuable but requires revision.
major comments (3)
- [§3.2, Table 1] The evaluation treats each mammogram exam as an independent reference time point, so a patient with multiple screening visits contributes multiple test samples. With serial exams from the same woman being positively correlated, the effective sample size is smaller than the number of exam-level samples, and the reported C-index/AUC values and their confidence intervals can be optimistically biased. Please provide patient-level clustered estimates, such as cluster bootstrap or mixed-effects calibration, or report a patient-level summary statistic (e.g., one prediction per patient) as the primary endpoint.
- [§1, Table 1] The paper's central claim is about capturing asymmetry, yet the comparison set excludes the two most directly related asymmetry-aware longitudinal baselines: AsymMirai (Ref. [2]) and RADIFUSION (Ref. [18]), both cited in the introduction. Without head-to-head comparison against these models, the statement 'superior performance than four representative SOTA models' is only established against models that do not treat bilateral asymmetry as a first-class mechanism. Please add these baselines to Table 1, or justify their omission with concrete experimental reasons.
- [Table 2] On the Independent dataset, the full model achieves C-index 0.732, versus 0.728 for side+asym and 0.725 for side+tmp, while the reported fold-to-fold standard deviations are ±0.02. These differences are well within the reported variability, so the ablation does not robustly demonstrate that the temporal encoding and the asymmetry loss each contribute independently. Please report paired statistical significance tests (e.g., DeLong test or permutation test over patient-level predictions) and confidence intervals for the ablation comparisons, and discuss which component differences are statistically meaningful.
minor comments (5)
- [§3.2] There is a typo in '80-20 radio'; it should read '80-20 ratio'. Also, 'Primte+' should be 'PRIME+'.
- [Fig. 2 caption] The word 'caner' in the caption should be 'cancer'.
- [Eq. (1), §2.2] The notation n^{(t)}_{view} is described as both a feature embedding and later as patch tokens; please clarify whether the side embedding is added to the patch-token sequence or to a pooled exam-level feature, since this affects how the spatial encoder consumes the side information.
- [§2.4] Equation (5) uses D and Δ averaged over T time points, but the definition says 'we compute the average D over T time points' and 'average Δ over T time points'; please state explicitly whether T is the number of available prior exams (which can vary per patient) and how variable-length sequences are handled in the loss computation.
- [§3.2] The paper reports both C-index and AUC but does not define how the C-index is computed for the multi-year risk predictions; please specify the risk score used for C-index evaluation and how censoring or follow-up time is handled.
Circularity Check
No significant circularity; the central result is an empirical benchmark with independent external baselines.
full rationale
This is an empirical deep-learning paper rather than a derivation. The central claim, that STA-Risk outperforms four representative models for 1- to 5-year risk prediction, is supported by patient-level 5-fold cross-validation on two independent datasets against externally published baselines (Mirai, LoMaR, PRIME+, and LRP-NET). The prediction itself is produced by an additive-hazard head over a learned embedding h, not by the asymmetry distances D or Delta used in the regularizer; Equations (5) and (6) define a training loss that shapes the embedding, but the reported C-index and AUC are measured on the model's risk output, so the results are not forced by construction. Self-citations such as LRP-NET and Zheng et al. appear as prior baseline work or motivating evidence, but they are not used as the authority for the superiority claim, and no uniqueness theorem or ansatz is imported from the authors' earlier papers to rule out alternatives. The absence of AsymMirai and RADIFUSION from the comparison table is a competitive-evaluation limitation, not circularity. Thus no load-bearing step reduces to its own inputs.
Assumptions & free parameters
free parameters (3)
- Asymmetry loss margins m1, m1_prime, m2, m2_prime =
1
- Asymmetry loss weight lambda =
0.01
- Maximum number of prior exams traced =
up to 3
assumptions (4)
- domain assumption Bilateral mammographic asymmetry is a clinically relevant biomarker for breast cancer risk.
- domain assumption Longitudinal tissue evolution on screening mammograms carries risk information beyond a single time point.
- domain assumption Libra breast segmentation correctly isolates breast tissue in these Hologic mammograms.
- standard math Standard attention, sinusoidal encoding, and additive hazard formulations are accepted building blocks.
Cite this review
Pith. "Pith review of STA-Risk: A Deep Dive of Spatio-Temporal Asymmetries for Breast Cancer Risk Prediction." pith.science (2026). https://pith.science/paper/VHGMUYEQ
@misc{pith2026250521699,
  author       = {Pith},
  title        = {Pith review of: STA-Risk: A Deep Dive of Spatio-Temporal Asymmetries for Breast Cancer Risk Prediction},
  year         = {2026},
  howpublished = {\url{https://pith.science/paper/VHGMUYEQ}},
  note         = {Machine review of arXiv:2505.21699}
}
read the original abstract
Predicting the risk of developing breast cancer is an important clinical tool to guide early intervention and tailoring personalized screening strategies. Early risk models have limited performance and recently machine learning-based analysis of mammogram images showed encouraging risk prediction effects. These models however are limited to the use of a single exam or tend to overlook nuanced breast tissue evolvement in spatial and temporal details of longitudinal imaging exams that are indicative of breast cancer risk. In this paper, we propose STA-Risk (Spatial and Temporal Asymmetry-based Risk Prediction), a novel Transformer-based model that captures fine-grained mammographic imaging evolution simultaneously from bilateral and longitudinal asymmetries for breast cancer risk prediction. STA-Risk is innovative by the side encoding and temporal encoding to learn spatial-temporal asymmetries, regulated by a customized asymmetry loss. We performed extensive experiments with two independent mammogram datasets and achieved superior performance than four representative SOTA models for 1- to 5-year future risk prediction. Source codes will be released upon publishing of the paper.
Figures

Reference graph
Works this paper leans on
-
[2]
Radiology310(3), e232780 (2024)
Donnelly, J., Moffett, L., Barnett, A.J., Trivedi, H., Schwartz, F., Lo, J., Rudin, C.: Asymmirai: Interpretable mammography-based deep learning model for 1–5-year breast cancer risk prediction. Radiology310(3), e232780 (2024)
2024
-
[18]
arXiv preprint arXiv:2304.00257 (2023)
Yeoh, H.H., Liew, A., Phan, R., Strand, F., Rahmat, K., Nguyen, T.L., Hopper, J.L., Tan, M.: Radifusion: A multi-radiomics deep learning based breast cancer risk prediction model using sequential mammographic images with image attention and bilateral asymmetry refinement. arXiv preprint arXiv:2304.00257 (2023)
arXiv 2023
-
[1]
Pattern recognition132, 108919 (2022)
Dadsetan, S., Arefan, D., Berg, W.A., Zuley, M.L., Sumkin, J.H., Wu, S.: Deep learning of longitudinal mammogram examinations for breast cancer risk predic- tion. Pattern recognition132, 108919 (2022)
work page 2022
-
[3]
Breast cancer research9, 1–8 (2007)
Evans, D.G.R., Howell, A.: Breast cancer risk-assessment models. Breast cancer research9, 1–8 (2007)
2007
-
[4]
The Journal for Nurse Practitioners12(9), 581–592 (2016)
Himes, D.O., Root, A.E., Gammon, A., Luthy, K.E.: Breast cancer risk assess- ment: calculating lifetime risk using the tyrer-cuzick model. The Journal for Nurse Practitioners12(9), 581–592 (2016)
work page 2016
-
[5]
NPJ Digital Medicine7(1), 216 (2024)
Holste, G., Lin, M., Zhou, R., Wang, F., Liu, L., Yan, Q., Van Tassel, S.H., Kovacs, K.,Chew,E.Y.,Lu,Z.,etal.:Harnessingthepoweroflongitudinalmedicalimaging for eye disease prognosis using transformer-based sequence modeling. NPJ Digital Medicine7(1), 216 (2024)
work page 2024
-
[6]
In: International Conference on Medical Image Computing and Computer-Assisted Intervention
Karaman, B.K., Dodelzon, K., Akar, G.B., Sabuncu, M.R.: Longitudinal mammo- gram risk prediction. In: International Conference on Medical Image Computing and Computer-Assisted Intervention. pp. 437–446. Springer (2024) 11
work page 2024
-
[7]
Breast cancer research17, 1–17 (2015)
Keller, B.M., Chen, J., Daye, D., Conant, E.F., Kontos, D.: Preliminary evaluation of the publicly available laboratory for breast radiodensity assessment (libra) soft- ware tool: comparison of fully automated area and volumetric density measures in a case–control study with digital mammography. Breast cancer research17, 1–17 (2015)
work page 2015
Show all 20 references
-
[8]
Medical physics39(8), 4903–4917 (2012)
Keller, B.M., Nathan, D.L., Wang, Y., Zheng, Y., Gee, J.C., Conant, E.F., Kontos, D.: Estimation of breast percent density in raw and processed full field digital mammography images via adaptive fuzzy c-means clustering and support vector machine segmentation. Medical physics3...
2012
-
[9]
In: International Conference on Med- ical Image Computing and Computer-Assisted Intervention
Lee, H., Kim, J., Park, E., Kim, M., Kim, T., Kooi, T.: Enhancing breast cancer risk prediction by incorporating prior images. In: International Conference on Med- ical Image Computing and Computer-Assisted Intervention. pp. 389–398. Springer (2023)
2023
-
[10]
Liu, Z., Lin, Y., Cao, Y., Hu, H., Wei, Y., Zhang, Z., Lin, S., Guo, B.: Swin transformer:Hierarchical visiontransformerusingshiftedwindows.In:Proceedings of the IEEE/CVF international conference on computer vision. pp. 10012–10022 (2021)
2021
-
[11]
Journal of behavioral medicine27, 205–214 (2004)
Quillin, J.M., Fries, E., McClish, D., DeParedes, E.S., Bodurtha, J.: Gail model risk assessment and risk perceptions. Journal of behavioral medicine27, 205–214 (2004)
2004
-
[12]
Breast cancer research8, 1–7 (2006)
Scutt, D., Lancaster, G.A., Manning, J.T.: Breast asymmetry and predisposition to breast cancer. Breast cancer research8, 1–7 (2006)
2006
-
[13]
Radiological Physics and Technology16(1), 20–27 (2023)
Shimokawa, D., Takahashi, K., Kurosawa, D., Takaya, E., Oba, K., Yagishita, K., Fukuda,T.,Tsunoda,H.,Ueda,T.:Deeplearningmodelforbreastcancerdiagnosis based on bilateral asymmetrical detection (bilad) in digital breast tomosynthesis images. Radiological Physics and Technology1...
2023
-
[14]
CA: a cancer journal for clinicians73(1), 17–48 (2023)
Siegel, R.L., Miller, K.D., Wagle, N.S., Jemal, A.: Cancer statistics, 2023. CA: a cancer journal for clinicians73(1), 17–48 (2023)
2023
-
[15]
arXiv preprint arXiv:2101.04909 (2021)
Sriram, A., Muckley, M., Sinha, K., Shamout, F., Pineau, J., Geras, K.J., Azour, L., Aphinyanaphongs, Y., Yakubova, N., Moore, W.: Covid-19 prognosis via self- supervised representation learning and multi-image prediction. arXiv preprint arXiv:2101.04909 (2021)
2021 arXiv
-
[16]
Dataset (2022), https://doi.org/10.5878/45vm-t798
Strand, F.: Csaw-cc (mammography) – a dataset for ai research to im- prove screening, diagnostics and prognostics of breast cancer. Dataset (2022), https://doi.org/10.5878/45vm-t798
2022 doi
-
[17]
Science Translational Medicine13(578), eaba4373 (2021)
Yala, A., Mikhael, P.G., Strand, F., Lin, G., Smith, K., Wan, Y.L., Lamb, L., Hughes, K., Lehman, C., Barzilay, R.: Toward robust mammography-based models for breast cancer risk. Science Translational Medicine13(578), eaba4373 (2021)
2021
-
[19]
European journal of radiology81(11), 3222–3228 (2012)
Zheng, B., Sumkin, J.H., Zuley, M.L., Wang, X., Klym, A.H., Gur, D.: Bilateral mammographic density asymmetry and breast cancer risk: a preliminary assess- ment. European journal of radiology81(11), 3222–3228 (2012)
2012
-
[20]
The breast journal20(3), 249–257 (2014)
Zheng, B., Tan, M., Ramalingam, P., Gur, D.: Association between computed tissue density asymmetry in bilateral mammograms and near-term breast cancer risk. The breast journal20(3), 249–257 (2014)
2014
Reviewed August 7, 2026 · model on record in the stance chip above.
Discussion (0). Sign in to comment.