REVIEW 4 major objections 4 minor 62 references
Patient Similarity Computation for Clinical Decision Support: An Efficient Use of Data Transformation, Combining Static and Time Series Data
T0 review · 4 major / 4 minor · reviewed 2026-08-07 · deepseek-v4-flash
Pith's one-line read Similarity-based heart-disease prediction improves when static data are transformed before clustering.
desk verdict The reported CAD/CHF gains are likely label leakage through aWOE; the Spark DTW engineering is real but the central result is not credible as presented. read the letter →
The pith
A machine-rendered reading of the paper's core claim, the machinery that carries it, and where it could break.
The reading
What carries the argument
The load-bearing object is the neighborhood similarity fusion: for each time-series variate, a DTW distance matrix is computed between a target patient and patients in the same static-data cluster, the per-variate nearest neighbors are unioned into a similarity fusion, and the majority label among those neighbors is assigned. The other named component is adaptive Weight-of-Evidence (aWOE), a binning transform that replaces each static feature value with the log-ratio of positive to negative outcome counts within its bin, plus a small constant; the paper argues this transformation both improves cluster quality and obscures raw patient values, and it reports that aWOE consistently beats Z-score and no-transformation variants.
What would settle it
Re-run the aWOE-K-means pipeline twice, once with aWOE bins computed from the true disease label and once with bins computed from a shuffled binary label assigned randomly to the same patients; if the AUC and F-measure gains shrink or disappear in the shuffled case, the transformation's reported benefit is attributable to target leakage rather than to the transformation itself.
Extended reading notes
Core claim
The central claim is that the gain in patient-similarity prediction comes from the data transformation, not from the clustering or the time-series distance alone. With the aWOE-K-means variant, the model reaches an AUC of 0.858, accuracy of 0.870, and F-measure of 0.896 for coronary artery disease, and an AUC of 0.878, accuracy of 0.887, and F-measure of 0.816 for congestive heart failure; without any transformation the same pipeline drops to AUC values near 0.61 for both diseases. The paper further reports that a 12-hour observation window recovers almost all of the performance of the full-length time series (F-measure differences of 3.13 and 4.12 for the two diseases), and that adding computing nodes reduces the DTW computation time, making the method viable for real-time use.
Load-bearing premise
The load-bearing premise is that the binary outcome used to compute the aWOE transformation and the disease labels used as clustering features are not the same as, or strongly correlated with, the disease being predicted; if they are, the reported improvements could come from target information leaking into the features rather than from better similarity learning.
Editorial extensions
If this is right
- If the transformation result holds, a simple preprocessing change—aWOE on static features—can lift the accuracy of similarity-based CAD and CHF prediction above all tested baselines, including LSTM and Transformer models.
- The 12-hour result implies that intensive-care monitoring windows of half a day are enough for near-optimal patient matching, which matters for emergency settings where full histories are unavailable.
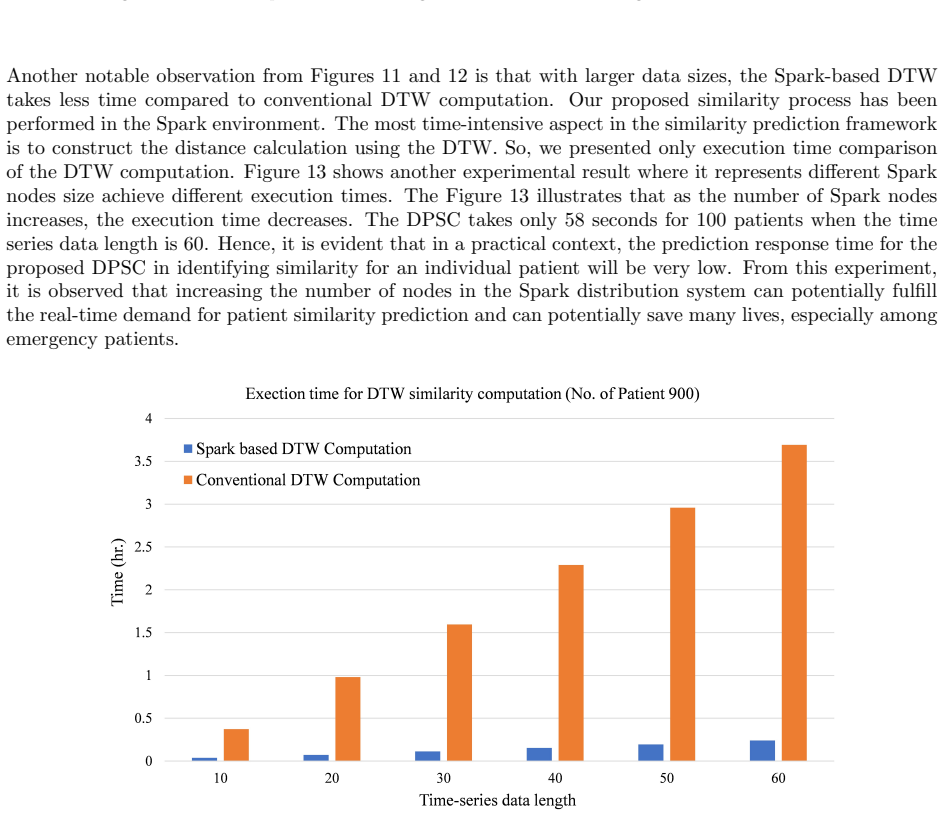
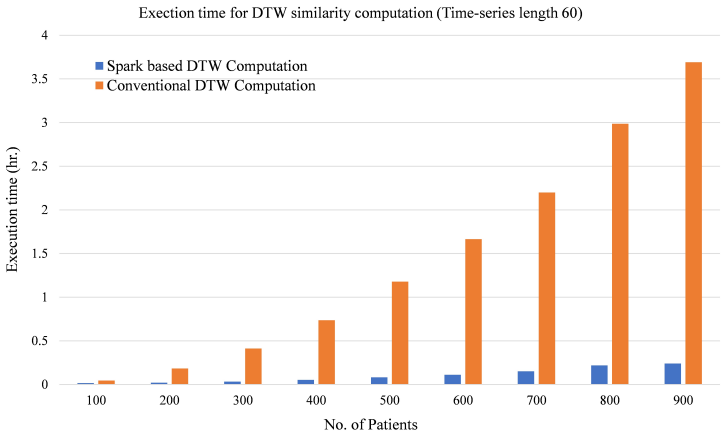
- The reported runtime scaling, with the full pipeline taking roughly 53 seconds per target patient on a 100-patient cohort, implies distributed DTW can meet real-time decision-support demands as node counts grow.
- Because the neighborhood fusion ignores a variate when a patient's record is missing it, the method has a built-in tolerance for missing time-series data.
Reading between the lines
- Editorial inference: the aWOE scores in Eq. (1) are computed from distributions of positive and negative events, and the paper does not state that this outcome label is different from the disease being predicted; if the same label feeds the transformation and the clustering features (CHF appears as a clustering feature for CAD and vice versa), part of the reported gain could reflect target leakage
- Editorial inference: the privacy claim rests on the aWOE binning being a generalization-based anonymity mechanism; a concrete re-identification attack or a k-anonymity audit on the transformed static matrix would test that guarantee directly.
- Editorial inference: the 40% runtime reduction is measured on one cluster configuration; the released code would allow a reader to check whether the speedup transfers to longer time series or larger cohorts.
Editorial analysis
A structured set of objections, weighed in public.
Referee Report
Summary. The paper proposes a distributed patient similarity computation (DPSC) method that combines dynamic time warping (DTW) on 18 time series variables with clustering on static patient data. Before clustering, the static data are transformed with either adaptive Weight-of-Evidence (aWOE) or Z-score. For a target patient, the nearest neighbor is selected from the same cluster using a fusion of per-variate DTW distance matrices, and the neighbor's label is used for prediction. The method is evaluated on MIMIC-III for predicting Coronary Artery Disease (CAD) and Congestive Heart Failure (CHF), with claims of large improvements over non-transformed baselines and a 40% runtime reduction from Spark-based distributed DTW. The central claim is that the aWOE transformation and the clustering step improve patient similarity prediction.
Significance. If the reported results are valid, the paper would offer a practical distributed approach to patient similarity that integrates static and time series data with a privacy-oriented transformation, and it would provide a useful benchmark for CAD and CHF prediction on MIMIC-III. The use of a public dataset, the comparison against several baselines, and the availability of code are strengths. However, the significance hinges entirely on whether the aWOE transformation and clustering are free of target leakage; the current manuscript does not establish this, so the headline improvements cannot be taken at face value.
major comments (4)
- [Section 2.2.1, Eq. (1)] Equation (1) defines aWOE using the 'Distribution of positive events' and 'Distribution of negative events' but does not specify which binary outcome defines these events. Since Section 2.1.1 lists Coronary Artery Disease and Congestive Heart Failure among the static features, and Section 2.3 uses these disease labels as clustering features, the aWOE transformation may be target-encoding the very outcome being predicted. If the outcome in Eq. (1) is the same as the prediction target, then the clusters from which nearest neighbors are drawn are constructed with label information, and the performance gaps in Table 3 (e.g., aWOE K-means CAD AUC 0.858 vs. No-DT K-means 0.605) would be artifacts of leakage rather than evidence of genuine similarity learning. The manuscript must specify, for each prediction task, the outcome used to compute aWOE and confirm that this outcome is not the target or a direct proxy for it.
- [Section 2.3] The text states that for CHF prediction, the Coronary Artery Disease attribute is included as a clustering feature, and for CAD prediction, Congestive Heart Failure is included, with only the target attribute itself disregarded. Because CAD and CHF are strongly correlated cardiovascular conditions, using the other disease label as a clustering feature is a probable channel of label leakage: the cluster assignment, and hence the available pool of nearest neighbors, is influenced by a label that is highly predictive of the target. The authors should report the correlation between the two labels and evaluate a variant that excludes both disease labels from the static feature set used for clustering.
- [Section 3.2 and Section 2.9] Section 3.2 describes selecting the number of clusters K based on the average performance over five runs and reports optimal values (K=125 for CAD, K=150 for CHF), but it does not clarify whether this selection used the test split. If the test set was used to choose K, the reported peak performance is optimistically biased. Moreover, Section 2.9 describes an 80/20 train/test split but does not state whether the aWOE binning and the clustering are fitted on the training fold only; if the transformation or clustering uses the full dataset, including test patients, then test labels and feature distributions leak into neighbor selection. Please clarify the validation protocol and, if needed, re-run the evaluation with the selection and fitting steps strictly inside the training folds.
- [Section 4, Table 5] The Holm post-hoc table lists the comparison 'aWOE based DPSC vs. Z-score based DPSC' with P-value 0.133614 and marks the hypothesis as 'Rejected', which is inconsistent because 0.133614 exceeds the adjusted alpha of 0.05. In addition, the significance level is given as α=0.5 in the narrative text of Section 4 while Section 2.12 states α=0.05. These inconsistencies undermine the statistical-significance claim and should be corrected.
minor comments (4)
- [Section 2.7] The symbol K is used both for the number of clusters and for the number of univariate time series (K=18), which is confusing; please use distinct symbols (e.g., C for clusters and V for variates).
- [Table 3] For CAD with No-DT OPTICS, specificity is reported as 0.81 but recall as 0.375, yielding an F-measure of 0.503; a brief explanation of this imbalance would help the reader interpret the row.
- [Abstract and Section 3.4] The abstract claims computation time reduction 'by as high as 40%', but Figures 11–13 compare runtime only for DTW distance computation, not for the full DPSC pipeline; please specify the scope of the 40% claim.
- [Section 2.7, Eq. (5)] The fusion function F in Eq. (5) is not defined formally; please state how the K distance matrices are combined (e.g., averaging, max, or weighted sum).
Circularity Check
aWOE features are target-encoded by Eq. (1), so the clusters that determine nearest neighbors encode the very label being predicted; the reported gains reduce in substantial part to self-prediction.
-
self definitional
[Section 2.2.1, Eq. (1); applied in Sections 2.3 and 2.9]
"The mathematical equation of the aWOE can be expressed as: aWOE = ln(Distribution of positive events in a particular bin + ε / Distribution of negative events in a particular bin + ε) (1)"
Eq. (1) defines each transformed static value as the log-odds of 'positive events' within its bin, and the paper never specifies that 'positive events' is anything other than the CAD/CHF label being predicted. Section 2.3 then clusters patients on these transformed static features and restricts every target patient's neighbors to its own cluster, and Section 2.9 outputs the majority neighbor label as the prediction. Thus cluster membership, hence the selected nearest neighbor and its label, is a function of the label used to compute aWOE. The statement that the CAD attribute is 'disregarded' when predicting CAD removes only the raw label column; the aWOE-transformed versions of age, weight, and other static fields still carry label information.
full rationale
The central derivation chain is: static features → aWOE/Z-score → clustering → cluster-restricted DTW neighbors → majority-label prediction. The aWOE step is the circular pivot: Eq. (1) defines transformed values from the distribution of 'positive events' and 'negative events'; with no other binary outcome defined anywhere in the paper, this is naturally read as the CAD/CHF label the system is supposed to predict. Clustering on these transformed features determines which patients can be neighbors, and the neighbor's label is the output, so the prediction loop closes through the label itself. The paper's claim that it 'disregards' the target attribute in clustering is insufficient, because the aWOE encoding of every static feature already embeds the target distribution. Other contributions are not circular: DTW similarity on time series is computed without target information, Z-score is unsupervised, and the Spark speedup is an engineering result. The self-citation to [43] for aWOE's privacy property is ancillary to the prediction claim and does not change the score. Because the strongest reported gains are tied to the aWOE-transformed static clustering, the headline improvement reduces in substantial part to the fitted label encoding; I assign 8 rather than 10 because Eq. (1)'s outcome variable is not explicitly named and the exact degree of leakage therefore depends on that unspecified choice.
Assumptions & free parameters
free parameters (6)
- Number of clusters K =
125 (CAD), 150 (CHF)
- aWOE binning parameter q =
unspecified
- aWOE adjustment constant epsilon =
0.0001
- aWOE unique-value threshold lambda =
100
- Number of nearest neighbors lambda =
1
- Observation window length =
12 hours
assumptions (4)
- domain assumption aWOE transformation can be computed without using the prediction target, so no label leakage occurs
- domain assumption Clustering on all patients before the 80/20 train/test split does not leak test information
- domain assumption DTW distance is an appropriate similarity measure for multivariate, unevenly sampled vital-sign time series
- domain assumption aWOE preserves privacy equivalently to k-anonymity
Cite this review
Pith. "Pith review of Patient Similarity Computation for Clinical Decision Support: An Efficient Use of Data Transformation, Combining Static and Time Series Data." pith.science (2026). https://pith.science/paper/VIMVNMKD
@misc{pith2026250607092,
  author       = {Pith},
  title        = {Pith review of: Patient Similarity Computation for Clinical Decision Support: An Efficient Use of Data Transformation, Combining Static and Time Series Data},
  year         = {2026},
  howpublished = {\url{https://pith.science/paper/VIMVNMKD}},
  note         = {Machine review of arXiv:2506.07092}
}
read the original abstract
Patient similarity computation (PSC) is a fundamental problem in healthcare informatics. The aim of the patient similarity computation is to measure the similarity among patients according to their historical clinical records, which helps to improve clinical decision support. This paper presents a novel distributed patient similarity computation (DPSC) technique based on data transformation (DT) methods, utilizing an effective combination of time series and static data. Time series data are sensor-collected patients' information, including metrics like heart rate, blood pressure, Oxygen saturation, respiration, etc. The static data are mainly patient background and demographic data, including age, weight, height, gender, etc. Static data has been used for clustering the patients. Before feeding the static data to the machine learning model adaptive Weight-of-Evidence (aWOE) and Z-score data transformation (DT) methods have been performed, which improve the prediction performances. In aWOE-based patient similarity models, sensitive patient information has been processed using aWOE which preserves the data privacy of the trained models. We used the Dynamic Time Warping (DTW) approach, which is robust and very popular, for time series similarity. However, DTW is not suitable for big data due to the significant computational run-time. To overcome this problem, distributed DTW computation is used in this study. For Coronary Artery Disease, our DT based approach boosts prediction performance by as much as 11.4%, 10.20%, and 12.6% in terms of AUC, accuracy, and F-measure, respectively. In the case of Congestive Heart Failure (CHF), our proposed method achieves performance enhancement up to 15.9%, 10.5%, and 21.9% for the same measures, respectively. The proposed method reduces the computation time by as high as 40%.
Figures


Figures from the paper (12 more)




Reference graph
Works this paper leans on
-
[1]
Patient similarity in prediction mod- els based on health data: A scoping review
Anis Sharafoddini, Joel A Dubin, J.L., 2017. Patient similarity in prediction mod- els based on health data: A scoping review. JMIR medical informatics 5. URL: https://pubmed.ncbi.nlm.nih.gov/28258046/, doi:https://doi.org/10.2196/medinform.6730
-
[3]
Ankerst, M., Breunig, M.M., Kriegel, H.P., Sander, J., 1999b. Optics: ordering points to identify the clustering structure, in: Proceedings of the 1999 ACM SIGMOD International Conference on Management of Data, Association for Computing Machinery, New York, NY, USA. p. 49–60. URL: https://doi.org/10.1145/304182.304187, doi:10.1145/304182.304187
arXiv 1999
-
[4]
Berndt, D.J., Clifford, J., 1994. Using dynamic time warping to find patterns in time series, in: In Pro- ceedings of the 3rd International Conference on Knowledge Discovery and Data Mining (AAAIWS’94), p. 359–370. doi:https://dl.acm.org/doi/10.5555/3000850.3000887
-
[5]
Cai, X., Perez-Concha, O., Coiera, E., Martin-Sanchez, F., Day, R., Roffe, D., Gal- lego, B., 2015. Real-time prediction of mortality, readmission, and length of stay us- ing electronic health record data. Journal of the American Medical Informatics Associa- tion 23, 553–561. URL:https://doi.org/10.1093/jamia/ocv110, doi:10.1093/jamia/ocv110, arXiv:https:...
-
[6]
Similarity Measures and Dimensionality Reduction Techniques for Time Series Data Mining
Cassisi, C., Montalto, P., Aliotta, M., Cannata, A., Pulvirenti, A., 2012. Similarity Measures and Dimensionality Reduction Techniques for Time Series Data Mining. doi:10.5772/49941
-
[7]
Chan, L., Chan, T., Cheng, L., Mak, W., 2010. Machine learning of patient similarity: A case study on predicting survival in cancer patient after locoregional chemotherapy, in: 2010 IEEE International Conference on Bioinformatics and Biomedicine Workshops (BIBMW), pp. 467–470. doi:10.1109/BIBMW.2010.5703846
-
[8]
Exploiting Convolutional Neural Network for Risk Prediction with Medical Feature Embedding
Che, Z., Cheng, Y., Sun, Z., Liu, Y., 2017. Exploiting convolutional neural network for risk prediction with medical feature embedding. ArXiv abs/1701.07474. 22
work page Pith review arXiv 2017
-
[9]
Analysis of microarray data using z-score trans- formation
Cheadle, C., Vawter, M., Freed, W., Becker, K., 2003. Analysis of microarray data using z-score trans- formation. The Journal of molecular diagnostics : JMD 5, 73–81. doi:10.1016/S1525-1578(10)60455-2
Show all 62 references
-
[10]
Risk Prediction with Elec- tronic Health Records: A Deep Learning Approach
Cheng, Y., Wang, F., Zhang, P., Hu, J., . Risk Prediction with Elec- tronic Health Records: A Deep Learning Approach. pp. 432–440. URL: https://epubs.siam.org/doi/abs/10.1137/1.9781611974348.49, doi:10.1137/1.9781611974348.49, arXiv:https://epubs.siam.org/doi/pdf/10.1137/1.978...
-
[11]
Introduction to Algorithms, Third Edition
Cormen, T.H., Leiserson, C.E., Rivest, R.L., Stein, C., 2009. Introduction to Algorithms, Third Edition. 3rd ed., The MIT Press
2009
-
[12]
A comparative analy- sis of data preparation algorithms for customer churn prediction: A case study in the telecommunication industry
Coussement, K., Lessmann, S., Verstraeten, G., 2017. A comparative analy- sis of data preparation algorithms for customer churn prediction: A case study in the telecommunication industry. Decision Support Systems 95, 27 – 36. URL:http://www.sciencedirect.com/science/article/pi...
2017 doi
-
[13]
Generating evidence based interpretation of hematology screens via anomaly charac- terization
David, G., 2011. Generating evidence based interpretation of hematology screens via anomaly charac- terization. The Open Clinical Chemistry Journal 4, 10–16. doi:10.2174/1874241601104010010
2011 doi
-
[14]
Statistical comparisons of classifiers over multiple data sets
Demˇ sar, J., 2006. Statistical comparisons of classifiers over multiple data sets. Journal of Machine Learning Research 7, 1–30
2006
-
[15]
Exact indexing of dynamic time warping
Eamonn Keogh, C.A.R., 2002. Exact indexing of dynamic time warping. In proceedings of the 26th Int’l Conference on Very Large Data Bases. Hong Kong , 406–417
2002
-
[16]
Tsiklidis, Talid Sinno, S.L.D., 2022
Evan J. Tsiklidis, Talid Sinno, S.L.D., 2022. Predicting risk for trauma patients us- ing static and dynamic information from the mimic iii database. PLoS ONE 17. URL:https://journals.plos.org/plosone/article?id=10.1371/journal.pone.0262523, doi:https://doi.org/10.1371/journal...
2022 doi
-
[17]
Fast subsequence matching in time-series databases
Faloutsos, C., Ranganathan, M., Manolopoulos, Y., 1994. Fast subsequence matching in time-series databases. ACM SIGMOD Record 23, 419 – 429. doi:https://doi.org/10.1145/191843.191925
1994
-
[18]
Intertemporal similarity of economic time series: An application of dynamic time warping
Franses, P.H., Wiemann, T., 2020. Intertemporal similarity of economic time series: An application of dynamic time warping. Computational Economics 56, 59–75. doi:https://doi.org/10.1007/s10614-020- 09986-0
2020 doi
-
[19]
Patient clustering with uncoded text in electronic medical records
Henao, R., Murray, J., Ginsburg, G., Carin, L., Lucas, J.E., 2013. Patient clustering with uncoded text in electronic medical records. AMIA ... Annual Symposium proceedings. AMIA Symposium 2013, 592–9
2013
-
[20]
Survey of clinical data mining applications on big data in health informatics, in: 2013 12th International Conference on Machine Learning and Applica- tions, pp
Herland, M., Khoshgoftaar, T.M., Wald, R., 2013. Survey of clinical data mining applications on big data in health informatics, in: 2013 12th International Conference on Machine Learning and Applica- tions, pp. 465–472. doi:10.1109/ICMLA.2013.163
2013 doi
-
[21]
Using participant similarity for the classification of epidemiological data on hepatic steatosis, IEEE
Hielscher, T., Spiliopoulou, M., Volzke, H., Kuhn, J.P., 2014. Using participant similarity for the classification of epidemiological data on hepatic steatosis, IEEE. pp. 1–7. doi:10.1109/CBMS.2014.28
2014 doi
-
[22]
Spectral clustering strategies for heterogeneous disease expression data
Huang, G.T., Cunningham, K.I., Benos, P.V., Chennubhotla, C.S., 2013. Spectral clustering strategies for heterogeneous disease expression data. Pacific Symposium on Biocomputing. Pacific Symposium on Biocomputing , 212–23
2013
-
[23]
Dtw-nn: A novel neural network for time se- ries recognition using dynamic alignment between inputs and weights
Iwana, B.K., Frinken, V., Uchida, S., 2020. Dtw-nn: A novel neural network for time se- ries recognition using dynamic alignment between inputs and weights. Knowledge-Based Systems 188, 104971. URL:https://www.sciencedirect.com/science/article/pii/S0950705119303995, doi:https:...
2020
-
[24]
A patient-similarity-based model for diagnostic prediction
Jia, Z., Zeng, X., Duan, H., Lu, X., Li, H., 2020. A patient-similarity-based model for diagnostic prediction. International Journal of Medical Informatics 135, 104073. URL:https://www.sciencedirect.com/science/article/pii/S1386505619310925, doi:https://doi.org/10.1016/j.ijmed...
2020
-
[25]
A novel customer churn prediction model for the telecommunication industry us- ing data transformation methods and feature selection
Joydeb Kumar Sana, Mohammad Zoynul Abedin, M.S.R., Rahman, M.S., 2022. A novel customer churn prediction model for the telecommunication industry us- ing data transformation methods and feature selection. PLoS ONE 17. URL: https://journals.plos.org/plosone/article?id=10.1371/j...
2022 doi
-
[26]
An efficient k- means clustering algorithm: analysis and implementation
Kanungo, T., Mount, D., Netanyahu, N., Piatko, C., Silverman, R., Wu, A., 2002. An efficient k- means clustering algorithm: analysis and implementation. IEEE Transactions on Pattern Analysis and Machine Intelligence 24, 881–892. doi:10.1109/TPAMI.2002.1017616
2002 arXiv
-
[27]
Integrated optimisation method for personalised modelling and case studies for medical decision support
Kasabov, N.K., Hu, Y., 2010. Integrated optimisation method for personalised modelling and case studies for medical decision support. Int. J. Funct. Informatics Pers. Medicine 3, 236–256
2010
-
[28]
Exact indexing of dynamic time warping, in: Proceedings of the 28th International Conference on Very Large Data Bases, VLDB Endowment
Keogh, E., 2002. Exact indexing of dynamic time warping, in: Proceedings of the 28th International Conference on Very Large Data Bases, VLDB Endowment. p. 406–417
2002
-
[29]
A fast and accurate similarity measure for long time series classification based on local extrema and dynamic time warping
Lahreche, A., Boucheham, B., 2021. A fast and accurate similarity measure for long time series classification based on local extrema and dynamic time warping. Expert Systems with Applications 168, 114374. URL:https://www.sciencedirect.com/science/article/pii/S0957417420310514,...
2021
-
[30]
Medical time series classification with hierarchical attention-based temporal convolutional networks: A case study of myotonic dystrophy diagnosis
Lin, L., Xu, B., Wu, W., Richardson, T.W., Bernal, E.A., 2019. Medical time series classification with hierarchical attention-based temporal convolutional networks: A case study of myotonic dystrophy diagnosis. ArXiv abs/1903.11748. URL:https://api.semanticscholar.org/CorpusID...
2019 arXiv
-
[31]
A ¡i¿k¡/i¿ -nearest neighbors survival probability prediction method
Lowsky, D., Ding, Y., Lee, D., McCulloch, C., Ross, L., Thistlethwaite, J., Zenios, S., 2013. A ¡i¿k¡/i¿ -nearest neighbors survival probability prediction method. Statistics in Medicine 32, 2062–
2013
-
[32]
Integrate multi-omic data using affinity network fusion (anf) for cancer patient clustering, in: 2017 IEEE International Conference on Bioinformatics and Biomedicine (BIBM), pp
Ma, T., Zhang, A., 2017. Integrate multi-omic data using affinity network fusion (anf) for cancer patient clustering, in: 2017 IEEE International Conference on Bioinformatics and Biomedicine (BIBM), pp. 398–403. doi:10.1109/BIBM.2017.8217682
2017
-
[33]
An integrated data mining approach to real-time clinical monitoring and deterioration warning, pp
Mao, Y., Chen, W., Chen, Y., Lu, C., Kollef, M., Bailey, T.C., . An integrated data mining approach to real-time clinical monitoring and deterioration warning, pp. 1140–1148. doi:10.1145/2339530.2339709
-
[34]
Effective patient similarity computa- tion for clinical decision support using time series and static data, pp
Masud, M., Hayawi, K., Mathew, S., Dirir, A., Cheratta, M., 2020. Effective patient similarity computa- tion for clinical decision support using time series and static data, pp. 1–8. doi:10.1145/3373017.3373050
2020
-
[35]
Personalized predictive modeling and risk factor identification using patient similarity
Ng, K., Sun, J., Hu, J., Wang, F., 2015. Personalized predictive modeling and risk factor identification using patient similarity. AMIA Summits on Translational Science Proceedings 2015, 132 – 136
2015
-
[36]
Patient similarity networks for preci- sion medicine
Pai, S., Bader, G.D., 2018. Patient similarity networks for preci- sion medicine. Journal of Molecular Biology 430, 2924–2938. URL: https://www.sciencedirect.com/science/article/pii/S0022283618305321, doi:https://doi.org/10.1016/j.jmb.2018.05.037. theory and Application of Net...
2018 doi
-
[37]
Patient similarity for precision medicine: A systematic review
Parimbelli, E., Marini, S., Sacchi, L., Bellazzi, R., 2018. Patient similarity for precision medicine: A systematic review. Journal of Biomedical Informatics 83. doi:10.1016/j.jbi.2018.06.001
2018 doi
-
[38]
New knowledge extraction technique using prob- ability for case-based reasoning: application to medical diagnosis
Park, Y.J., Kim, B.C., Chun, S.H., 2006. New knowledge extraction technique using prob- ability for case-based reasoning: application to medical diagnosis. Expert Systems 23, 2–
2006
-
[39]
Physionet-MIMICIII
Physionet, . Physionet-MIMICIII. [n.d.].https://archive.physionet.org/physiobank/database/mimic3cdb/. Accessed: November 22, 2021
2021
-
[40]
URL:https://onlinelibrary.wiley.com/doi/abs/10.1111/j.1468-0394.2006.00321.x, doi:https://doi.org/10.1111/j.1468-0394.2006.00321.x,arXiv:https://onlinelibrary.wiley.com/doi/pdf/10.1111/j.1468-0394.2006.00321.x
2006
-
[41]
netdx: interpretable patient classification using integrated patient similarity networks
S, P., S, H., R, I., MA, S., H, K., GD., B., 2019. netdx: interpretable patient classification using integrated patient similarity networks. Mol Syst Biol. 15, 406–417. doi:doi:10.15252/msb.20188497. 24
2019 doi
-
[42]
Benchmarking deep learn- ing models on large healthcare datasets
Purushotham, S., Meng, C., Che, Z., Liu, Y., 2018. Benchmarking deep learn- ing models on large healthcare datasets. Journal of Biomedical Informatics 83, 112–
2018
-
[43]
Privacy-preserving customer churn prediction model in the context of telecommunication industry
Sana, J.K., Rahman, M.S., Rahman, M.S., 2024. Privacy-preserving customer churn prediction model in the context of telecommunication industry. URL:https://arxiv.org/abs/2411.01447, arXiv:2411.01447
2024 arXiv
-
[44]
Modeling online customer purchase intention behavior applying dif- ferent feature engineering and classification techniques
Satu, M.S., Islam, S.F., 2023. Modeling online customer purchase intention behavior applying dif- ferent feature engineering and classification techniques. Discover Artificial Intelligence 3. URL: https://doi.org/10.1007/s44163-023-00086-0, doi:10.1007/s44163-023-00086-0
2023 doi
-
[45]
Toward accurate dynamic time warping in linear time and space
Salvador, S., Chan, P., 2007. Toward accurate dynamic time warping in linear time and space. Intell. Data Anal. 11, 561–580
2007
-
[46]
Spark.https://spark.apache.org/
Spark, a. Spark.https://spark.apache.org/. Accessed on 15.11.2021
2021
-
[47]
Spark.https://www.infoworld.com/article/3236869/what-is-apache-spark-the-big-data-platform-that-crushed-hadoop.html
Spark, b. Spark.https://www.infoworld.com/article/3236869/what-is-apache-spark-the-big-data-platform-that-crushed-hadoop.html. Accessed on 15.11.2021
2021
-
[48]
Clustering patients ac- cording to health perceptions: Relationships to psychosocial characteristics and medication nonadherence
Sewitch, M.J., Leffondr´ e, K., Dobkin, P.L., 2004. Clustering patients ac- cording to health perceptions: Relationships to psychosocial characteristics and medication nonadherence. Journal of Psychosomatic Research 56, 323–332. URL:https://www.sciencedirect.com/science/articl...
2004 doi
-
[49]
Deep patient similarity learning for personalized healthcare
Suo, Q., Ma, F., Yuan, Y., Huai, M., Zhong, W., Gao, J., Zhang, A., 2018. Deep patient similarity learning for personalized healthcare. IEEE Transactions on NanoBioscience PP, 1–1. doi:10.1109/TNB.2018.2837622
2018
-
[50]
Attention is all you need, in: Proceedings of the 31st International Conference on Neural Information Processing Systems, Curran Associates Inc., Red Hook, NY, USA
Vaswani, A., Shazeer, N., Parmar, N., Uszkoreit, J., Jones, L., Gomez, A.N., Kaiser, L., Polosukhin, I., 2017. Attention is all you need, in: Proceedings of the 31st International Conference on Neural Information Processing Systems, Curran Associates Inc., Red Hook, NY, USA. p...
2017
-
[51]
A system for mining temporal physiological data streams for advanced prognostic decision support, IEEE
Sun, J., Sow, D., Hu, J., Ebadollahi, S., 2010. A system for mining temporal physiological data streams for advanced prognostic decision support, IEEE. pp. 1061–1066. doi:10.1109/ICDM.2010.102
2010 doi
-
[52]
Wang, B., Mezlini, A., Demir, F., Fiume, M., Tu, Z., Brudno, M., Haibe-Kains, B., Goldenberg, A.,
-
[53]
Wang, F., Hu, J., Sun, J., 2012a. Medical prognosis based on patient similarity and expert feedback, in: 2012 21st International Conference on Pattern Recognition (ICPR 2012), IEEE Computer Society, Los Alamitos, CA, USA. pp. 1799–1802. URL:https://doi.ieeecomputersociety.org/
2012
-
[54]
Comparing and combining time series trajectories using dynamic time warping
Vaughan, N., Gabrys, B., 2016. Comparing and combining time series trajectories using dynamic time warping. Procedia Computer Science 96, 465–474. doi:10.1016/j.procs.2016.08.106
2016 doi
-
[55]
Integrating distance metrics learned from mul- tiple experts and its application in inter-patient similarity assessment, in: SDM
Wang, F., Sun, J., Ebadollahi, S., 2011. Integrating distance metrics learned from mul- tiple experts and its application in inter-patient similarity assessment, in: SDM. URL: https://api.semanticscholar.org/CorpusID:18546025
2011
-
[56]
Multiclass spectral clustering, in: Proceedings Ninth IEEE International Conference on Computer Vision, pp
Yu, Shi, 2003. Multiclass spectral clustering, in: Proceedings Ninth IEEE International Conference on Computer Vision, pp. 313–319 vol.1. doi:10.1109/ICCV.2003.1238361
2003 arXiv
-
[57]
Hierarchical Agglomerative Clustering
Zepeda-Mendoza, M.L., Resendis-Antonio, O., 2013. Hierarchical Agglomerative Clustering. Springer New York, New York, NY
2013
-
[58]
Medical prognosis based on patient similarity and expert feedback, in: Proceedings of the 21st International Conference on Pattern Recognition (ICPR2012), pp
Wang, F., Hu, J., Sun, J., 2012b. Medical prognosis based on patient similarity and expert feedback, in: Proceedings of the 21st International Conference on Pattern Recognition (ICPR2012), pp. 1799–1802
-
[60]
Measuring patient similarities via a deep architecture with medical concept embedding, in: 2016 IEEE 16th International Conference on Data Mining (ICDM), pp
Zhu, Z., Yin, C., Qian, B., Cheng, Y., Wei, J., Wang, F., 2016b. Measuring patient similarities via a deep architecture with medical concept embedding, in: 2016 IEEE 16th International Conference on Data Mining (ICDM), pp. 749–758. doi:10.1109/ICDM.2016.0086. 25
2016
-
[62]
A novel patient similarity prediction model based on semisupervised learning, in: CAIBDA 2022: 2nd International Conference on Artificial Intelligence, Big Data and Algorithms, pp
Zhang, L., Li, X., Bi, X., Zhang, Y., Yu, G., Zhao, K., 2022. A novel patient similarity prediction model based on semisupervised learning, in: CAIBDA 2022: 2nd International Conference on Artificial Intelligence, Big Data and Algorithms, pp. 1–9
2022
-
[134]
URL:https://www.sciencedirect.com/science/article/pii/S1532046418300716, doi:https://doi.org/10.1016/j.jbi.2018.04.007
2018 doi
-
[2014]
Nature methods 11
Similarity network fusion for aggregating data types on a genomic scale. Nature methods 11. doi:10.1038/nmeth.2810
-
[2069]
doi:10.1002/sim.5673
Reviewed August 7, 2026 · model on record in the stance chip above.
Discussion (0). Continue with ORCID to comment.