REVIEW 4 major objections 7 minor 7 references
From Limited Data to Rare-event Prediction: LLM-powered Feature Engineering and Multi-model Learning in Venture Capital
T0 review · 4 major / 7 minor · reviewed 2026-08-04 · deepseek-v4-flash
Pith's one-line read LLM-powered feature engineering plus a stacked ensemble predicts which startups reach a $500M valuation, with 9.8–11.1x random-baseline precision and recall above 30%.
desk verdict A promising pipeline and a clean ablation, but the 10X precision claim is not established because the threshold is tuned on the test set and no leakage control is described. read the letter →
The pith
A machine-rendered reading of the paper's core claim, the machinery that carries it, and where it could break.
The reading
What carries the argument
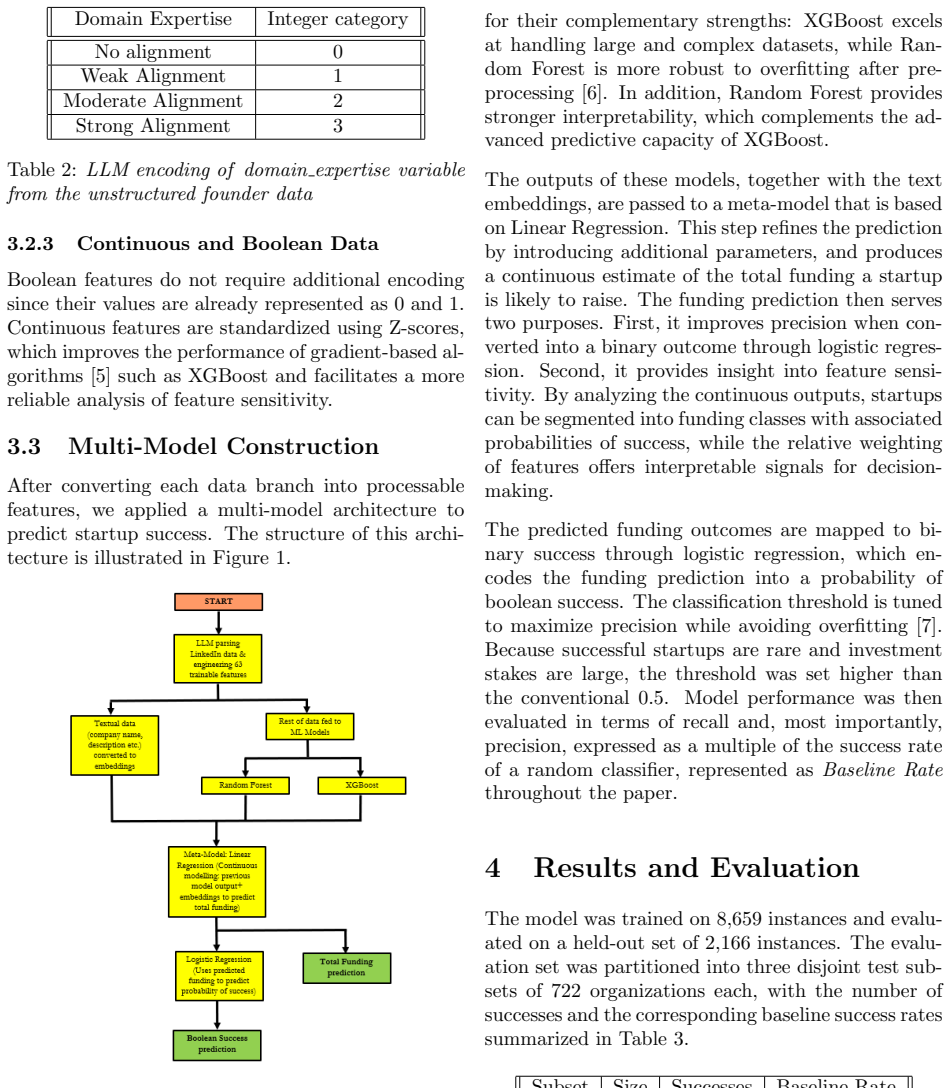
The load-bearing mechanism is LLM-powered feature engineering: a large language model extracts and synthesizes signals from unstructured founder profiles into 63 trainable features, organized as categorical (education level, domain expertise), textual (startup-description embeddings), continuous (standardized with Z-scores), and boolean types. These feed a layered ensemble—XGBoost and Random Forest in the first layer, a Linear Regression meta-model in the second—that produces a continuous total-funding estimate. That funding estimate is the intermediate object that carries information from features to labels; logistic regression then thresholds the estimate into a binary success prediction.
What would settle it
A decisive check: re-run the pipeline on a temporally split dataset in which founder profiles and company descriptions are truncated before the funding and exit events that define the labels, so the LLM cannot see outcome information during feature construction. If held-out precision drops from ~10x toward the ~4.6x ablation level, the central claim fails. A simpler observational check is to search the generated features and text embeddings for strings that memorize exact funding round sizes or exit values, which would indicate direct label leakage.
Extended reading notes
Core claim
On its own terms, the paper establishes that a two-layer multi-model architecture can turn large language model features into rare-event predictions with precision an order of magnitude above chance. Success is defined by a valuation above $500 million, an acquisition above $500 million, or funding above $500 million; companies that raised only $100K–$4M are labeled unsuccessful. The first layer combines XGBoost and Random Forest with text embeddings, and the second layer is a Linear Regression meta-model that outputs a continuous estimate of total funding. That funding prediction is mapped to binary success by logistic regression with a threshold of 0.8, chosen at fixed intervals to avoid o
Load-bearing premise
The model's 10x precision and under-4% funding error depend on the LLM having built its 63 features without ever seeing the funding amounts or exit outcomes that later define the labels; the paper provides no temporal cutoff or variable blackout to guarantee this.
Editorial extensions
If this is right
- If the 10X precision holds, early-stage investors can cut a large startup funnel to a shortlist where roughly one in ten flagged companies reaches a $500M+ outcome, with coverage above 30%.
- The ablation shows LLM features are load-bearing: removing them drops precision from 10.4X to 4.6X, so the claimed capability is specifically about semantic feature engineering, not ensemble stacking alone.
- Because the threshold is fixed at 0.8 across subsets, the result implies stable precision across different base success rates (6.8%–9.3%) rather than a single lucky split.
- The funding-class calibration—1.27% success probability for the $100K–$1M predicted class, 100% for the $1B+ class—offers a graded risk scale, not just a binary flag, if the funding model generalizes.
Reading between the lines
- If a temporal blackout validation succeeds, the same LLM-feature-plus-ensemble recipe could transfer to other rare-event domains where unstructured text leads, such as equipment failure from maintenance notes or disease onset from clinical narratives.
- The reported 3–4% funding MAPE is low enough to warrant a targeted test: masking all funding amounts and exit news during LLM feature construction and checking whether precision collapses would settle whether the result is foresight or leakage.
- The feature-importance ranking suggests a data-collection rule the paper leaves implicit: investors gain more from accurate category tagging and founder-count data than from richer educational detail, so those fields deserve the most cleaning effort.
- The success-class definition itself biases toward cohorts with public funding and exit records; applying the pipeline to geographies or stages with thinner public data would likely compress the precision multiple.
Editorial analysis
A structured set of objections, weighed in public.
Referee Report
Summary. The paper proposes a pipeline for rare-event prediction in venture capital: LLM-powered feature engineering converts unstructured founder profiles into 63 features, and a multi-model ensemble (XGBoost, Random Forest, and a Linear Regression meta-model) first predicts total funding, which is then thresholded by logistic regression to predict binary startup success. Evaluated on 10,825 founders (8.5% success rate, held-out 2,166 split into three 722-company subsets), the paper reports funding MAPE below 4% and precision of 9.8x–11.1x over the random-classifier baseline with recall above 30%. Ablation studies suggest that LLM-derived features, embeddings, and the ensemble structure contribute to performance. The central claim is that LLM-powered feature engineering plus this multi-model architecture yields precision roughly an order of magnitude above the baseline in held-out subsets.
Significance. If the claims are valid, the paper would demonstrate a valuable use of LLM feature engineering for rare-event prediction, with practical relevance for early-stage investing and a useful emphasis on interpretability via feature sensitivity. Strengths include explicit ablations (LLM vs. traditional features, embedding sources, component removal, feature-type removal), reporting precision relative to the random baseline, and attempting to show robustness across three subsets. However, the central empirical claim is currently not supported because the evaluation protocol lacks a leakage control and the classification threshold is selected on the test data. The framework itself is interesting, but the paper needs substantial methodological revision before its headline precision figure can be accepted.
major comments (4)
- [Section 3.1/3.2/5.1] The paper never states a temporal cutoff or variable blackout for the 10,825 founder profiles. The success label in Section 3.1 is defined by raising, valuation, or acquisition above $500M, and the LLM-derived features in Section 3.2 are built from textual profiles that may include current funding, valuation, IPO, or acquisition information. If any of this outcome information reaches the features or embeddings, the reported <4% funding MAPE and 9.8x–11.1x precision are near-tautological. Please provide: (i) the collection date of the publicly available profiles; (ii) a demonstration that the 63 features and text embeddings were constructed without access to funding amounts, valuations, or exit outcomes; and (iii) an out-of-time validation split, e.g., train on companies founded before a cutoff and test on companies founded after, plus a leakage test such as training with shuffled labels
- [Section 4.2, Figure 2, Table 5] The classification threshold of 0.8 is selected by inspecting the precision curve in Figure 2, which is computed on the evaluation/test subsets. This constitutes test-set tuning: the precision values in Table 5 are measured at a threshold chosen on the same data, and are therefore optimistic. The statement that thresholds were tested at fixed intervals to reduce overfitting does not address the fact that the test set is used for model selection. Use a validation split or cross-validation for threshold selection, and report test performance for a pre-specified threshold or across the full threshold range. Also report absolute precision and the number of predicted positives for each subset, rather than only multiples of the baseline rate.
- [Section 4.1, Table 4] A funding MAPE below 4% for early-stage startups is implausibly low and, in the absence of any leakage control, is itself evidence that outcome information may have reached the feature set. The paper provides no analysis of which features correlate with funding outcomes, nor a validation on companies outside the training period. Because the funding prediction is the intermediate target for success classification, this point is load-bearing. Please add an explicit leakage audit and an out-of-time funding-prediction experiment. If the low MAPE is genuine, explain the mechanism by which the features can predict funding so precisely.
- [Section 3.3, Table 6] Table 6 reports probabilities of success by predicted funding class, but these probabilities are generated by the logistic regression applied to the model's own continuous funding predictions. This table therefore reflects calibration of the model's output, not external validation of predictive power. The monotonic increase in success probability across funding classes is expected by construction. Please label the table accordingly and avoid presenting it as independent evidence of model quality.
minor comments (7)
- [Section 3.1] The sentence 'Companies that raised between $100K and $4M are categorized as unsuccessful' is ambiguous: does the unsuccessful class include all companies that did not meet the success threshold, or only those in the $100K–$4M range? Please clarify the labeling of companies that raised <$100K or between $4M and $500M.
- [Section 3.2.2] Typo: 'T extual Data' should be 'Textual Data'.
- [Section 3.2 / Section 5.1] Section 5.1 says 'all 63 features are LLM-derived', but Section 3.2.1 includes deterministic mappings such as education level. Clarify which features are LLM-derived and which are standard structured features.
- [References] In Section 3.2.1, the citation is given as 'Xiong and Ihlamur (2024) [2]', but the reference list shows [2] as 'Xiong, S., & Ihlamur, Y. (2023)'. Please correct the year.
- [Figure 2] Figure 2 is mentioned but not shown in the text. Ensure the figure includes the precision curve with axis labels and threshold values so that the 'stable interval' claim can be checked.
- [Section 4.4.3, Table 9] Table 9 reports only deltas in precision and recall (e.g., XGBoost -3.2X, -7%). Please provide the absolute precision and recall for the full model and for each ablation so that the reader can assess the impact without ambiguity.
- [Section 4] The train/test split is described only by counts (8,659 / 2,166). Please state whether the split is random, stratified by success label, or temporal. This is especially important given the leakage concerns.
Circularity Check
No central circularity: the success classifier is a thresholded funding regression, which is a legitimate surrogate for a label defined by a funding threshold. Minor test-set threshold selection adds optimism but does not make the derivation tautological.
-
fitted input called prediction
[Section 4.2, Figure 2 and Table 5]
"Rather than fine-tuning, thresholds were tested at fixed intervals to reduce the risk of overfitting. The resulting precision curve is presented in Figure 2. ... Because model performance within this interval is stable, we selected 0.8 as a representative threshold to avoid overfitting to a specific dataset."
The classification threshold (0.8) is chosen by inspecting the precision curve computed on the held-out test set, and the same test set is then used to report the precision multiples in Table 5. The reported 'prediction' is therefore conditional on a parameter fitted to the test data; the precision is not an out-of-sample evaluation, and any optimism in the threshold choice is built into the headline 9.8X-11.1X numbers. This is not a full by-construction reduction, but it means the test result is partly a fit rather than a pure prediction.
full rationale
The paper's central derivation is not circular by construction. Success is defined (Section 3.1) as a threshold on funding/valuation/acquisition, and the first-stage model predicts total funding (Section 3.3); the final binary prediction is a logistic threshold on that predicted funding. This is a standard surrogate approach: the label is a function of actual funding, and the predictor is a function of predicted funding learned from founder-profile features. There is no equation-level identity unless funding information reaches the feature set, which the paper does not explicitly rule out. That absence is a validation gap (potential leakage), not a demonstrated circular step, so it is not scored as one. The self-citations to prior work by the same authors (e.g., 'following the approach of Ozince and Ihlamur (2024) [4]') are used for feature-engineering conventions, but the paper's own ablations (Tables 7-10) provide some independent support for the value of those features. The threshold-selection-on-test issue is the only concrete mechanism that makes a reported number partially in-sample, and it is minor relative to the overall architecture. Hence a low circularity score.
Assumptions & free parameters
free parameters (3)
- classification threshold =
0.8
- LLM feature-encoding scheme (63 features)
- Meta-model and logistic-regression weights
assumptions (5)
- domain assumption Success is a threshold on funding: companies raising, valued, or acquired above $500M are successful; companies raising $100K to $4M are unsuccessful (Section 3.1).
- ad hoc to paper Features do not contain the outcome: no leakage between the LLM-engineered features and the funding or label data.
- domain assumption LLM feature extraction is accurate and faithful to founder profiles (Section 3.2).
- standard math Standard ML assumptions hold for the ensemble (Sections 3.3 and 4.2).
- domain assumption Text embeddings of startup descriptions carry predictive signal independent of the tabular features (Section 3.2.2).
Cite this review
Pith. "Pith review of From Limited Data to Rare-event Prediction: LLM-powered Feature Engineering and Multi-model Learning in Venture Capital." pith.science (2026). https://pith.science/paper/WCDROMIX
@misc{pith2026250908140,
  author       = {Pith},
  title        = {Pith review of: From Limited Data to Rare-event Prediction: LLM-powered Feature Engineering and Multi-model Learning in Venture Capital},
  year         = {2026},
  howpublished = {\url{https://pith.science/paper/WCDROMIX}},
  note         = {Machine review of arXiv:2509.08140}
}
read the original abstract
This paper presents a framework for predicting rare, high-impact outcomes by integrating large language models (LLMs) with a multi-model machine learning (ML) architecture. The approach combines the predictive strength of black-box models with the interpretability required for reliable decision-making. We use LLM-powered feature engineering to extract and synthesize complex signals from unstructured data, which are then processed within a layered ensemble of models including XGBoost, Random Forest, and Linear Regression. The ensemble first produces a continuous estimate of success likelihood, which is then thresholded to produce a binary rare-event prediction. We apply this framework to the domain of Venture Capital (VC), where investors must evaluate startups with limited and noisy early-stage data. The empirical results show strong performance: the model achieves precision between 9.8X and 11.1X the random classifier baseline in three independent test subsets. Feature sensitivity analysis further reveals interpretable success drivers: the startup's category list accounts for 15.6% of predictive influence, followed by the number of founders, while education level and domain expertise contribute smaller yet consistent effects.
Figures


Reference graph
Works this paper leans on
-
[1]
Griffin, B., Ternasky, J., Alican, F., & Ihlamur, Y. (2025, May 30). Random Rule Forest (RRF): Interpretable ensembles of LLM-Generated Ques- tions for Predicting Startup Success.arXiv. https://arxiv.org/abs/2505.24622
arXiv 2025
-
[2]
Xiong, S., & Ihlamur, Y. (2023). Founder- GPT: Self-play to evaluate the founder-idea fit.arXiv.https://doi.org/10.48550/arXiv. 2312.12037
work page Pith review arXiv doi:10.48550/arxiv.2312.12037 2023
-
[3]
Xiong, S., Ihlamur, Y., Alican, F., & Yin, A. O. (2024). GPTree: Towards explainable decision- making via LLM-powered decision trees.arXiv preprint arXiv:2411.08257
arXiv 2024
-
[4]
Ozince, E., & Ihlamur, Y. (2024). Automating Venture Capital: Founder assessment using LLM- powered segmentation, feature engineering and automated labeling techniques.arXiv preprint arXiv:2407.04885
work page Pith review arXiv 2024
-
[5]
Yun, J., & Kim, H. (2024). ZNorm: Z-score gradi- ent normalization for deep neural networks.arXiv preprint arXiv:2408.01215
work page Pith review arXiv 2024
-
[6]
Gupta, A. (2021, April 26). XGBoost versus Random Forest.Geek Culture. https://medium.com/geekculture/ xgboost-versus-random-forest-898e42870f30
work page 2021
- [7]
Reviewed August 4, 2026 · model on record in the stance chip above.
Discussion (0). Continue with ORCID to comment.