REVIEW 4 major objections 5 minor 30 references
Microflow: Microarchitectural Causal Observability for Deep Cross-Layer Analysis and Optimization
T0 review · 4 major / 5 minor · reviewed 2026-08-02 · deepseek-v4-flash
Pith's one-line read Microflow turns simulator event traces into a queryable causal graph, making stalls traceable to their true root causes across software and hardware layers.
desk verdict A real observability contribution for simulator analysis with two new empirical findings, but the headline numbers need softer language and an artifact. read the letter →
The pith
A machine-rendered reading of the paper's core claim, the machinery that carries it, and where it could break.
The reading
What carries the argument
The Microflow Intermediate Representation (MFIR) is the load-bearing object: a heterogeneous typed graph with vertices for microarchitectural events, instruction lifecycles, shared hardware resources such as cache lines, MSHR entries, and queue slots, and software semantics, with edges encoding ordering, spawning, resource acquisition and release, speculation invalidation, and semantic attribution. It is produced by Microtracer, an instrumentation layer that resolves flow and resource identifiers at capture time through declarative correlation rules and shadow registries, so the trace itself embeds causal links rather than requiring post-hoc inference. A trace compiler lifts the trace into M
What would settle it
Take a simulator with a known injected stall, such as a single load whose miss is caused by a deliberately placed eviction or a branch mispredict whose wrong-path flood is counted, and check whether Microflow's critical-path traversal names exactly that evictor or branch with no false positives; alternatively, replay the same execution after removing the suspected cause and verify the predicted IPC delta matches the full rerun. Any run where the causal path omits the injected cause, or where the counterfactual delta disagrees with the replay, falsifies the completeness claim.
Extended reading notes
Core claim
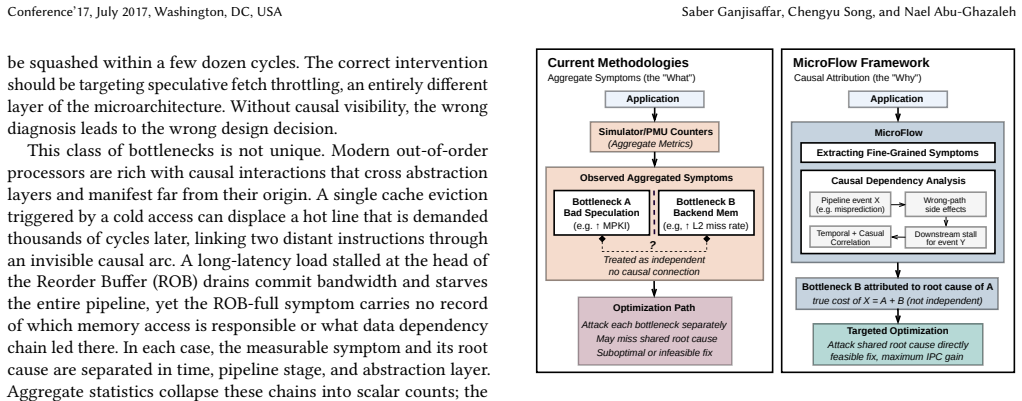
The central discovery is that causality can be made a first-class object of architectural simulation. Microflow assigns every dynamic entity a flow identifier and every shared structure a resource identifier at the moment of event capture, so cause-effect links are recorded rather than inferred. The compiled Microflow Intermediate Representation materializes typed edges for ordering within a flow, parent-child spawning of memory transactions, shared-resource contention, speculation invalidation, and software-to-hardware attribution, defining a simulation happens-before relation over events. On this graph, stall attribution becomes graph traversal: a symptom-conditioned critical-path walk kee
Load-bearing premise
The correctness of every attribution rests on the hand-written correlation rules and shadow registries at instrumentation sites: any causal interaction not captured by a rule, such as an indirect prefetch effect, an unmapped structure, or a missed wrong-path edge, is silently absent from the graph, and all downstream root-cause claims inherit that omission.
Editorial extensions
If this is right
- A simulator user can, from a single stall symptom, obtain the precise temporal window, the binding instruction or packet, and the physical resource that delayed it, without custom analysis scripts.
- Per-instruction cycle stacks and top-down slot classifications become exact projections of the lifecycle table, not statistical estimates, including wrong-path and speculative work that hardware counters cannot see.
- Counterfactual analysis on the causal graph yields mechanism-level IPC projections for specific interventions such as wrong-path fetch throttling, return-address-stack checkpointing, and branchless rewriting, not just an upper bound from perfect prediction.
- Cross-layer joins expose interactions that single-layer dependence graphs cannot express, such as wrong-path MSHR tenancy coupling bad-speculation and backend-bound buckets.
- Because MFIR is designed to be simulator-independent, the same representation can port to other CPU, GPU, or memory-system simulators with new correlation domain packages.
Reading between the lines
- A natural extension is to treat the correlation-rule set as a hypothesis about the modeled machine; systematic mutation testing that injects known eviction or misprediction causes and checks whether MFIR attributes them would provide the coverage validation the paper does not yet supply.
- The happens-before relation over typed edges could serve as the dependency backbone for automated design-space exploration, where an agent proposes a change, replays, and reads the causal diff between two MFIRs to explain why IPC moved.
- The same causal graph could be lifted into a performance contract for hardware-software co-design: compiler passes could query MFIR to prove that a transformation removes a specific critical-path edge rather than relying on aggregate cycle counts.
- If the correlation rules are shared as a community schema, MFIR becomes an interchange format for performance debugging, letting architects exchange not just traces but causally annotated explanations.
Editorial analysis
A structured set of objections, weighed in public.
Referee Report
Summary. The paper proposes Microflow, an observability framework for pre-silicon simulators. Microtracer annotates simulator events with flow and resource IDs at capture time; a trace compiler builds MFIR, a typed graph over microarchitectural events, hardware resources, and software semantics; an SQL-based analysis engine supports modules such as exact TMA, per-instruction lifecycles, and Causal Graph Traversal. The framework is demonstrated on two SPEC CPU 2017 benchmarks: in mcf it attributes an 1829-cycle ROB drain to cross-loop-iteration DRAM/queue contention; in leela it decomposes misprediction damage into three mechanisms and projects up to +21% IPC from targeted fixes. The abstract and contributions claim precise, exact, counterfactual causal attribution.
Significance. If the causal-completeness assumption holds, Microflow is a valuable substrate: it turns raw trace logs into a queryable causal graph, subsumes TMA and PICS at exact granularity, and is demonstrated on two simulators. The design of capture-time correlation via shadow registries is clean; the overhead characterization and portability experiments are useful. The measured +2.4% IPC from a software fix is a good sanity check. However, the headline 'exact'/'precise' claims rest on an unvalidated completeness assumption for hand-authored correlation rules, and the central reattribution/percentage projections rely on a proximity threshold and correlational regressions rather than on the causal graph itself. These concerns are addressable but require additional evidence or a substantial softening of claims.
major comments (4)
- [§2.1.2–2.1.3, §2.2] The central claim that MFIR 'precisely attributes stalls to their originating events' and enables 'exact critical-path decomposition' assumes that the hand-authored correlation rules capture every causally relevant interaction. If a rule misses an edge (e.g., prefetch-induced eviction, bank-group conflicts, load-store replay), every downstream traversal and attribution inherits the omission. The manuscript provides no coverage validation against an independent ground-truth dependency model, no enumeration of which simulator dependencies are and are not covered, and no artifact. Please add a validation: e.g., exhaustively audit one small window against simulator-internal dependency tracking, or demonstrate the effect of omitting/adding edge classes.
- [§4.2.3] The 29% reattribution is based on a 50-cycle squash-proximity threshold and an expected 35.5-cycle gap under independence. This is a temporal-proximity heuristic, not an MFIR edge traversal; it is the same kind of heuristic the paper criticizes in §1. Moreover, no sensitivity analysis on the 50-cycle choice or the independence model is given. Please either replace this with a causal-edge-based reattribution or provide a sensitivity sweep and justify the threshold.
- [§4.2.2–4.2.3] The claims that WP IQ occupancy 'causes' CP dispatch delay (r=0.964) and that WP IQ occupancy linearly degrades IPC (r=−0.919) are correlational. Potential confounders such as time since the last squash, branch density, or memory pressure are not controlled. The +13–22% and +21% IPC projections are extrapolations from this regression using an assumed 15–40% WP reduction. Provide a counterfactual experiment (e.g., replay with WP instructions artificially removed or IQ capacity increased) to validate the causal interpretation, and report held-out prediction error.
- [§4.2.4, Table 3] The +15% RAS-cascade projection uses a net saving of 16.5−8.2 cycles per eliminated squash, but 16.5 is never defined. The +21% projection assumes a constant per-WP-entry cost across the three categories, while the regression was run on aggregate windows. Please define all quantities and justify the additive composition, or re-run per-category regressions.
minor comments (5)
- [Table 3, §4.2.4] Table 3's 'Hardware (Fix 1)' / 'Microarch (Fix 2)' labels are swapped relative to the text: RAS cascade victims should be Fix 2 (RAS checkpointing), and algorithmic early-exit loops should be Fix 1 (WP fetch throttling).
- [Table 2] The 'Pipeline productive fraction 77%' row is never defined in the text; add a definition or remove it.
- [Abstract/§1] The abstract claims 'exact critical-path decomposition through counterfactual analysis,' but no counterfactual replay is described; the projections are regression-based. Consider rephrasing to 'causal-graph-based analysis' or add a true counterfactual study.
- [§5] The experiments report a single simulation per benchmark; given the deterministic simulators that is acceptable, but if any randomness is involved, report variance.
- [Fig. 8] The middle snapshots of IQ occupancy are hard to parse; labels such as 'CP (old) 16 Freed by Squash (48 slots)' are confusing. Consider a table or clearer timing diagram.
Circularity Check
Case-study 'true cost' and IPC projections reduce to definitional thresholds and fitted regressions, while the MFIR framework itself is not circular.
-
self definitional
[Section 4.2.3, 'Quantifying the True Cost' / Figure 12(a)]
"Instead, Backend-Core instructions average only 7.9 cycles from the preceding squash, 4.5× closer than the baseline, with 93.5% occurring within 50 cycles versus 75.5% expected under independence. Reattributing this squash-proximate fraction raises the true misprediction cost from 47.7% to 61.5%, a 29% TMA underestimate."
The 'true misprediction cost' is defined as the original Bad Speculation bucket plus every Backend-Core stall within 50 cycles of a squash. Under that definition, the 29% 'underestimate' is a direct consequence of the chosen threshold: any stall falling inside the window is automatically reattributed, regardless of whether the squash caused it. The paper's own independence baseline (75.5% expected within 50 cycles) shows proximity alone cannot identify causation, yet the reattribution counts all proximal stalls. The headline underestimate is therefore an artifact of the definition, not an independently measured causal cost.
-
fitted input called prediction
[Section 4.2.3, 'IQ Capacity Theft Cost' and 'WP Burst Concentration' / Figure 12(b)]
"A regression over execution windows shows a strong negative correlation (r=-0.919) between WP IQ occupancy and IPC: each additional WP entry measurably slows the CP. Projecting a 15%–40% reduction in WP instructions, the range targeted by the hardware mechanisms in 4.2.4, yields +13%–+22% IPC. ... Applying this reduction, within the calibrated 15–40% regression range already evaluated in IQ regression, requiring no extrapolation, projects +21% IPC."
The +13–22% and +21% IPC 'projections' are the fitted regression evaluated at assumed reductions in the same WP IQ occupancy variable on which the regression was fit. The reduction range is chosen to match the proposed fixes, and the +21% figure is obtained by plugging a measured WP-damage fraction into that already calibrated range. The result is statistically forced by the fitted slope and the assumed input, not an out-of-sample counterfactual. The only measured validation (+2.40% IPC) covers a small 8.7% slice of the WP pool and cannot confirm the full extrapolated +21%.
full rationale
The MFIR construction itself is not circular: flow/resource IDs are assigned at instrumentation time and the causal graph is built from simulator events, so the core observability framework has independent content. However, the paper's headline case-study quantities do reduce by construction. The 'true misprediction cost' is defined via a 50-cycle squash-proximity threshold, making the claimed 29% TMA underestimate a tautology of that definition. The IPC projections are linear extrapolations from a regression fit on the same trace, with assumed reduction ranges selected to align with the proposed fixes, so they are fitted inputs presented as mechanistically grounded predictions. These are partial, case-study-level circularities; the central graph-traversal and attribution machinery retains independent value, but the quantitative claims should not be read as independent counterfactual validations.
Assumptions & free parameters
free parameters (5)
- 50-cycle squash-proximity threshold =
50 cycles
- burst gap threshold =
<20 cycles
- IPC-vs-WP-IQ-occupancy regression coefficients =
not reported (r=-0.919)
- 15–40% WP-reduction range =
15%–40%
- IQ structural threshold =
IQ >= 75% full
assumptions (3)
- domain assumption Trace-level flow/resource correlation rules are complete and correct.
- domain assumption Simulator models (gem5, ChampSim) faithfully reflect real microarchitectural causality.
- domain assumption SimPoint representative windows stand in for full benchmark behavior.
Cite this review
Pith. "Pith review of Microflow: Microarchitectural Causal Observability for Deep Cross-Layer Analysis and Optimization." pith.science (2026). https://pith.science/paper/XBLNQ2V7
@misc{pith2026260713184,
  author       = {Pith},
  title        = {Pith review of: Microflow: Microarchitectural Causal Observability for Deep Cross-Layer Analysis and Optimization},
  year         = {2026},
  howpublished = {\url{https://pith.science/paper/XBLNQ2V7}},
  note         = {Machine review of arXiv:2607.13184}
}
read the original abstract
Existing architectural simulators expose aggregate metrics or raw traces, but fail to reveal complex interactions among microarchitectural events and their relationship to program execution. Consequently, architects observe performance symptoms but cannot systematically attribute them to root causes across abstraction layers. This paper introduces Microflow, an observability framework elevating causality to a first-class analytical object. Microflow transforms execution traces into the Microflow Intermediate Representation (MFIR), explicitly capturing dependencies across software semantics, instructions, microarchitectural events, and hardware resources. By unifying these elements, MFIR enables direct traversal from observed stalls to their underlying causes, paving the way for automated root-cause analysis. Microflow precisely attributes stalls, reveals unobservable phenomena, and enables exact critical-path decomposition through counterfactual analysis. These capabilities allow systematic reasoning about complex hardware-software interactions opaque to existing tools. Making causality queryable, Microflow provides a strong foundation for performance analysis and hardware-software co-design. We demonstrate it on two SPEC CPU 2017 benchmarks, uncovering bottlenecks invisible from aggregate symptoms: hidden misprediction costs in leela and cross-loop-iteration contention in mcf.
Figures


Figures from the paper (10 more)


Reference graph
Works this paper leans on
-
[1]
Laksono Adhianto, Sinchan Banerjee, Mike Fagan, Mark Krentel, Gabriel Marin, John Mellor-Crummey, and Nathan R Tallent. 2010. HPCToolkit: Tools for perfor- mance analysis of optimized parallel programs.Concurrency and Computation: Practice and Experience22, 6 (2010), 685–701
2010
-
[2]
Advanced Micro Devices, Inc. 2025. AMD uProf. https://www.amd.com/en/ developer/uprof.html. Accessed: October 2025
2025
-
[3]
Chen Bai et al. 2023. ArchExplorer: Microarchitecture Exploration via Bottleneck Analysis. In56th Annual IEEE/ACM International Symposium on Microarchitecture (MICRO)
2023
-
[4]
David Boehme, Todd Gamblin, David Beckingsale, Peer-Timo Bremer, Alfredo Gimenez, Matthew LeGendre, Olga Pearce, and Martin Schulz. 2016. Caliper: performance introspection for HPC software stacks. InSC’16: Proceedings of the International Conference for High Performance Computing, Networking, Storage and Analysis. IEEE, 550–560
2016
-
[5]
Silvio Heverton Campelo de Santana, Joseph Rogers, Lieven Eeckhout, and Mag- nus Jahre. 2026. Chips Need DIP: Time-Proportional Per-Instruction Cycle Stacks at Dispatch. In31st ACM International Conference on Architectural Support for Programming Languages and Operating Systems (ASPLOS), Volume 2. 361–376
2026
-
[6]
Trevor E Carlson, Wim Heirman, and Lieven Eeckhout. 2011. Sniper: Exploring the level of abstraction for scalable and accurate parallel multi-core simulation. InProceedings of 2011 International Conference for High Performance Computing, Networking, Storage and Analysis. 1–12
2011
-
[7]
Fields, Rastislav Bodík, Mark D
Brian A. Fields, Rastislav Bodík, Mark D. Hill, and Chris J. Newburn. 2003. Using Interaction Costs for Microarchitectural Bottleneck Analysis. In36th Annual IEEE/ACM International Symposium on Microarchitecture (MICRO-36). IEEE, 228– 239
2003
-
[8]
Markus Geimer, Felix Wolf, Brian JN Wylie, Erika Ábrahám, Daniel Becker, and Bernd Mohr. 2010. The Scalasca performance toolset architecture.Concurrency and computation: Practice and experience22, 6 (2010), 702–719
2010
Show all 30 references
-
[9]
Nathan Gober, Gino Chacon, Lei Wang, Paul V Gratz, Daniel A Jimenez, Elvira Teran, Seth Pugsley, and Jinchun Kim. 2022. The championship simulator: Archi- tectural simulation for education and competition.arXiv preprint arXiv:2210.14324 (2022)
2022 arXiv
-
[10]
Hossein Golestani et al . 2022. Calipers: A Criticality-aware Framework for Modeling Processor Performance. In36th ACM International Conference on Su- percomputing (ICS)
2022
-
[11]
Björn Gottschall, Lieven Eeckhout, and Magnus Jahre. 2023. TEA: Time- Proportional Event Analysis. In50th Annual International Symposium on Com- puter Architecture (ISCA)
2023
-
[12]
Dragana Grbic and John Mellor-Crummey. 2025. Analyzing the Performance of Applications at Exascale. InProceedings of the 39th ACM International Conference on Supercomputing. 792–806
2025
-
[13]
Greg Hamerly, Erez Perelman, Jeremy Lau, and Brad Calder. 2005. Simpoint 3.0: Faster and more flexible program phase analysis.Journal of Instruction Level Parallelism7, 4 (2005), 1–28
2005
-
[14]
Intel Corporation. 2025. Intel®VTune™Profiler. https://www.intel.com/content/ www/us/en/developer/tools/oneapi/vtune-profiler.html. Accessed October 2025
2025
-
[15]
Mahmoud Khairy, Zhesheng Shen, Tor M Aamodt, and Timothy G Rogers. 2020. Accel-sim: An extensible simulation framework for validated gpu modeling. In 2020 ACM/IEEE 47th Annual International Symposium on Computer Architecture (ISCA). IEEE, 473–486
2020
-
[16]
Andreas Knüpfer, Holger Brunst, Jens Doleschal, Matthias Jurenz, Matthias Lieber, Holger Mickler, Matthias S Müller, and Wolfgang E Nagel. 2008. The vampir performance analysis tool-set. InTools for High Performance Computing: Pro- ceedings of the 2nd International Workshop on...
2008
-
[17]
Shang Li, Zhiyuan Yang, Dhiraj Reddy, Ankur Srivastava, and Bruce Jacob. 2020. DRAMsim3: A cycle-accurate, thermal-capable DRAM simulator.IEEE Computer Architecture Letters19, 2 (2020), 106–109
2020
-
[18]
Jason Lowe-Power, Abdul Mutaal Ahmad, Ayaz Akram, Mohammad Alian, Rico Amslinger, Matteo Andreozzi, Adrià Armejach, Nils Asmussen, Brad Beckmann, Srikant Bharadwaj, et al. 2020. The gem5 simulator: Version 20.0+.arXiv preprint arXiv:2007.03152(2020)
2020 arXiv
-
[19]
Haocong Luo, Yahya Can Tuğrul, F Nisa Bostancı, Ataberk Olgun, A Giray Yağlıkçı, and Onur Mutlu. 2023. Ramulator 2.0: A modern, modular, and extensible dram simulator.IEEE Computer Architecture Letters23, 1 (2023), 112–116
2023
-
[20]
John Mellor-Crummey, Robert J Fowler, Gabriel Marin, and Nathan Tallent. 2002. HPCView: A tool for top-down analysis of node performance.The Journal of Supercomputing23, 1 (2002), 81–104
2002
-
[21]
Kaushal Mhapsekar, Azam Ghanbari, Bita Aslrousta, and Samira Mirbagher- Ajorpaz. 2026. CacheMind: From Miss Rates to Why-Natural-Language, Trace- Grounded Reasoning for Cache Replacement. InProceedings of the 31st ACM International Conference on Architectural Support for Progr...
2026
-
[22]
NVIDIA Corporation. 2025. NVIDIA Nsight Compute. https://developer.nvidia. com/nsight-compute. Accessed October 2025
2025
-
[23]
Avadh Patel, Furat Afram, and Kanad Ghose. 2011. Marss-x86: A qemu-based micro-architectural and systems simulator for x86 multicore processors. In1st International Qemu Users’ Forum. Citeseer, 29–30
2011
-
[24]
Ritik Raj, Sarbartha Banerjee, Nikhil Chandra, Zishen Wan, Jianming Tong, Ananda Samajdhar, and Tushar Krishna. 2025. SCALE-Sim v3: A modular cycle- accurate systolic accelerator simulator for end-to-end system analysis. In2025 IEEE International Symposium on Performance Analy...
2025
-
[25]
Daniel Sanchez and Christos Kozyrakis. 2013. ZSim: Fast and accurate microar- chitectural simulation of thousand-core systems.ACM SIGARCH Computer architecture news41, 3 (2013), 475–486
2013
-
[26]
Sameer S Shende and Allen D Malony. 2006. The TAU parallel performance system.The International Journal of High Performance Computing Applications 20, 2 (2006), 287–311
2006
-
[27]
Rafael Ubal, Julio Sahuquillo, Salvador Petit, and Pedro Lopez. 2007. Multi2sim: A simulation framework to evaluate multicore-multithreaded processors. In 19th International Symposium on Computer Architecture and High Performance Computing (SBAC-PAD’07). IEEE, 62–68
2007
-
[28]
Vincent M Weaver. 2013. Linux perf_event features and overhead. InThe 2nd international workshop on performance analysis of workload optimized systems, FastPath, Vol. 13. 5
2013
-
[29]
Thomas F Wenisch, Roland E Wunderlich, Michael Ferdman, Anastassia Ailamaki, Babak Falsafi, and James C Hoe. 2006. SimFlex: statistical sampling of computer system simulation.IEEE Micro26, 4 (2006), 18–31
2006
-
[30]
Ahmad Yasin. 2014. A top-down method for performance analysis and counters architecture. In2014 IEEE International Symposium on Performance Analysis of Systems and Software (ISPASS). IEEE, 35–44. 13
2014
Reviewed August 2, 2026 · model on record in the stance chip above.
Discussion (0). Sign in to comment.