Wasserstein Least Squares: A Canonical Regression Method for Probability Distributions
Pith reviewed 2026-06-28 23:57 UTC · model grok-4.3
The pith
Wasserstein least squares extends classical least squares to probability distributions as its canonical convex-analytic counterpart and attains root-n estimation rates under a deformation model.
A machine-rendered reading of the paper's core claim, the machinery that carries it, and where it could break.
Core claim
Wasserstein least squares is the canonical extension of Euclidean least squares to the space of probability distributions from the perspective of convex analysis; this viewpoint gives rise to multimarginal and dual formulations of the Wasserstein least squares problem, extending a similar theory for Wasserstein barycenters. Under the template deformation model, estimation is possible at the n^{-1/2} rate, which produces an exponential improvement over prior rates for Wasserstein barycenters.
What carries the argument
Wasserstein least squares problem, defined by minimizing expected squared Wasserstein distance to a linear predictor in the space of measures and shown to be the convex-analytic lift of Euclidean least squares.
If this is right
- The regression estimator converges at the parametric n^{-1/2} rate for the underlying map from covariates to distributions.
- Wasserstein barycenters, recovered as the intercept-only case, inherit the same n^{-1/2} rate, an exponential improvement over previous bounds.
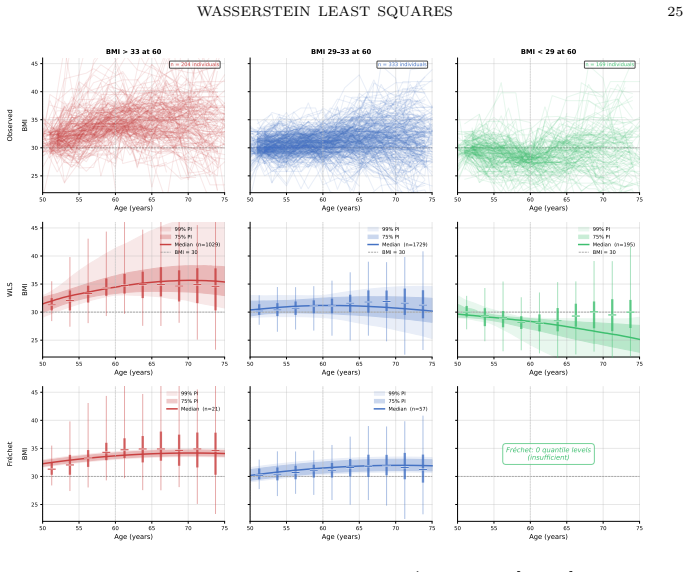
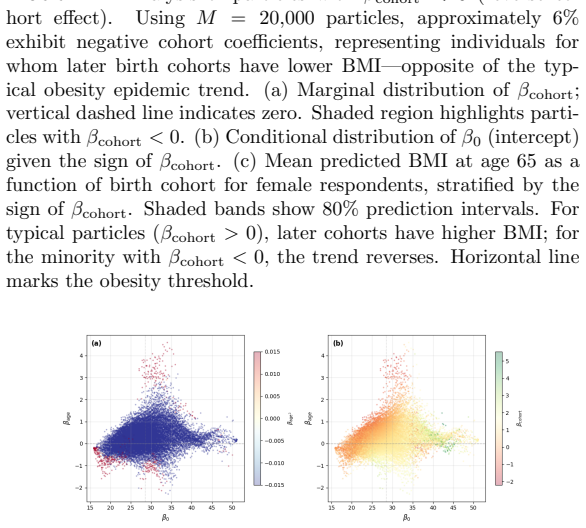
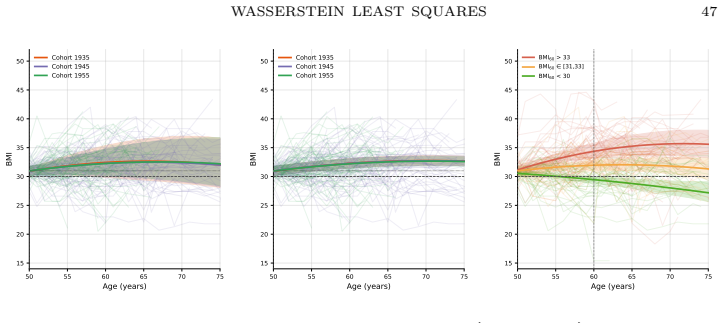
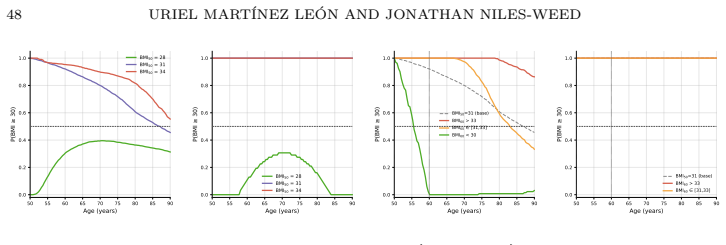
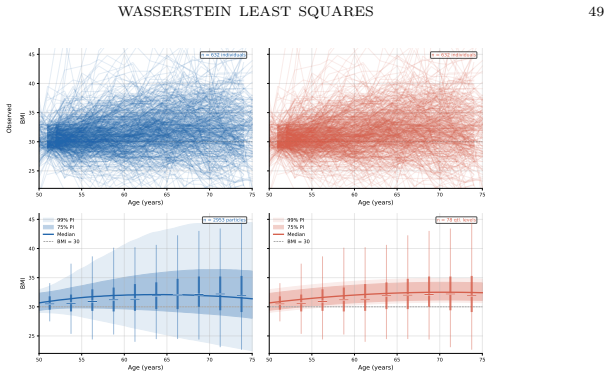
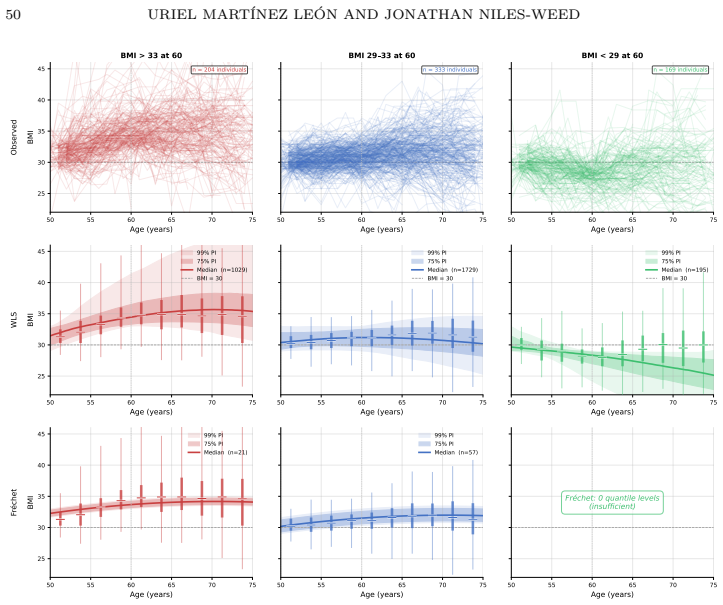
- A particle-based heuristic permits computation on large data sets and yields new demographic insights from the RAND Health and Retirement Study.
Where Pith is reading between the lines
- The random-effects interpretation may allow transfer of classical mixed-model diagnostics to the Wasserstein setting.
- The multimarginal formulation could be adapted to other convex losses beyond squared distance in optimal transport regression.
- Robustness checks on data lacking a clear template could quantify how much the parametric rate degrades outside the model.
Load-bearing premise
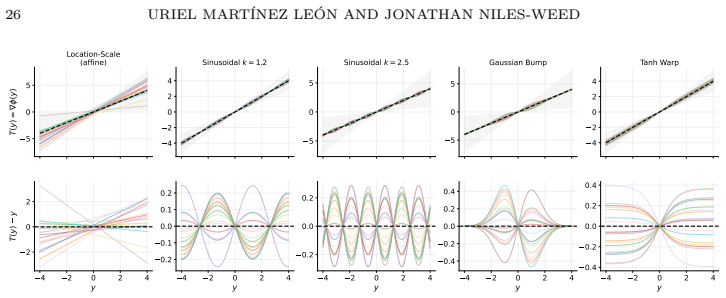
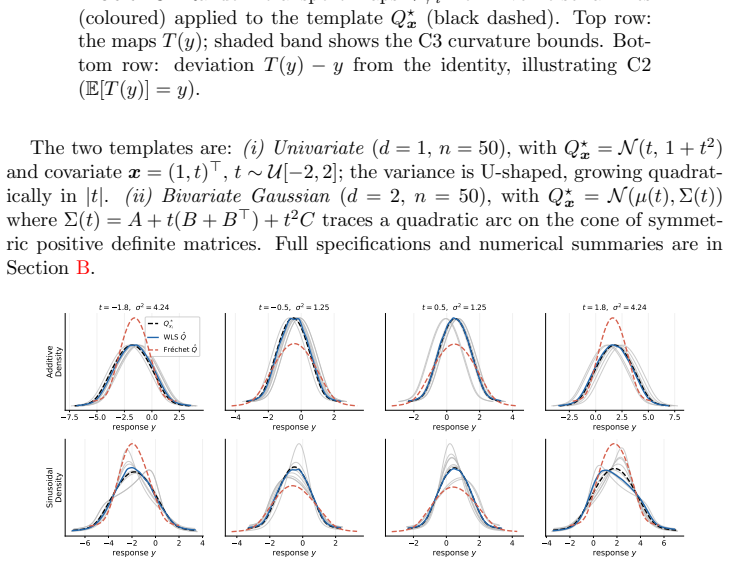
Observed distributions are generated as random deformations of one fixed template distribution.
What would settle it
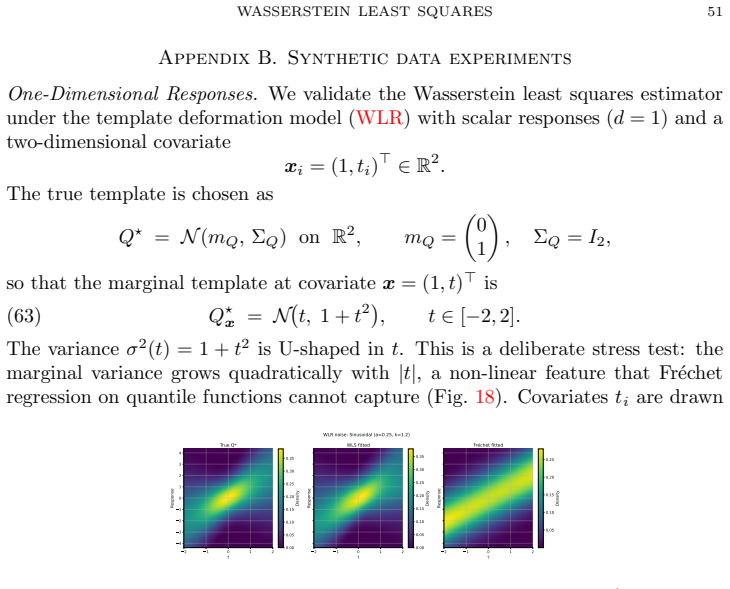
A simulation in which distributions are generated without a common template yet the estimator still converges at rate n to the minus one half would falsify the necessity of the deformation model for the claimed rate.
Figures
read the original abstract
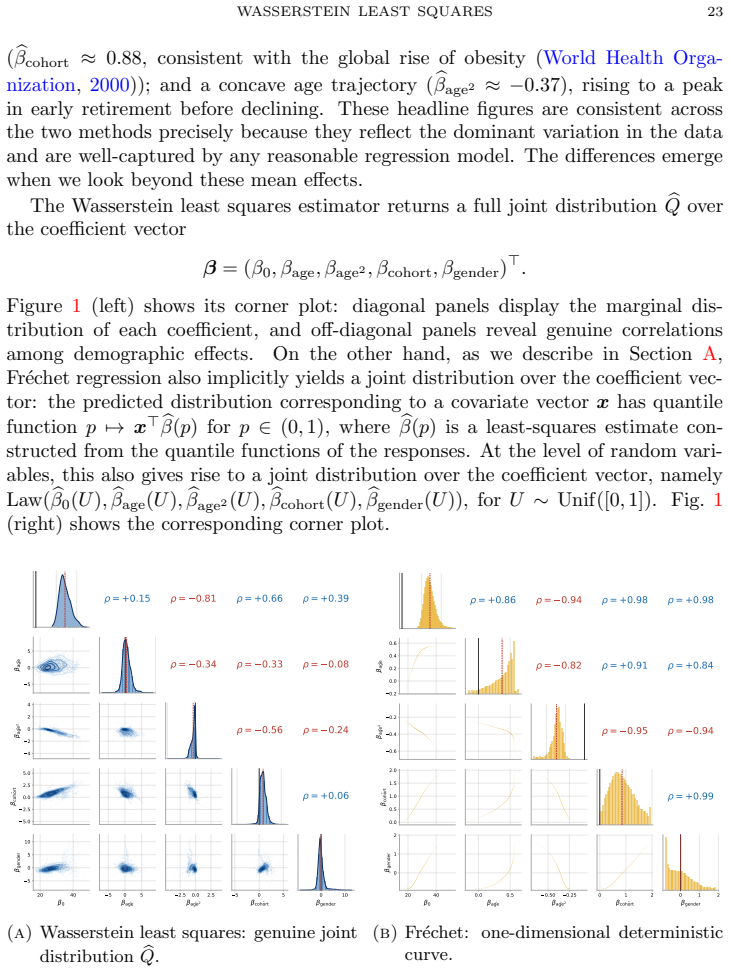
We perform a mathematical and statistical analysis of the Wasserstein least squares problem, a regression method for vector-valued covariates and distribution-valued responses. Our proposal contrasts with other distributional regression methods by having a direct interpretation in terms of random variables, as a nonparametric analogue of the classic random-effects model. On the mathematical side, we use a strategy of Lavenant (2024) to show that Wasserstein least squares is the canonical extension of Euclidean least squares to the space of probability distributions from the perspective of convex analysis; this viewpoint gives rise to multimarginal and dual formulations of the Wasserstein least squares problem, extending a similar theory for Wasserstein barycenters. We perform a statistical analysis of the Wasserstein least squares problem under the template deformation model, showing, surprisingly, that estimation is possible at the n^{-1/2} rate. As a special case, we obtain improved rates of estimation for Wasserstein barycenters, which are an exponential improvement over those established by Ahidar-Coutrix, Le Gouic and Paris (2020). Finally, we propose a heuristic particle method for Wasserstein least squares and use it to conduct a novel analysis of large-scale demographic data from the RAND Health and Retirement Study.
Editorial analysis
A structured set of objections, weighed in public.
Referee Report
Summary. The paper introduces Wasserstein least squares as a regression method mapping vector covariates to distribution-valued responses. It uses a convex-analysis strategy from Lavenant (2024) to establish this as the canonical extension of Euclidean least squares, yielding multimarginal and dual formulations that extend barycenter theory. Under the template deformation model, the estimator achieves the parametric n^{-1/2} rate; as a special case this yields exponentially faster rates for Wasserstein barycenters than those in Ahidar-Coutrix et al. (2020). A particle heuristic is proposed and applied to RAND Health and Retirement Study demographic data.
Significance. The convex-analytic characterization supplies a principled, optimization-based foundation for distributional regression that may unify existing approaches. The n^{-1/2} rate under the deformation model is a notable improvement in a structured setting and directly improves barycenter estimation when the model holds. The empirical section provides a concrete demonstration on large-scale data, though the practical scope is limited by the modeling assumption.
major comments (2)
- [Statistical analysis section] Statistical analysis section (abstract and corresponding main-text section): the n^{-1/2} rate and the exponential improvement over Ahidar-Coutrix et al. (2020) are obtained exclusively under the template deformation model; the manuscript should state explicitly whether any general (nonparametric) rate is available or whether the model is indispensable for the claimed rate, as this assumption is load-bearing for the headline statistical result.
- [Mathematical analysis section] Mathematical analysis section: the multimarginal and dual formulations are asserted to follow from Lavenant (2024); the paper should include a self-contained verification that the Wasserstein least-squares functional is convex (or strictly convex under stated conditions) and that the dual problem recovers the same minimizer, citing the precise equation or proposition where this is shown.
minor comments (2)
- [Application section] The abstract states that the n^{-1/2} claim rests on the template deformation model; the main text should add a short paragraph clarifying how this model is checked or motivated for the RAND data application.
- Notation for the multimarginal formulation should be aligned with the barycenter literature to facilitate comparison; a short remark contrasting the two problems would improve readability.
Simulated Author's Rebuttal
We thank the referee for the positive assessment and the two constructive major comments. Both points can be addressed by targeted revisions that clarify the scope of the statistical results and strengthen the self-contained mathematical presentation. We outline our responses below.
read point-by-point responses
-
Referee: [Statistical analysis section] Statistical analysis section (abstract and corresponding main-text section): the n^{-1/2} rate and the exponential improvement over Ahidar-Coutrix et al. (2020) are obtained exclusively under the template deformation model; the manuscript should state explicitly whether any general (nonparametric) rate is available or whether the model is indispensable for the claimed rate, as this assumption is load-bearing for the headline statistical result.
Authors: We agree that the n^{-1/2} rate (and the resulting exponential improvement for barycenters) is derived exclusively under the template deformation model; no general nonparametric rate is claimed or derived in the paper. The model is indispensable for the parametric rate. We will revise the abstract and the statistical analysis section to state this explicitly, making clear that the headline rate requires the deformation assumption and that the analysis does not provide rates outside this structured setting. revision: yes
-
Referee: [Mathematical analysis section] Mathematical analysis section: the multimarginal and dual formulations are asserted to follow from Lavenant (2024); the paper should include a self-contained verification that the Wasserstein least-squares functional is convex (or strictly convex under stated conditions) and that the dual problem recovers the same minimizer, citing the precise equation or proposition where this is shown.
Authors: We will add a short self-contained verification in the mathematical analysis section. This will adapt the convex-analytic arguments of Lavenant (2024) to the Wasserstein least-squares functional, explicitly showing convexity (and strict convexity under the stated conditions on the cost) and verifying that the dual recovers the same minimizer. The added text will cite the precise propositions from Lavenant (2024) that are being specialized, while keeping the argument self-contained for the reader. revision: yes
Circularity Check
No circularity: external strategy and explicit model assumption yield independent content
full rationale
The paper invokes an external strategy from Lavenant (2024) for the convex-analysis claim that Wasserstein least squares is canonical, and derives the n^{-1/2} rate explicitly under the stated template deformation model. Neither step reduces a prediction to a fitted quantity by construction, nor relies on self-citation load-bearing or ansatz smuggling. The comparison to Ahidar-Coutrix et al. (2020) is a benchmark contrast, not a definitional reduction. The derivation chain therefore contains independent mathematical and statistical content.
Axiom & Free-Parameter Ledger
axioms (2)
- domain assumption The template deformation model holds for the observed distributions.
- domain assumption Lavenant (2024) strategy applies to the Wasserstein least squares functional.
Reference graph
Works this paper leans on
-
[1]
Barycenters in the wasserstein space.SIAM Journal on Mathematical Analysis, 43(2):904–924, 2011
Martial Agueh and Guillaume Carlier. Barycenters in the Wasserstein space. SIAM Journal on Mathematical Analysis, 43 0 (2): 0 904--924, 2011. doi:10.1137/100805741
-
[2]
Adil Ahidar-Coutrix, Thibaut Le Gouic, and Quentin Paris. Convergence rates for empirical barycenters in metric spaces: curvature, convexity and extendable geodesics. Probability Theory and Related Fields, 177 0 (1--2): 0 323--368, 2020. doi:10.1007/s00440-019-00950-0
-
[3]
Alexandrov Geometry: Foundations , volume 236 of Graduate Studies in Mathematics
Stephanie Alexander, Vitali Kapovitch, and Anton Petrunin. Alexandrov Geometry: Foundations , volume 236 of Graduate Studies in Mathematics. American Mathematical Society, Providence, RI, 2024. ISBN 978-1-4704-7536-9
2024
-
[4]
Charalambos D. Aliprantis and Kim C. Border. Infinite Dimensional Analysis: A Hitchhiker's Guide. Springer, Berlin, 3 edition, 2006. doi:10.1007/3-540-29587-9
-
[5]
Altschuler and Enric Boix-Adser \`a
Jason M. Altschuler and Enric Boix-Adser \`a . Wasserstein barycenters can be computed in polynomial time in fixed dimension. Journal of Machine Learning Research, 22 0 (44): 0 1--19, 2021. URL https://jmlr.org/papers/v22/20-588.html
2021
-
[6]
Altschuler, Sinho Chewi, Patrik R
Jason M. Altschuler, Sinho Chewi, Patrik R. Gerber, and Austin J. Stromme. Averaging on the Bures -- Wasserstein manifold: dimension-free convergence of gradient descent. In Advances in Neural Information Processing Systems, volume 34, pages 22132--22145, 2021
2021
-
[7]
u rich. Birkh \
Luigi Ambrosio, Nicola Gigli, and Giuseppe Savar \'e . Gradient Flows in Metric Spaces and in the Space of Probability Measures. Lectures in Mathematics ETH Z \"u rich. Birkh \"a user, Basel, 2 edition, 2008. ISBN 978-3-7643-8721-1
2008
-
[8]
Barlow, David J
Richard E. Barlow, David J. Bartholomew, Joan M. Bremner, and Hugh D. Brunk. Statistical Inference under Order Restrictions: The Theory and Application of Isotonic Regression. Wiley Series in Probability and Mathematical Statistics. John Wiley & Sons, London, 1972
1972
-
[9]
Geometrizing rates of convergence, ii.The Annals of Statistics, 19, 06 1991
Rudolf Beran and Peter Hall. Estimating coefficient distributions in random coefficient regressions. The Annals of Statistics, 20 0 (4): 0 1970--1984, 1992. doi:10.1214/aos/1176348898
-
[10]
On the Bures -- Wasserstein distance between positive definite matrices
Rajendra Bhatia, Tanvi Jain, and Yongdo Lim. On the Bures -- Wasserstein distance between positive definite matrices. Expositiones Mathematicae, 37 0 (2): 0 165--191, 2019. doi:10.1016/j.exmath.2018.01.002
-
[11]
Estimation and inference for the Wasserstein distance between mixing measures in topic models, 2022
Xin Bing, Florentina Bunea, and Jonathan Niles-Weed. Estimation and inference for the Wasserstein distance between mixing measures in topic models, 2022. Forthcoming, Bernoulli
2022
-
[12]
Distribution's template estimate with Wasserstein metrics
Emmanuel Boissard, Thibaut Le Gouic, and Jean-Michel Loubes. Distribution's template estimate with Wasserstein metrics. Bernoulli, 21 0 (2): 0 740--759, 2015. doi:10.3150/13-BEJ585
-
[13]
An Introduction to Optimization on Smooth Manifolds
Nicolas Boumal. An Introduction to Optimization on Smooth Manifolds. Cambridge University Press, 2023. doi:10.1017/9781009166164
-
[14]
G., Gut, G., Sarabia del Castillo, J., Levesque, M., Lehmann, K.-V., Pelkmans, L., Krause, A
Charlotte Bunne, Stefan G. Stark, Gabriele Gut, Jacobo Sarabia del Castillo , Mitch Levesque, Kjong-Van Lehmann, Lucas Pelkmans, Andreas Krause, and Gunnar R \"a tsch. Learning single-cell perturbation responses using neural optimal transport. Nature Methods, 20 0 (11): 0 1759--1768, 2023. doi:10.1038/s41592-023-01969-x
-
[15]
doi: 10.1007/s10208-009-9045-5
Emmanuel J. Cand \`e s and Benjamin Recht. Exact matrix completion via convex optimization. Foundations of Computational Mathematics, 9 0 (6): 0 717--772, 2009. doi:10.1007/s10208-009-9045-5
-
[16]
About adult BMI , 2024
Centers for Disease Control and Prevention . About adult BMI , 2024. URL https://www.cdc.gov/bmi/about/index.html. Accessed: 2026-02-03
2024
-
[17]
Journal of the American Statistical Association , volume =
Yaqing Chen, Zhenhua Lin, and Hans-Georg M \"u ller. Wasserstein regression. Journal of the American Statistical Association, 118 0 (542): 0 869--882, 2023. doi:10.1080/01621459.2021.1956937
-
[18]
Sinho Chewi, Tyler Maunu, Philippe Rigollet, and Austin J. Stromme. Gradient descent algorithms for Bures -- Wasserstein barycenters. In Proceedings of the 33rd Conference on Learning Theory, volume 125 of Proceedings of Machine Learning Research, pages 1276--1304. PMLR, 2020
2020
-
[19]
https://doi.org/10.1007/978-3-031-85160-5
Sinho Chewi, Jonathan Niles-Weed, and Philippe Rigollet. Statistical Optimal Transport, volume 2364 of Lecture Notes in Mathematics. Springer, Cham, 2025. ISBN 978-3-031-85159-9. doi:10.1007/978-3-031-85160-5. \'E cole d' \'E t \'e de Probabilit \'e s de Saint-Flour XLIX -- 2019
-
[20]
Faster Wasserstein distance estimation with the Sinkhorn divergence
L \'e na \" c Chizat, Pierre Roussillon, Flavien L \'e ger, Fran c ois-Xavier Vialard, and Gabriel Peyr \'e . Faster Wasserstein distance estimation with the Sinkhorn divergence. In Advances in Neural Information Processing Systems, volume 33, pages 2257--2269, 2020
2020
-
[21]
Panel data from time series of cross-sections
Angus Deaton. Panel data from time series of cross-sections. Journal of Econometrics, 30 0 (1--2): 0 109--126, 1985. doi:10.1016/0304-4076(85)90134-4
-
[22]
A short proof on the rate of convergence of the empirical measure for the Wasserstein distance, 2021
Vincent Divol. A short proof on the rate of convergence of the empirical measure for the Wasserstein distance, 2021
2021
-
[23]
On the complexity of the optimal transport problem with graph-structured cost
Jiaojiao Fan, Isabel Haasler, Johan Karlsson, and Yongxin Chen. On the complexity of the optimal transport problem with graph-structured cost. In Proceedings of the 25th International Conference on Artificial Intelligence and Statistics, volume 151 of Proceedings of Machine Learning Research, pages 9147--9165. PMLR, 2022
2022
-
[24]
On the rate of convergence in W asserstein distance of the empirical measure
Nicolas Fournier and Arnaud Guillin. On the rate of convergence in Wasserstein distance of the empirical measure. Probability Theory and Related Fields, 162 0 (3--4): 0 707--738, 2015. doi:10.1007/s00440-014-0583-7
-
[25]
On a formula for the L^2 Wasserstein metric between measures on Euclidean and Hilbert spaces
Matthias Gelbrich. On a formula for the L^2 Wasserstein metric between measures on Euclidean and Hilbert spaces. Mathematische Nachrichten, 147: 0 185--203, 1990. doi:10.1002/mana.19901470121
-
[26]
Laya Ghodrati and Victor M. Panaretos. Distribution-on-distribution regression via optimal transport maps. Biometrika, 109 0 (4): 0 957--974, 2022. doi:10.1093/biomet/asac005
-
[27]
In BMI we trust: reframing the body mass index as a measure of health
Iliya Gutin. In BMI we trust: reframing the body mass index as a measure of health. Social Theory & Health, 16 0 (3): 0 256--271, 2018. doi:10.1057/s41285-017-0055-0
-
[28]
2009.The Elements of Statistical Learning: Data Mining, Inference, and Prediction(2 ed.)
Trevor Hastie, Robert Tibshirani, and Jerome Friedman. The Elements of Statistical Learning: Data Mining, Inference, and Prediction. Springer Series in Statistics. Springer, New York, 2 edition, 2009. doi:10.1007/978-0-387-84858-7
-
[29]
Jean-Baptiste Hiriart-Urruty and Claude Lemar \'e chal. Convex Analysis and Minimization Algorithms I : Fundamentals , volume 305 of Grundlehren der mathematischen Wissenschaften. Springer, Berlin, 1993. doi:10.1007/978-3-662-02796-7
-
[30]
David C. Hoaglin and Roy E. Welsch. The hat matrix in regression and ANOVA . The American Statistician, 32 0 (1): 0 17--22, 1978. doi:10.1080/00031305.1978.10479237
work page internal anchor Pith review Pith/arXiv arXiv doi:10.1080/00031305.1978.10479237 1978
-
[31]
Analyzing the random coefficient model nonparametrically
Stefan Hoderlein, Jussi Klemel \"a , and Enno Mammen. Analyzing the random coefficient model nonparametrically. Econometric Theory, 26 0 (3): 0 804--837, 2010. doi:10.1017/S0266466609990119
-
[32]
Theoretical Foundations of Functional Data Analysis, with an Introduction to Linear Operators
Tailen Hsing and Randall Eubank. Theoretical Foundations of Functional Data Analysis, with an Introduction to Linear Operators. Wiley Series in Probability and Statistics. John Wiley & Sons, Chichester, 2015. doi:10.1002/9781118762547
-
[33]
Huckemann
Shayan Hundrieser, Benjamin Eltzner, and Stephan F. Huckemann. A lower bound for estimating Fr \'e chet means, 2024
2024
-
[34]
Georgiou
Amirhossein Karimi and Tryphon T. Georgiou. Regression analysis of distributional data through multi-marginal optimal transport, 2021
2021
-
[35]
Amirhossein Karimi, Luigia Ripani, and Tryphon T. Georgiou. Statistical learning in Wasserstein space. IEEE Control Systems Letters, 5 0 (3): 0 899--904, 2021. doi:10.1109/LCSYS.2020.3006837
-
[36]
Hamed Karimi, Julie Nutini, and Mark Schmidt. Linear convergence of gradient and proximal-gradient methods under the Polyak -- ojasiewicz condition. In Machine Learning and Knowledge Discovery in Databases (ECML PKDD), volume 9851 of Lecture Notes in Computer Science, pages 795--811. Springer, 2016. doi:10.1007/978-3-319-46128-1_50
-
[37]
Nan M. Laird and James H. Ware. Random-effects models for longitudinal data. Biometrics, 38 0 (4): 0 963--974, 1982. doi:10.2307/2529876
-
[38]
Variational inference via Wasserstein gradient flows
Marc Lambert, Sinho Chewi, Francis Bach, Silv \`e re Bonnabel, and Philippe Rigollet. Variational inference via Wasserstein gradient flows. In Advances in Neural Information Processing Systems, volume 35, 2022
2022
-
[39]
Lifting functionals defined on maps to measure-valued maps via optimal transport
Hugo Lavenant. Lifting functionals defined on maps to measure-valued maps via optimal transport. Annali della Scuola Normale Superiore di Pisa, Classe di Scienze, 2024. doi:10.2422/2036-2145.202309_034. Published online
-
[40]
Thibaut Le Gouic, Quentin Paris, Philippe Rigollet, and Austin J. Stromme. Fast convergence of empirical barycenters in Alexandrov spaces and the Wasserstein space. Journal of the European Mathematical Society, 25 0 (6): 0 2229--2250, 2023. doi:10.4171/jems/1234
-
[41]
Longford
Nicholas T. Longford. Random Coefficient Models, volume 11 of Oxford Statistical Science Series. Clarendon Press, Oxford University Press, New York, 1993. ISBN 0-19-852264-9
1993
-
[42]
Sharp convergence rates for empirical optimal transport with smooth costs
Tudor Manole and Jonathan Niles-Weed. Sharp convergence rates for empirical optimal transport with smooth costs. The Annals of Applied Probability, 34 0 (1B): 0 1108--1135, 2024. doi:10.1214/23-AAP1986
-
[43]
Plugin estimation of smooth optimal transport maps
Tudor Manole, Sivaraman Balakrishnan, Jonathan Niles-Weed, and Larry Wasserman. Plugin estimation of smooth optimal transport maps. The Annals of Statistics, 52 0 (3): 0 966--998, 2024. doi:10.1214/24-AOS2379
-
[44]
Peter Hall , functional data analysis and random objects
Hans-Georg M \"u ller. Peter Hall , functional data analysis and random objects. The Annals of Statistics, 44 0 (5): 0 1867--1887, 2016. doi:10.1214/16-AOS1492
-
[45]
Minimax estimation of smooth densities in Wasserstein distance
Jonathan Niles-Weed and Quentin Berthet. Minimax estimation of smooth densities in Wasserstein distance. The Annals of Statistics, 50 0 (3): 0 1519--1540, 2022. doi:10.1214/21-AOS2161
-
[46]
Victor M. Panaretos and Yoav Zemel. An Invitation to Statistics in Wasserstein Space . SpringerBriefs in Probability and Mathematical Statistics. Springer, Cham, 2020. doi:10.1007/978-3-030-38438-8
-
[47]
Fr \'e chet regression for random objects with Euclidean predictors
Alexander Petersen and Hans-Georg M \"u ller. Fr \'e chet regression for random objects with Euclidean predictors. The Annals of Statistics, 47 0 (2): 0 691--719, 2019. doi:10.1214/17-AOS1624
-
[48]
Alexander Petersen, Xi Liu, and Afshin A. Divani. Wasserstein F -tests and confidence bands for the Fr \'e chet regression of density response curves. The Annals of Statistics, 49 0 (1): 0 590--611, 2021. doi:10.1214/20-AOS1971
-
[49]
Modeling probability density functions as data objects
Alexander Petersen, Chao Zhang, and Piotr Kokoszka. Modeling probability density functions as data objects. Econometrics and Statistics, 21: 0 159--178, 2022. doi:10.1016/j.ecosta.2021.04.004
-
[50]
J. O. Ramsay and B. W. Silverman. Functional Data Analysis. Springer Series in Statistics. Springer, New York, 2 edition, 2005. ISBN 978-0-387-40080-8
2005
-
[51]
RAND HRS longitudinal file 2022 (v1)
RAND Center for the Study of Aging . RAND HRS longitudinal file 2022 (v1). Technical report, Institute for Social Research, University of Michigan, Ann Arbor, MI, 2025. URL https://hrsdata.isr.umich.edu/data-products/rand-hrs-longitudinal-file-2022. Funded by the National Institute on Aging (NIA U01AG009740) and the Social Security Administration
2022
-
[52]
High-dimensional statistics, 2023
Philippe Rigollet and Jan-Christian H \"u tter. High-dimensional statistics, 2023. Lecture notes for MIT 18.657
2023
-
[53]
Tyrrell Rockafellar
R. Tyrrell Rockafellar. Convex Analysis. Number 28 in Princeton Mathematical Series. Princeton University Press, Princeton, NJ, 1970
1970
-
[54]
A simple relaxation approach to duality for optimal transport problems in completely regular spaces
Giuseppe Savar \'e and Giacomo Enrico Sodini. A simple relaxation approach to duality for optimal transport problems in completely regular spaces. Journal of Convex Analysis, 29 0 (1): 0 1--12, 2022
2022
-
[55]
Minimax distribution estimation in Wasserstein distance, 2018
Shashank Singh and Barnab \'a s P \'o czos. Minimax distribution estimation in Wasserstein distance, 2018
2018
-
[56]
Non- Euclidean data analysis with metric statistics
Wookyeong Song, Hang Zhou, Yidong Zhou, and Hans-Georg M \"u ller. Non- Euclidean data analysis with metric statistics. Harvard Data Science Review, February 2026. URL https://hdsr.mitpress.mit.edu/pub/fi0cphkz
2026
-
[57]
Stephen M. Stigler. The History of Statistics: The Measurement of Uncertainty Before 1900. Belknap Press of Harvard University Press, Cambridge, MA, 1986. ISBN 0-674-40340-1
1900
-
[58]
On the geometry of metric measure spaces
Karl-Theodor Sturm. On the geometry of metric measure spaces. I . Acta Mathematica, 196 0 (1): 0 65--131, 2006. doi:10.1007/s11511-006-0002-8
-
[59]
James W. Vaupel, Kenneth G. Manton, and Eric Stallard. The impact of heterogeneity in individual frailty on the dynamics of mortality. Demography, 16 0 (3): 0 439--454, 1979. doi:10.2307/2061224
-
[60]
A Guide to Modern Econometrics
Marno Verbeek. A Guide to Modern Econometrics. John Wiley & Sons, Hoboken, NJ, 5 edition, 2017. ISBN 978-1-119-40115-5
2017
-
[61]
Roman Vershynin. High-Dimensional Probability: An Introduction with Applications in Data Science, volume 47 of Cambridge Series in Statistical and Probabilistic Mathematics. Cambridge University Press, 2018. doi:10.1017/9781108231596
-
[62]
Springer, Berlin, Heidelberg, 2009
C \'e dric Villani. Optimal Transport: Old and New, volume 338 of Grundlehren der mathematischen Wissenschaften. Springer, Berlin, 2009. doi:10.1007/978-3-540-71050-9
-
[63]
Zachary J. Ward, Sara N. Bleich, Angie L. Cradock, Jessica L. Barrett, Catherine M. Giles, Chasmine Flax, Michael W. Long, and Steven L. Gortmaker. Projected U.S. state-level prevalence of adult obesity and severe obesity. New England Journal of Medicine, 381 0 (25): 0 2440--2450, 2019. doi:10.1056/NEJMsa1909301
-
[64]
Jonathan Weed and Francis Bach. Sharp asymptotic and finite-sample rates of convergence of empirical measures in Wasserstein distance. Bernoulli, 25 0 (4A): 0 2620--2648, 2019. doi:10.3150/18-BEJ1065
-
[65]
Obesity: Preventing and managing the global epidemic
World Health Organization . Obesity: Preventing and managing the global epidemic. report of a WHO consultation. Technical Report 894, World Health Organization, Geneva, 2000. PMID: 11234459
2000
-
[66]
Wasserstein F -tests for Fr \'e chet regression on Bures -- Wasserstein manifolds
Haoshu Xu and Hongzhe Li. Wasserstein F -tests for Fr \'e chet regression on Bures -- Wasserstein manifolds. Journal of Machine Learning Research, 26 0 (77): 0 1--123, 2025. URL http://jmlr.org/papers/v26/24-0493.html
2025
-
[67]
Yang Claire Yang, Christine E. Walsh, Moira P. Johnson, Daniel W. Belsky, Max Reason, Patrick Curran, Allison E. Aiello, Marianne Chanti-Ketterl, and Kathleen Mullan Harris. Life-course trajectories of body mass index from adolescence to old age: racial and educational disparities. Proceedings of the National Academy of Sciences, 118 0 (17): 0 e2020167118...
-
[68]
Yoav Zemel and Victor M. Panaretos. Fr \'e chet means and Procrustes analysis in Wasserstein space. Bernoulli, 25 0 (2): 0 932--976, 2019. doi:10.3150/17-BEJ1009
discussion (0)
Sign in with ORCID, Apple, or X to comment. Anyone can read and Pith papers without signing in.