Evaluating the Fourier Approximation in Pulsar Timing Array Analysis
Pith reviewed 2026-06-30 04:43 UTC · model grok-4.3
The pith
The Fourier approximation overestimates marginal likelihoods for power-law spectra in pulsar timing arrays by a factor of about two on average.
A machine-rendered reading of the paper's core claim, the machinery that carries it, and where it could break.
Core claim
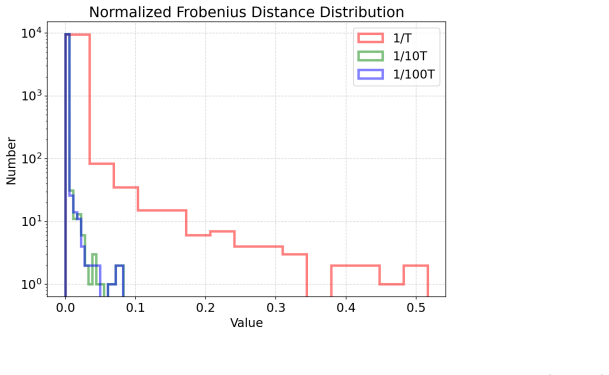
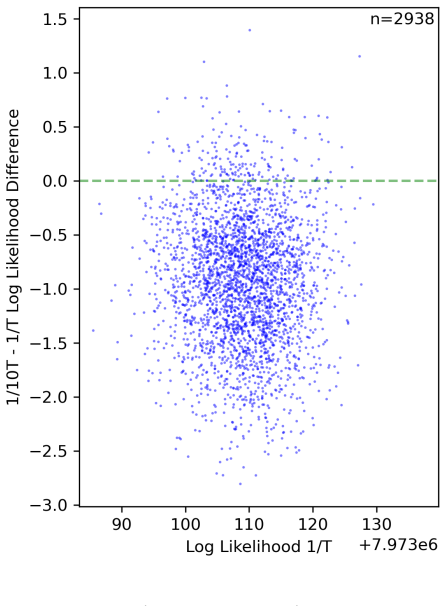
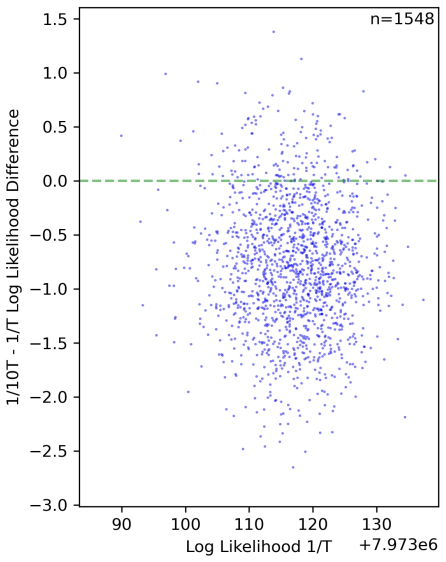
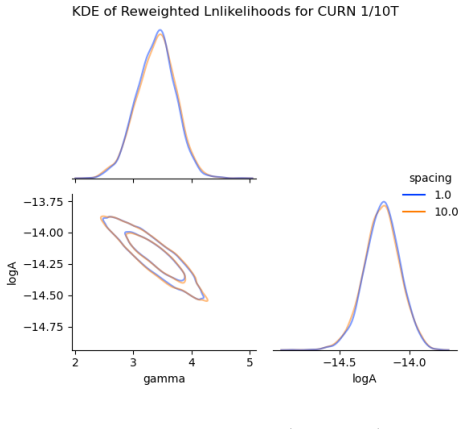
The true marginal likelihoods for power-law PSDs are on average about half as large as the likelihoods computed using the Fourier approximation. This could lead to an error of a factor of two in model comparison. However, in the important comparison of uncorrelated vs. Hellings-Downs correlated models, a very similar correction appears in both, so the model comparison is essentially unaffected. Parameter estimation results for power law PSDs show little difference between the methods. Spectra with sharper features could see larger discrepancies.
What carries the argument
The Fourier approximation, which models the stochastic signal as a sum of discrete Fourier modes whose frequencies are spaced by the inverse of the total observation time even though the actual signal is not periodic.
If this is right
- Comparisons between uncorrelated noise models and Hellings-Downs correlated models remain reliable because the approximation error affects both similarly.
- Inferred parameters such as the power-law amplitude and spectral index change little when switching from the standard Fourier method to finer frequencies.
- Analyses of spectra containing sharp features may require exact or finer-frequency methods to avoid substantially larger errors.
Where Pith is reading between the lines
- Analyses of longer or denser datasets could reveal whether the factor-of-two offset grows or shrinks with observation span.
- Similar non-periodicity effects may appear in other time-domain analyses that rely on Fourier bases for aperiodic processes.
- Adopting the finer-spacing approach as a default would increase computational cost but could be tested first on subsets of existing data.
Load-bearing premise
That calculations with more-closely spaced frequencies serve as a reliable proxy for the exact result and that the observed difference arises primarily from the non-periodicity of the true signal.
What would settle it
Direct evaluation of the exact marginal likelihood for a power-law PSD in a small simulated dataset without frequency discretization, then checking whether it matches the finer-spacing proxy.
Figures
read the original abstract
Pulsar timing arrays search for stochastic processes such as gravitational waves by comparing pulse time of arrival data for millisecond pulsars to expectations from a background with a given power spectral density (PSD). To make the analysis computationally tractable, the Bayesian likelihood is usually computed using an approximation in which the signal is taken to be a sum of Fourier modes appropriate to the total time of observation, even though the true signal is not periodic. We study the difference between likelihoods computed with this Fourier approximation method for power law spectra and those computed exactly (or using more-closely spaced frequencies as a proxy for the exact result) in the NANOGrav 15-year dataset. We find that the true marginal likelihoods for power-law PSDs are on average about half as large as the likelihoods computed using the Fourier approximation. This could lead to an error of a factor of two in model comparison. However, in the important comparison of uncorrelated vs. Hellings-Downs correlated models, a very similar correction appears in both, so the model comparison is essentially unaffected. We also compare parameter estimation results for power law PSDs, finding little difference between the methods. We briefly discuss spectra with sharper features, for which the approximation could be much worse.
Editorial analysis
A structured set of objections, weighed in public.
Referee Report
Summary. The manuscript evaluates the Fourier approximation commonly used in pulsar timing array (PTA) likelihood calculations for stochastic signals with power-law power spectral densities (PSDs). On the NANOGrav 15-year dataset, it compares marginal likelihoods obtained with the standard Fourier-mode sum (periodic over the observation span) against those computed with a finer frequency grid serving as a proxy for the exact non-periodic covariance integral. The central numerical result is that the proxy 'true' marginal likelihoods are on average roughly half as large as the Fourier-approximation values, implying a potential factor-of-two bias in model evidence; however, this bias is nearly identical for uncorrelated and Hellings-Downs correlated models, leaving their Bayes factor essentially unchanged. Parameter posteriors for power-law PSDs show little difference between the two methods, while the approximation is flagged as potentially worse for spectra with sharp features.
Significance. If the reported factor-of-two offset is robust, the work supplies a concrete, data-driven calibration of a systematic error in standard PTA pipelines. The direct numerical comparison on a public dataset is a clear strength that supports reproducibility. At the same time, the finding that the dominant science result (model comparison between uncorrelated and correlated backgrounds) is insensitive to the approximation limits the immediate practical impact on existing PTA conclusions, though it remains relevant for analyses involving non-power-law spectra or future higher-precision data.
major comments (2)
- [Methods] Methods section: The headline claim that true marginal likelihoods are 'on average about half' those from the Fourier approximation rests on treating the finer-spaced frequency grid as a faithful proxy for the exact non-periodic covariance. No explicit convergence test is presented (e.g., results for successively halved frequency spacings demonstrating that the marginal likelihood stabilizes to within a small fraction of the observed difference). Without this, the discrepancy could arise from residual discretization error rather than non-periodicity itself.
- [Results] Results section: The statement that 'a very similar correction appears in both' the uncorrelated and Hellings-Downs models (leaving model comparison unaffected) is load-bearing for the practical conclusion. The manuscript should report the actual ratio of the two Bayes factors (or the change in log-evidence) with quantitative uncertainty rather than the qualitative phrase 'essentially unaffected'.
minor comments (2)
- [Abstract] Abstract: the phrase 'on average about half as large' would be more precise if the actual mean ratio (with its standard deviation across pulsars or realizations) were stated numerically.
- Notation: the distinction between the Fourier approximation and the 'exact' (proxy) covariance should be introduced with an explicit equation for the covariance integral being approximated, to make the source of the non-periodicity clear.
Simulated Author's Rebuttal
We thank the referee for their careful reading and constructive feedback on our manuscript. We address each of the major comments below and will incorporate the suggested improvements in a revised version.
read point-by-point responses
-
Referee: [Methods] Methods section: The headline claim that true marginal likelihoods are 'on average about half' those from the Fourier approximation rests on treating the finer-spaced frequency grid as a faithful proxy for the exact non-periodic covariance. No explicit convergence test is presented (e.g., results for successively halved frequency spacings demonstrating that the marginal likelihood stabilizes to within a small fraction of the observed difference). Without this, the discrepancy could arise from residual discretization error rather than non-periodicity itself.
Authors: We agree that demonstrating convergence of the finer frequency grid is important to confirm it serves as a reliable proxy for the exact covariance. In the revised manuscript, we will add an explicit convergence test by computing the marginal likelihoods for successively halved frequency spacings and showing that the values stabilize, thereby confirming that the factor-of-two difference arises from the non-periodic nature of the signal rather than discretization effects. revision: yes
-
Referee: [Results] Results section: The statement that 'a very similar correction appears in both' the uncorrelated and Hellings-Downs models (leaving model comparison unaffected) is load-bearing for the practical conclusion. The manuscript should report the actual ratio of the two Bayes factors (or the change in log-evidence) with quantitative uncertainty rather than the qualitative phrase 'essentially unaffected'.
Authors: We concur that a quantitative assessment strengthens the conclusion. In the revised version, we will report the actual ratios of the Bayes factors (or differences in log-evidence) between the Fourier approximation and the finer-grid method for both the uncorrelated and Hellings-Downs models, including any associated uncertainties. This will demonstrate quantitatively that the model comparison remains essentially unaffected. revision: yes
Circularity Check
No significant circularity in numerical comparison study
full rationale
The paper performs a direct numerical comparison of likelihoods computed via the Fourier approximation versus a finer-frequency proxy on external NANOGrav 15-year observational data. No mathematical derivation chain exists that reduces predictions or results to fitted inputs, self-definitions, or self-citation load-bearing premises by construction. The reported factor-of-two difference is an empirical output of the computation itself, with the study self-contained against external benchmarks and no load-bearing steps matching the enumerated circularity patterns.
Axiom & Free-Parameter Ledger
axioms (2)
- domain assumption The gravitational wave background can be modeled as a stationary Gaussian stochastic process characterized by a power spectral density.
- domain assumption Marginal likelihoods computed via Bayesian methods are the appropriate quantity for model comparison.
Reference graph
Works this paper leans on
-
[1]
R. W. Hellings and G. S. Downs, Upper limits on the isotropic gravitational radiation back- ground from pulsar timing analysis, Astrophys. J.265, L39 (1983)
1983
-
[2]
G. Agazieet al.(NANOGrav), The NANOGrav 15 yr Data Set: Observations and Timing of 68 Millisecond Pulsars, Astrophys. J. Lett.951, L9 (2023), arXiv:2306.16217 [astro-ph.HE]
-
[3]
Antoniadiset al.(EPTA), The second data release from the European Pulsar Timing Array - I
J. Antoniadiset al.(EPTA), The second data release from the European Pulsar Timing Array - I. The dataset and timing analysis, Astron. Astrophys.678, A48 (2023), arXiv:2306.16224 [astro-ph.HE]
-
[4]
Zicet al., The Parkes Pulsar Timing Array third data release, Publ
A. Zicet al., The Parkes Pulsar Timing Array third data release, Publ. Astron. Soc. Austral. 40, e049 (2023), arXiv:2306.16230 [astro-ph.HE]
-
[5]
H. Xuet al., Searching for the Nano-Hertz Stochastic Gravitational Wave Background with the Chinese Pulsar Timing Array Data Release I, Res. Astron. Astrophys.23, 075024 (2023), arXiv:2306.16216 [astro-ph.HE]
work page internal anchor Pith review Pith/arXiv arXiv 2023
-
[6]
The NANOGrav 15-year Data Set: Evidence for a Gravitational-Wave Background
G. Agazieet al.(NANOGrav), The NANOGrav 15 yr Data Set: Evidence for a Gravitational- wave Background, Astrophys. J. Lett.951, L8 (2023), arXiv:2306.16213 [astro-ph.HE]. 15
work page internal anchor Pith review Pith/arXiv arXiv 2023
-
[7]
J. Antoniadiset al.(EPTA, InPTA), The second data release from the European Pulsar Timing Array - III. Search for gravitational wave signals, Astron. Astrophys.678, A50 (2023), arXiv:2306.16214 [astro-ph.HE]
work page internal anchor Pith review Pith/arXiv arXiv 2023
-
[8]
D. J. Reardonet al., Search for an Isotropic Gravitational-wave Background with the Parkes Pulsar Timing Array, Astrophys. J. Lett.951, L6 (2023), arXiv:2306.16215 [astro-ph.HE]
work page internal anchor Pith review Pith/arXiv arXiv 2023
-
[9]
Hyper-efficient model-independent Bayesian method for the analysis of pulsar timing data
L. Lentati, P. Alexander, M. P. Hobson, S. Taylor, J. Gair, S. T. Balan, and R. van Haasteren, Hyper-efficient model-independent Bayesian method for the analysis of pulsar timing data, Phys. Rev. D87, 104021 (2013), arXiv:1210.3578 [astro-ph.IM]
work page internal anchor Pith review Pith/arXiv arXiv 2013
-
[10]
van Haasteren and M
R. van Haasteren and M. Vallisneri, Low-rank approximations for large stationary covariance matrices, as used in the bayesian and generalized-least-squares analysis of pulsar-timing data, Monthly Notices of the Royal Astronomical Society446, 1170 (2014)
2014
-
[11]
On measuring the gravitational-wave background using Pulsar Timing Arrays
R. van Haasteren, Y. Levin, P. McDonald, and T. Lu, On measuring the gravitational-wave background using Pulsar Timing Arrays, Mon. Not. Roy. Astron. Soc.395, 1005 (2009), arXiv:0809.0791 [astro-ph]
work page internal anchor Pith review Pith/arXiv arXiv 2009
-
[12]
van Haasteren and Y
R. van Haasteren and Y. Levin, Understanding and analysing time-correlated stochastic signals in pulsar timing, Monthly Notices of the Royal Astronomical Society428, 1147 (2012)
2012
-
[13]
R. T. Edwards, G. B. Hobbs, and R. N. Manchester, Tempo2, a new pulsar timing package
-
[14]
The timing model and precision estimates, Mon. Not. Roy. Astron. Soc.372, 1549 (2006), arXiv:astro-ph/0607664
work page internal anchor Pith review Pith/arXiv arXiv 2006
-
[15]
E. Payne, C. Talbot, and E. Thrane, Higher order gravitational-wave modes with likelihood reweighting, Physical Review D100, 10.1103/physrevd.100.123017 (2019)
-
[16]
S. Hourihane, P. Meyers, A. Johnson, K. Chatziioannou, and M. Vallisneri, Accurate char- acterization of the stochastic gravitational-wave background with pulsar timing arrays by likelihood reweighting, Physical Review D107, 10.1103/physrevd.107.084045 (2023)
-
[17]
W. Xie, P. O. Lewis, Y. Fan, L. Kuo, and M.-H. Chen, Improving marginal likelihood estimation for bayesian phylogenetic model selection, Systematic Biology60, 150 (2011), https://academic.oup.com/sysbio/article-pdf/60/2/150/24552358/syq085.pdf. 16
2011
discussion (0)
Sign in with ORCID, Apple, or X to comment. Anyone can read and Pith papers without signing in.