REVIEW 4 major objections 4 minor 16 references
Detecting abnormalities in resting-state dynamics: An unsupervised learning approach
T0 review · 4 major / 4 minor · reviewed 2026-08-14 · deepseek-v4-flash
Pith's one-line read Unsupervised models trained only on healthy resting-state scans flag autism from reconstruction and next-frame prediction errors.
desk verdict A clean, well-built application of unsupervised video anomaly detection to rs-fMRI, but the ASD-control discrimination claim is not yet established because the two test groups are not matched or adjusted for obvious confounds. read the letter →
The pith
A machine-rendered reading of the paper's core claim, the machinery that carries it, and where it could break.
The reading
What carries the argument
The load-bearing object is the anomaly score: the mean squared error between the model's output and the observed rs-fMRI frames. The models are encoder-decoder networks built on Conv-LSTM cells, meaning LSTM units extended to operate on spatial feature maps, so they propagate both spatial and temporal structure. A U-Net-style decoder with skip connections performs next-frame prediction, while a similar network without skip connections reconstructs the whole sequence; both are trained end-to-end on healthy controls only. At test time, a subject whose error is high relative to the healthy distribution is flagged as an outlier.
What would settle it
Compute the error-based discrimination AUC in a validation sample where patients and controls are matched on age, sex, IQ, and medication status, or after explicitly regressing those covariates out of the error scores; if the AUC drops to chance, the claim that the anomaly score captures disease-specific abnormalities is refuted.
Extended reading notes
Core claim
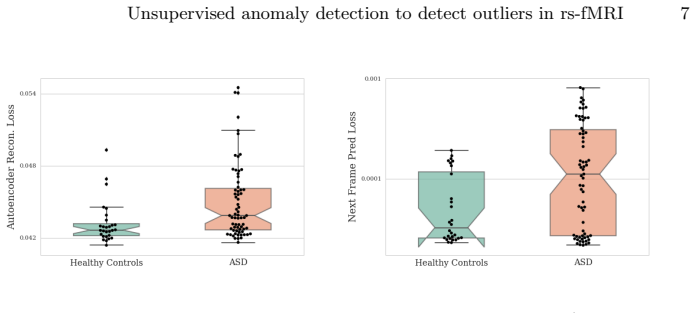
The paper's central claim is that deviations from learned normal resting-state dynamics, measured as reconstruction or next-frame prediction error, carry diagnostic signal: in the ABIDE NYU cohort, both the recurrent autoencoder (AUC 69.6%) and the recurrent U-Net imputation model (AUC 65.9%) separate autism patients from healthy controls with statistical significance, while a non-recurrent U-Net gives weaker separation. The error maps localize significant group differences mainly to left-hemisphere temporal and frontal regions, consistent with prior reports on language-network involvement in autism.
Load-bearing premise
The higher error in patients reflects disease-related neural dynamics rather than unmeasured differences between the groups, such as age, sex, IQ, medication, or residual motion, because the clinical groups are not matched on these variables.
Editorial extensions
If this is right
- A scan can be scored without any patient labels, which matters for conditions where labeled cohorts are small.
- Voxel-level error maps can point to the anatomical location of atypical dynamics, generating hypotheses about affected networks.
- The lack of correlation between frame-wise displacement and error suggests the anomaly signal is not simply residual motion.
- These unsupervised error features could be combined with static connectivity measures to push classification accuracy beyond either alone.
- The same framework could be reused for frame imputation, to fill in volumes removed by motion scrubbing.
Reading between the lines
- If the approach works for autism because of atypical temporal dynamics, it should transfer to other disorders with dynamic connectivity alterations, such as schizophrenia or depression; testing on a second diagnostic group would show whether the anomaly score is a general atypicality detector or autism-specific.
- Frame-level prediction errors could be used to time-stamp transient abnormalities that static connectivity averages away, offering a per-volume diagnostic marker.
- The fact that reconstruction error produces a higher AUC than next-frame prediction suggests that memorizing normal dynamics may be a stronger anomaly detector than forecasting them, a hypothesis the paper does not explicitly test.
Signed reviews
Editorial analysis
A structured set of objections, weighed in public.
Referee Report
Summary. This paper proposes two unsupervised deep-learning models for resting-state fMRI: a recurrent autoencoder that reconstructs a sequence of T=20 axial slices, and a Conv-LSTM-based recurrent U-Net that predicts the next frame. The models are trained on 54 healthy controls from the NYU ABIDE site, applied to 28 held-out controls and 67 ASD patients, and a single whole-gray-matter mean squared error per subject is used as an abnormality score. The authors report that both models yield higher errors in ASD than controls, with AUCs of 69.6 (autoencoder), 62.5 (U-Net imputation), and 65.9 (recurrent U-Net imputation), and they claim this is close to supervised state-of-the-art results. They also present a regional analysis of reconstruction-error differences. The manuscript does not include a covariate-adjusted group comparison, confidence intervals, or repeated-split validation.
Significance. The core idea is interesting and the modeling is technically sound: training on healthy controls only and measuring reconstruction/prediction error as a label-free abnormality score avoids circularity, since the score is a function of the input alone. The architectural comparison against last-frame, spline, and non-recurrent baselines is a strength, and the predictive performance (Pearson correlation 0.999 for the recurrent U-Net) indicates the model genuinely captures rs-fMRI dynamics. If the ASD-control discrimination survived confound adjustment and replicated across splits, the approach would be a meaningful contribution to unsupervised biomarker discovery. In its current form, however, the empirical support for the central claim is weakened by unadjusted group differences and single-split statistics.
major comments (4)
- [Section 4.2, Table 3] The central claim that reconstruction/prediction error can discriminate ASD from controls is not yet established because the control and ASD test groups are not shown to be matched on age, sex, IQ, medication, or residual motion/scan quality, and no covariate adjustment is performed in the group comparison. The only confound check reported is correlation with framewise displacement; one of the two frame-level correlations is nominally significant (p=0.0251), so the text's statement that there is no correlation is not supported. A covariate-adjusted analysis (e.g., regressing subject-level error on group plus these confounds) or a matched-subgroup comparison is required.
- [Section 3.1, Section 4.2] Because the subject-level anomaly score is a single mean squared error averaged over the whole gray-matter mask and over all retained frames, any systematic between-group difference in signal variance, number of frames retained after scrubbing, or preprocessing residual will masquerade as an abnormality even in the absence of disease-specific dynamics. The manuscript does not report these quantities separately for the two groups; please report the distributions of gray-matter signal variance, frame counts after scrubbing, and mean framewise displacement by group, and include them as covariates in the discrimination analysis.
- [Section 3.1, Table 3] The evaluation relies on a single random two-thirds/one-thirds split with only 28 healthy controls in the test set, and the reported p-values are from unpaired t-tests on the error metric rather than tests of the AUC. No confidence intervals, bootstrap resampling, or repeated-split/permutation analysis is provided, so the stability of the AUC values (69.6, 62.5, 65.9) is unknown. Please report bootstrap confidence intervals for the AUCs and a proper AUC significance test (e.g., DeLong or permutation), and ideally repeat the split several times.
- [Section 3.2, Table 2] The sequence length T=20 was selected after observing diminishing returns in prediction performance and then fixed for the autoencoder, so the subsequent p-values and AUCs in Table 3 do not account for this model-selection step. Please report the sensitivity of the discrimination results to T, or define a validation-based selection rule before computing the test statistics.
minor comments (4)
- [Section 3.1] The random split into training/validation/test is described without a seed or code release, so the reported numbers are not reproducible as stated; please specify the split procedure and seed.
- [Section 3.2] The statement that 'validation curves were monitored to ensure convergence' does not specify the early-stopping rule; please state the exact criterion used.
- [Discussion] The comparison of AUC values with supervised results from [1] is indirect because the studies use different sites, preprocessing, and evaluation protocols; please qualify the comparison explicitly.
- [Figure 3] The regional significance map would be easier to interpret with a colorbar and an explicit statement of the FDR threshold applied; also clarify whether the t-test was two-sided.
Circularity Check
No significant circularity: the anomaly score is an unsupervised function of the input, and the ASD/control comparison is an external evaluation, not a fitted target.
full rationale
The central claim is that a recurrent autoencoder and a next-frame prediction model, trained only on healthy controls, produce mean squared error values that differ significantly between ASD patients and controls and yield an AUC of about 70%. This is an empirical evaluation, not a derivation from the model's definition. The subject-level score is a function of the input scan and a model trained without labels; group labels are used only in the downstream statistical comparison and ROC analysis. No equation in the paper defines the reported AUC or group difference in terms of the training objective, and no fitted parameter is renamed as a prediction. The only self-citation is reference [2], a review by the authors, used for broad context about machine learning in rs-fMRI analysis; it is not load-bearing and no theorem or normative constraint is imported from it. The paper's main result is also checked against external baselines and an external supervised benchmark [1]. A residual concern about group mismatch on unmeasured confounds such as age, sex, IQ, medication, or residual motion is a validity/correctness issue, not a circularity issue, because the authors never build those confounds into the model or the score. The paper therefore exhibits no circular derivation step.
Assumptions & free parameters
free parameters (2)
- Sequence length T =
20
- Architecture hyperparameters (filter counts, layer depths, kernel sizes) =
Not specified in paper
assumptions (4)
- domain assumption Reconstruction or prediction error is a valid indicator of clinical abnormality.
- domain assumption The healthy training sample is representative of normal resting-state dynamics.
- domain assumption The ASD and control test groups are comparable except for diagnosis.
- standard math Deep learning training with L2 loss and Adam converges to a useful representation.
Cite this review
Pith. "Pith review of Detecting abnormalities in resting-state dynamics: An unsupervised learning approach." pith.science (2026). https://pith.science/paper/XPRNHKPG
@misc{pith2026190806168,
  author       = {Pith},
  title        = {Pith review of: Detecting abnormalities in resting-state dynamics: An unsupervised learning approach},
  year         = {2026},
  howpublished = {\url{https://pith.science/paper/XPRNHKPG}},
  note         = {Machine review of arXiv:1908.06168}
}
read the original abstract
Resting-state functional MRI (rs-fMRI) is a rich imaging modality that captures spontaneous brain activity patterns, revealing clues about the connectomic organization of the human brain. While many rs-fMRI studies have focused on static measures of functional connectivity, there has been a recent surge in examining the temporal patterns in these data. In this paper, we explore two strategies for capturing the normal variability in resting-state activity across a healthy population: (a) an autoencoder approach on the rs-fMRI sequence, and (b) a next frame prediction strategy. We show that both approaches can learn useful representations of rs-fMRI data and demonstrate their novel application for abnormality detection in the context of discriminating autism patients from healthy controls.
Figures


Reference graph
Works this paper leans on
-
[1]
Deriving reproducible biomarkers from multi-site resting-state data: an autism-based example
Abraham et al. Deriving reproducible biomarkers from multi-site resting-state data: an autism-based example. NeuroImage, 147:736–745, 2017
work page 2017
-
[2]
Machine learning in resting-state fMRI analysis
Khosla et al. Machine learning in resting-state fmri analysis. arXiv preprint arXiv:1812.11477, 2018
work page Pith review arXiv 2018
-
[3]
Lisa T Eyler et al. A failure of left temporal cortex to specialize for language is an early emerging and fundamental property of autism. Brain, 135(3):949–960, 2012
work page 2012
-
[4]
Learning temporal regularity in video sequences
Mahmudul Hasan et al. Learning temporal regularity in video sequences. IEEE Conference on Computer Vision and Pattern Recognition (CVPR) , 2016
work page 2016
-
[5]
Long short-term memory.Neural com- putation, 9(8):1735–1780, 1997
Sepp Hochreiter and J¨ urgen Schmidhuber. Long short-term memory.Neural com- putation, 9(8):1735–1780, 1997
work page 1997
-
[6]
Imagenet classification with deep convolutional neural networks
Alex Krizhevsky et al. Imagenet classification with deep convolutional neural networks. In Advances in neural information processing systems , 2012
work page 2012
-
[7]
Jin Liu et al. Chronnectome fingerprinting: identifying individuals and predicting higher cognitive functions using dynamic brain connectivity patterns.Human brain mapping, 39(2):902–915, 2018
work page 2018
-
[8]
Future frame prediction for anomaly detection - a new baseline
Wen Liu et al. Future frame prediction for anomaly detection - a new baseline. 2018 IEEE/CVF Conference on Computer Vision and Pattern Recognition , 2018
work page 2018
Show all 16 references
-
[9]
The autism brain imaging data exchange:towards a large-scale evaluation of intrinsic brain architecture in autism
Di Martino et al. The autism brain imaging data exchange:towards a large-scale evaluation of intrinsic brain architecture in autism. Molecular psychiatry, 2014
2014
-
[10]
U-net: Convolutional networks for biomedical image seg- mentation
Olaf Ronneberger et al. U-net: Convolutional networks for biomedical image seg- mentation. In MICCAI, 2015
2015
-
[11]
Convolutional lstm network: A machine learning approach for precipitation nowcasting
Xingjian Shi et al. Convolutional lstm network: A machine learning approach for precipitation nowcasting. In NIPS, 2015
2015
-
[12]
Salakhutdinov
Nitish Srivastava, Elman Mansimov, and Ruslan R. Salakhutdinov. Unsupervised learning of video representations using lstms. In ICML, 2015. Unsupervised anomaly detection to detect outliers in rs-fMRI 9
2015
-
[13]
A hybrid of deep network and hidden markov model for mci identification with resting-state fmri
Heung-Il Suk et al. A hybrid of deep network and hidden markov model for mci identification with resting-state fmri. In MICCAI, 2015
2015
-
[14]
Changes in dynamic functional connections with aging
Lixia Tian et al. Changes in dynamic functional connections with aging. Neuroim- age, 172:31–39, 2018
2018
-
[15]
Tzourio-Mazoyer et al
N. Tzourio-Mazoyer et al. Automated anatomical labeling of activations in spm using a macroscopic anatomical parcellation of the mni mri single-subject brain. NeuroImage, 15(1), 2002
2002
-
[16]
L. L. Zeng et al. Unsupervised classification of major depression using functional connectivity MRI. Hum Brain Mapp , 35(4):1630–1641, Apr 2014
2014
Reviewed August 14, 2026 · model on record in the stance chip above.
Discussion (0). Continue with ORCID to comment.