REVIEW 3 major objections 5 minor 1 cited by
Do Echo Top Heights Improve Deep Learning Nowcasts?
T0 review · 3 major / 5 minor · reviewed 2026-08-06 · deepseek-v4-flash
Pith's one-line read Adding echo top height to radar nowcasts helps only for the lightest rain.
desk verdict A careful, well-scoped empirical null result on adding echo top height to a deterministic nowcaster; the negative conclusion is broadly supported, but the filtered single-year test set and missing uncertainty estimates keep it from being the last word. read the letter →
The pith
A machine-rendered reading of the paper's core claim, the machinery that carries it, and where it could break.
The reading
What carries the argument
The central object is echo top height (ETH), a two-dimensional field giving, at each grid point, the maximum altitude at which the radar detects reflectivity above a 7 dBZ threshold; it is a compact stand-in for the vertical extent of precipitation. The architecture that carries the argument is a single-pass 3D U-Net (an encoder–decoder convolutional network with skip connections) that treats time as the third dimension and takes radar reflectivity and ETH as separate input channels, predicting 18 future frames in one forward pass to avoid recursive bias accumulation. The evaluation machinery is a set of verification scores — MSE, MAE and mean error, precision/recall/ETS at four thresholds, and Fractions Skill Score at five thresholds and three spatial scales — chosen so that any genuine reduction in nowcast uncertainty from ETH should show up as less blurring and better spatial skill.
What would settle it
Evaluate the same with- and without-ETH comparison on a multi-year test set that includes widespread moderate-rain events, or retrain on a sample not truncated to the top 1000 reflectivity frames per year; if ETH models then beat no-ETH models on Equitable Threat Score at 1 mm/h or 2.5 mm/h without a more negative mean error, the paper's negative verdict would be overturned.
Extended reading notes
Core claim
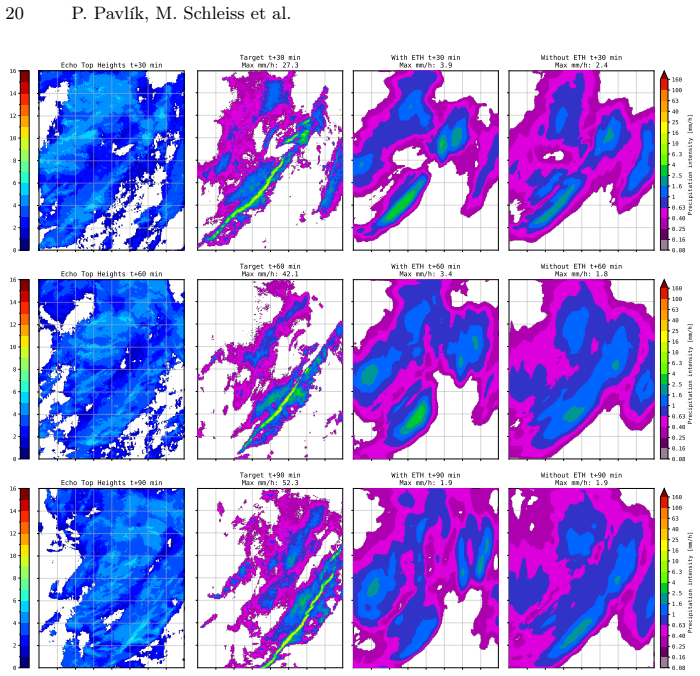
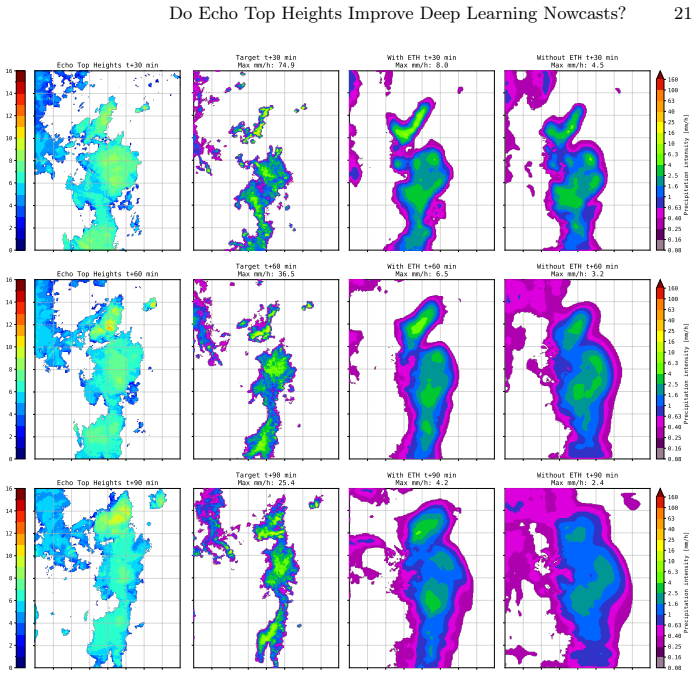
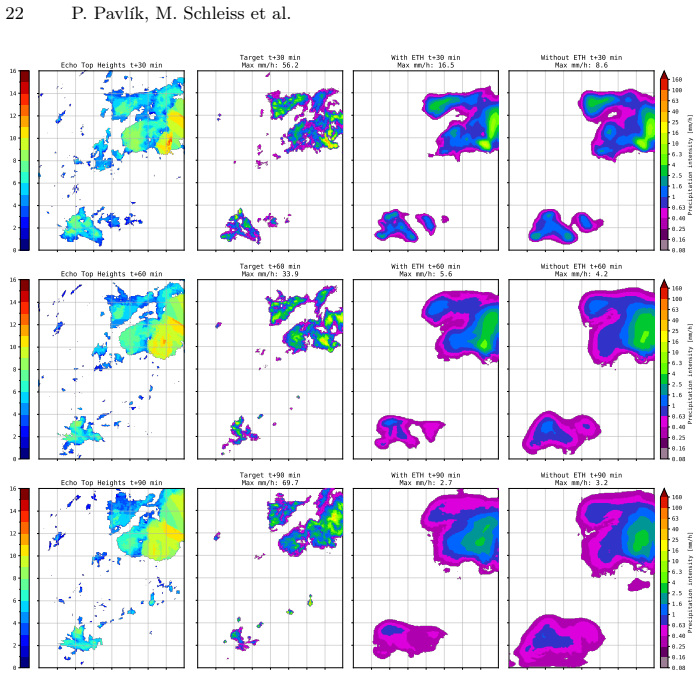
The central claim is that, on this dataset and architecture, echo top height does not provide convincing proof-of-concept value for precipitation nowcasting. Models given ETH as a separate input channel achieve higher Fractions Skill Score and Equitable Threat Score only at the lowest rain-rate threshold (0.1 mm/h) and at short lead times; at thresholds of 1 mm/h and above, the two configurations score similarly, with the no-ETH models slightly ahead on ETS. The ETH models also show larger run-to-run variance and a more negative mean error, meaning they tend to predict less rain than observed. Three case studies show the effect is event-dependent: ETH helps when the storm has high echo tops, but hurts or confuses the model when rainfall is intense yet echo tops are low, and the added input can amplify error variance even when average error improves.
Load-bearing premise
The result assumes that the curated sample — roughly the top 1000 events per year by summed reflectivity, restricted to the post-2016 radar period, cropped to where 7 km echo tops are detectable, with 2022 as the only test year — fairly represents the range of rainfall intensities where ETH could matter.
Editorial extensions
If this is right
- Adding ETH as an extra channel is technically feasible in a 3D U-Net and slightly improves detection of very light rain (0.1 mm/h), especially at short lead times.
- At rain rates of 1 mm/h and above, ETH does not improve Fractions Skill Score or Equitable Threat Score; at higher thresholds the no-ETH models are equal or better.
- ETH inputs systematically increase the negative bias (mean error), so flood- and warning-oriented applications would see more underestimated intensities.
- The effect of ETH is case-dependent: it can preserve intensity and reduce blurring when echo tops are high, but can degrade forecasts when intense rain is accompanied by low echo tops.
- A deterministic U-Net with a pointwise loss is a workable diagnostic benchmark for testing auxiliary variables, but the paper argues that generative or probabilistic approaches and better ETH preprocessing may be needed to unlock ETH's potential.
Reading between the lines
- A natural next test is to stratify the test set by observed echo top height; the case studies suggest ETH helps in high-ETH convection, so a conditioned evaluation might show positive skill that the aggregate metrics hide.
- The negative bias may be a side effect of the pointwise MSE loss combined with an extra input that correlates with but does not uniquely determine surface rain; an architecture that decouples intensity from occurrence, or a loss that penalizes underestimation asymmetrically, might change the balance.
- Because the radar system changed in 2016 and the test year is a single year, the result is a snapshot of one country's radar regime; transfer to other climates or radar networks could plausibly reverse the verdict.
- ETH artifacts from the radar sweep geometry (circular bands) are visible even in the cropped domain; cleaning these artifacts by masking unreliable pixels is a cheap preprocessing fix that could alter the comparison.
Editorial analysis
A structured set of objections, weighed in public.
Referee Report
Summary. The paper investigates whether adding echo top height (ETH) as an auxiliary input channel to a deterministic 3D U-Net improves radar-based precipitation nowcasting in the Netherlands. The authors compare eight models trained with ETH and eight without, using pixel-wise metrics (MSE, MAE, ME), threshold-based metrics (precision, recall, ETS), the Fractions Skill Score (FSS), and three qualitative case studies. The central finding is that ETH improves skill only at the lowest rain-rate threshold (0.1 mm/h), does not improve high-intensity nowcasts, and introduces an additional negative bias, leading the authors to conclude that ETH does not provide convincing proof-of-concept evidence for nowcasting. The paper includes code links, animations, and a candid discussion of limitations.
Significance. If the result holds, it is a useful and reproducible negative result for the nowcasting community: it suggests that naively adding ETH as an input channel is insufficient, and it provides a benchmark for future work on auxiliary radar-derived variables. The paper deserves credit for training multiple models under different seeds and data splits, for reporting multi-scale FSS along with threshold metrics, and for making code and visualizations publicly available. The negative-bias finding and the case-specific behavior are also of operational interest. The main limitations, as discussed in the report, concern the dataset construction and the lack of uncertainty quantification, which weaken the strength of the null conclusion.
major comments (3)
- [§4.1] The dataset description is internally inconsistent about the training sample size: selecting the top-1000 observations per year for 2008–2022 gives 15,000 starting points, but the text then restricts training to data from October 2016 onward, which would leave roughly 6,000 starting points. Please clarify whether the 15,000 figure includes pre-2016 data and how the restriction was applied. This matters because the composition of the training set and the representativeness of the 2022-only test set are load-bearing for the paper's null claim.
- [§5.1 and §5.2] The central null claim rests on comparisons of MSE, MAE, ME, and ETS between the two model groups, but no statistical significance tests or confidence intervals are reported. Given that the paper concludes that ETH 'introduced an additional negative bias' and is 'detrimental' at higher intensities, the authors should provide paired bootstrap or permutation tests across the eight model pairs (or across events) for the key metrics. Without such tests, the reported mean differences—many of which are small relative to the standard deviations in Figures 5 and 7—cannot be distinguished from sampling noise.
- [§5.3] The FSS matrices in Figure 8 show essentially zero scores at thresholds of 5 and 10 mm/h for both configurations at all lead times. The statement that ETH does not improve spatial predictive skill for heavier rainfall is therefore based on a near-floor comparison in which the observed fields contain very few positive pixels; this does not robustly support the conclusion. Please either restrict the high-threshold FSS analysis to events with meaningful rain coverage, supplement it with a metric that remains interpretable at low base rates, or explicitly quantify the uncertainty on the zero and near-zero differences.
minor comments (5)
- [§5] In the first paragraph of Section 5, 'Ta gain additional insight' should read 'To gain additional insight'.
- [§3.1] In the final paragraph of Section 3.1, 'it it is possible' should read 'it is possible'.
- [§4] In the first paragraph of Section 4, 'for it's simplicity' should read 'for its simplicity'.
- [§5.4] In the paragraph introducing the case studies, 'with a without ETH' should read 'with and without ETH', and 'ploted' should be 'plotted'.
- [Figures 5–7] The green/red color scheme used for the two model groups is difficult to distinguish for color-blind readers; consider using more separable colors or line styles.
Circularity Check
Empirical ablation study with no derivation chain; all skill differences are measured outcomes, so no circularity.
full rationale
This paper is an empirical comparison, not a derivation: the central question is whether adding echo top height (ETH) as an extra input channel to a 3D U-Net improves precipitation nowcasts. The claimed results—modest gains at 0.1 mm/h, similar MSE, more negative ME, and lower ETS at higher thresholds—are directly measured on a held-out 2022 test set, not derived from fitted constants or from the definition of ETH. The model is trained with and without ETH under identical splits and seeds, so the comparison is self-contained and apples-to-apples. Section 4.1's dataset construction (top-1000 reflectivity-ranked events, post-2016 data, cropped domain) is a sampling choice that could affect external validity or statistical power, but it does not make the ETH comparison circular; both model groups see the same samples. Section 3's scatter plots describing the ETH-reflectivity relationship are descriptive, not a derived prediction. The only self-citations are reference [16] (earlier volumetric nowcasting work) and reference [15] (a Delft thesis supervised by a co-author, used for clutter removal); both are motivational or methodological and neither carries the paper's central claim. There is no fitted parameter renamed as a prediction, no uniqueness theorem imported from the authors, and no ansatz smuggled in via citation. Consequently, there is no equation-level or definition-level circularity, and the paper's negative conclusion stands as a measured empirical outcome rather than a construction of its inputs.
Assumptions & free parameters
free parameters (5)
- Annual top-N event selection =
1000 observations per year
- Spatial crop extent =
336 x 272 km
- ETH reflectivity threshold =
7 dBZ
- Rain-rate thresholds for metrics =
0.1, 1, 2.5, 5, 10 mm/h
- Case-study model selection =
best FSS at 2.5 mm/h, 16 km, 30 min
assumptions (4)
- domain assumption Post-October 2016 ETH data are internally consistent after the KNMI radar replacement.
- domain assumption Marshall-Palmer Z-R relation converts reflectivity to rainfall rate.
- ad hoc to paper The top-1000-per-year subset represents the rain events a nowcaster must handle.
- domain assumption A deterministic 3D U-Net with MSE loss is an adequate testbed for detecting ETH value.
Cite this review
Pith. "Pith review of Do Echo Top Heights Improve Deep Learning Nowcasts?." pith.science (2026). https://pith.science/paper/Y3X43SRS
@misc{pith2026250700845,
  author       = {Pith},
  title        = {Pith review of: Do Echo Top Heights Improve Deep Learning Nowcasts?},
  year         = {2026},
  howpublished = {\url{https://pith.science/paper/Y3X43SRS}},
  note         = {Machine review of arXiv:2507.00845}
}
read the original abstract
Precipitation nowcasting -- the short-term prediction of rainfall using recent radar observations -- is critical for weather-sensitive sectors such as transportation, agriculture, and disaster mitigation. While recent deep learning models have shown promise in improving nowcasting skill, most approaches rely solely on 2D radar reflectivity fields, discarding valuable vertical information available in the full 3D radar volume. In this work, we explore the use of Echo Top Height (ETH), a 2D projection indicating the maximum altitude of radar reflectivity above a given threshold, as an auxiliary input variable for deep learning-based nowcasting. We examine the relationship between ETH and radar reflectivity, confirming its relevance for predicting rainfall intensity. We implement a single-pass 3D U-Net that processes both the radar reflectivity and ETH as separate input channels. While our models are able to leverage ETH to improve skill at low rain-rate thresholds, results are inconsistent at higher intensities and the models with ETH systematically underestimate precipitation intensity. Three case studies are used to illustrate how ETH can help in some cases, but also confuse the models and increase the error variance. Nonetheless, the study serves as a foundation for critically assessing the potential contribution of additional variables to nowcasting performance.
Figures


Figures from the paper (8 more)


Forward citations
Cited by 1 Pith paper
-
York's Cavity Formalism and Quantum Modified Thermodynamics of (2+1)D Black Holes
The paper claims Barrow entropy corrections reshape BTZ black hole thermodynamics in a cavity, but the free energy analysis rests on a wrong extrinsic curvature term and an incorrect zero-crossing interpretation.
Reference graph
Works this paper leans on
-
[1]
0: a convolutional neural net- work for radar-based precipitation nowcasting
Ayzel, G., Scheffer, T., Heistermann, M.: Rainnet v1. 0: a convolutional neural net- work for radar-based precipitation nowcasting. Geoscientific Model Development 13(6), 2631–2644 (2020)
work page 2020
-
[2]
Bowler, N.E., Pierce, C.E., Seed, A.W.: Steps: A probabilistic precipitation fore- casting scheme which merges an extrapolation nowcast with downscaled nwp. Quarterly Journal of the Royal Meteorological Society: A journal of the atmo- spheric sciences, applied meteorology and physical oceanography132(620), 2127– 2155 (2006)
work page 2006
-
[3]
https://www.tudelft.nl/dhpc/ark:/44463/DelftBluePhase2 (2024)
Delft High Performance Computing Centre (DHPC): DelftBlue Supercomputer (Phase 2). https://www.tudelft.nl/dhpc/ark:/44463/DelftBluePhase2 (2024)
work page 2024
-
[4]
Journal of atmospheric and oceanic tech- nology 10(6), 785–797 (1993)
Dixon, M., Wiener, G.: Titan: Thunderstorm identification, tracking, analysis, and nowcasting—a radar-based methodology. Journal of atmospheric and oceanic tech- nology 10(6), 785–797 (1993)
work page 1993
-
[5]
Nature communications13(1), 1–10 (2022)
Espeholt,L.,Agrawal,S.,Sønderby,C.,Kumar,M.,Heek,J.,Bromberg,C.,Gazen, C., Carver, R., Andrychowicz, M., Hickey, J., et al.: Deep learning for twelve hour precipitation forecasts. Nature communications13(1), 1–10 (2022)
work page 2022
-
[6]
arXiv preprint arXiv:2402.04290 (2024)
Gong, J., Bai, L., Ye, P., Xu, W., Liu, N., Dai, J., Yang, X., Ouyang, W.: Cascast: Skillful high-resolution precipitation nowcasting via cascaded modelling. arXiv preprint arXiv:2402.04290 (2024)
arXiv 2024
-
[7]
Weather and Forecasting30(5), 1201–1217 (2015)
Hwang, Y., Clark, A.J., Lakshmanan, V., Koch, S.E.: Improved nowcasts by blend- ing extrapolation and model forecasts. Weather and Forecasting30(5), 1201–1217 (2015)
work page 2015
-
[8]
Weather and Forecasting 24(5), 1297 – 1308 (2009)
Keil, C., Craig, G.C.: A displacement and amplitude score employing an op- tical flow technique. Weather and Forecasting 24(5), 1297 – 1308 (2009). https://doi.org/10.1175/2009WAF2222247.1, https://journals.ametsoc.org/view/ journals/wefo/24/5/2009waf2222247_1.xml
Show all 28 references
-
[9]
https://dataplatform
Koninklijk Nederlands Meteorologisch Instituut (KNMI): Precipitation - radar 5 minute echo top height composites over the netherlands. https://dataplatform. knmi.nl/dataset/radar-echotopheight-5min-1-0 (2024). https://doi.org/urn:xkdc: ds:nl.knmi::radar_echotopheight_5min/1.0/...
2024
-
[10]
knmi.nl/dataset/radar-tar-refl-composites-1-0 (2024)
Koninklijk Nederlands Meteorologisch Instituut (KNMI): Precipitation - radar 5 minutereflectivitycompositesoverthenetherlands-archive.https://dataplatform. knmi.nl/dataset/radar-tar-refl-composites-1-0 (2024). https://doi.org/urn:xkdc: ds:nl.knmi::radar_tar_refl_composites/1.0...
2024
-
[11]
Journal of applied meteorology and climatology 34(6), 1286–1300 (1995) Do Echo Top Heights Improve Deep Learning Nowcasts? 25
Li, L., Schmid, W., Joss, J.: Nowcasting of motion and growth of precipitation with radar over a complex orography. Journal of applied meteorology and climatology 34(6), 1286–1300 (1995) Do Echo Top Heights Improve Deep Learning Nowcasts? 25
1995
-
[12]
Hydrology and Earth System Sciences17(8), 3095–3110 (2013)
Liu, J., Bray, M., Han, D.: A study on wrf radar data assimilation for hydrological rainfall prediction. Hydrology and Earth System Sciences17(8), 3095–3110 (2013)
2013
-
[13]
Jour- nal of Atmospheric Sciences 5(4), 165 – 166 (1948)
Marshall, J.S., Palmer, W.M.K.: The distribution of raindrops with size. Jour- nal of Atmospheric Sciences 5(4), 165 – 166 (1948). https://doi.org/10.1175/ 1520-0469(1948)005<0165:TDORWS>2.0.CO;2
1948
-
[14]
Organization, W.M.: Guidelines for Nowcasting Techniques. No. 978-92-63-11198- 2, World Meteorological Organization, 7 bis, avenue de la Paix, P.O. Box 2300, CH-1211 Geneva 2, Switzerland (2017)
2017
-
[15]
van Os, S.: Precipitation Nowcasting using a Generative Adversarial Network. Master’s thesis, Delft University of Technology, Faculty of Civil Engineering & Geosciences (2024), http://resolver.tudelft.nl/uuid: 35a11963-4524-442f-97a1-016694b3813f, mentor: M.A. Schleiss
2024
-
[16]
In: CD- CEO@ IJCAI
Pavlík, P., Rozinajová, V., Ezzeddine, A.B.: Radar-based volumetric precipitation nowcasting: A 3d convolutional neural network with u-net architecture. In: CD- CEO@ IJCAI. pp. 65–72 (2022)
2022
-
[17]
Geoscientific Model Development12(10), 4185– 4219 (2019)
Pulkkinen, S., Nerini, D., Pérez Hortal, A.A., Velasco-Forero, C., Seed, A., Ger- mann, U., Foresti, L.: Pysteps: an open-source python library for probabilistic precipitation nowcasting (v1.0). Geoscientific Model Development12(10), 4185– 4219 (2019). https://doi.org/10.5194/...
2019 doi
-
[18]
Nature597(7878), 672–677 (2021)
Ravuri, S., Lenc, K., Willson, M., Kangin, D., Lam, R., Mirowski, P., Fitzsimons, M., Athanassiadou, M., Kashem, S., Madge, S., et al.: Skilful precipitation now- casting using deep generative models of radar. Nature597(7878), 672–677 (2021)
2021
-
[19]
Monthly Weather Review 136(1), 78–97 (2008)
Roberts, N.M., Lean, H.W.: Scale-selective verification of rainfall accumulations from high-resolution forecasts of convective events. Monthly Weather Review 136(1), 78–97 (2008)
2008
-
[20]
https: //dataplatform.knmi.nl/ (2025), https://dataplatform.knmi.nl/, accessed: 2025- 04-22
Royal Netherlands Meteorological Institute (KNMI): KNMI Data Platform. https: //dataplatform.knmi.nl/ (2025), https://dataplatform.knmi.nl/, accessed: 2025- 04-22
2025
-
[21]
Advances in neural information processing systems28 (2015)
Shi, X., Chen, Z., Wang, H., Yeung, D.Y., Wong, W.K., Woo, W.c.: Convolutional lstm network: A machine learning approach for precipitation nowcasting. Advances in neural information processing systems28 (2015)
2015
-
[22]
Advances in neural information processing systems30 (2017)
Shi, X., Gao, Z., Lausen, L., Wang, H., Yeung, D.Y., Wong, W.k., Woo, W.c.: Deep learning for precipitation nowcasting: A benchmark and a new model. Advances in neural information processing systems30 (2017)
2017
-
[23]
Bulletin of the American Meteorological Society 95(3), 409–426 (2014)
Sun, J., Xue, M., Wilson, J.W., Zawadzki, I., Ballard, S.P., Onvlee-Hooimeyer, J., Joe, P., Barker, D.M., Li, P.W., Golding, B., et al.: Use of nwp for nowcasting convective precipitation: Recent progress and challenges. Bulletin of the American Meteorological Society 95(3), 4...
2014
-
[24]
Advances in Meteorology 2018(1), 8202031 (2018)
Wu, W., Zou, H., Shan, J., Wu, S.: A dynamical z-r relationship for precipitation estimation based on radar echo-top height classification. Advances in Meteorology 2018(1), 8202031 (2018)
2018
-
[25]
Weather and Forecasting 25(4), 1235–1248 (2010)
Yang, Y.H., King, P.: Investigating the potential of using radar echo reflectivity to nowcast cloud-to-ground lightning initiation over southern ontario. Weather and Forecasting 25(4), 1235–1248 (2010)
2010
-
[26]
Science385(6707), 427–432 (2024)
Zhang, W., Zhou, T., Wu, P.: Anthropogenic amplification of precipitation variabil- ity over the past century. Science385(6707), 427–432 (2024). https://doi.org/10. 1126/science.adp0212, https://www.science.org/doi/abs/10.1126/science.adp0212
2024 doi
-
[27]
Nature pp
Zhang, Y., Long, M., Chen, K., Xing, L., Jin, R., Jordan, M.I., Wang, J.: Skilful nowcasting of extreme precipitation with nowcastnet. Nature pp. 1–7 (2023) 26 P. Pavlík, M. Schleiss et al
2023
-
[28]
Advances in Atmospheric Sciences 40(6), 1043–1057 (2023)
Zou,H.,Wu,S.,Tian,M.:Radarquantitativeprecipitationestimationbasedonthe gated recurrent unit neural network and echo-top data. Advances in Atmospheric Sciences 40(6), 1043–1057 (2023)
2023
Reviewed August 6, 2026 · model on record in the stance chip above.
Discussion (0). Sign in to comment.