REVIEW 4 major objections 4 minor 10 references
Investigating the Temporal Dynamics of Cyber Threat Intelligence
T0 review · 4 major / 4 minor · reviewed 2026-08-11 · deepseek-v4-flash
Pith's one-line read IoCs for a disclosed CVE arrive in an epidemic-like sequence: slow, spike, slow.
desk verdict Interesting descriptive data undercut by an overgeneralized epidemic claim: only one of six CVEs actually shows the slow-fast-slow pattern described in the abstract. read the letter →
The pith
A machine-rendered reading of the paper's core claim, the machinery that carries it, and where it could break.
The reading
What carries the argument
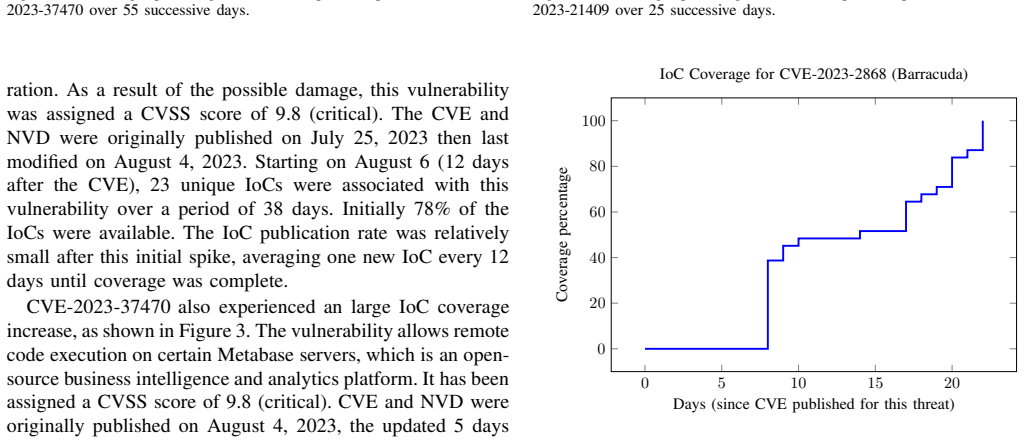
The central object is the IoC coverage curve: for a given CVE, the percentage of all known IoCs associated with that CVE that have been published by each day since the CVE was disclosed. The publication rate is the number of IoCs published per unit time, and the paper reads the shape of the coverage curve against the Susceptible-Infected-Removed (SIR) epidemic model, where the slow initial rise, sudden surge, and flattening tail correspond to susceptible, infectious, and recovered stages. The curve does the argument's work: it turns scattered feed timestamps into a single shape that can be compared across vulnerabilities.
What would settle it
Take a new critical CVE with an independent ground-truth list of indicators compiled from vendor advisories, private sandbox detections, and takedown telemetry; if the cumulative publication curve of the 16-feed union does not show a slow start, a sharp surge, and a prolonged tail for most such CVEs, or if a single early snapshot already contains nearly all indicators that ever appear, the claimed epidemic-like pattern would be contradicted.
Extended reading notes
Core claim
For each of the six CVEs studied, when the observation window starts at the CVE disclosure date ('Day 0') and runs until all known IoCs have appeared, the cumulative IoC coverage graph has three phases: sparse publication, a sharp spike, and a protracted slower tail. In examples such as MOVEit (CVE-2023-34362), the first batch was 44% of the eventual 149 IoCs, then coverage jumped to 98% within five days, and the last IoCs took another 24 days; in other cases like PaperCut the initial batch was small and the tail was steady. The paper concludes that IoC publication rates fluctuate over time and that the timing resembles the three stages of the SIR epidemic model, with the slow start matching limited exploit availability and visibility, the spike matching automated exploitation and campaigns, and the final slow phase matching maturing defenses and mitigation.
Load-bearing premise
The analysis assumes the union of IoCs from the 16 (undisclosed) providers is complete and correctly attributed to each CVE; if feeds miss indicators, misattribute them, or the observation window ends before all indicators appear, the phase boundaries and the epidemic-like shape could be artifacts of the dataset rather than properties of real-world IoC publication.
Editorial extensions
If this is right
- Defenders who take a single snapshot of an IoC feed soon after a CVE is published will systematically underestimate the indicators that will become known; coverage can jump from under half to near-complete within days.
- Because the tail phase can last weeks, blocks and detection rules should be refreshed on a schedule that extends well past the CVE disclosure date, not just at disclosure.
- The three-phase shape gives operators a rough sense of where in the vulnerability's lifecycle they are: sparse early indicators suggest exploitation and discovery are still ramping up.
- Differences in initial batch size across CVEs mean no single ingestion policy fits all vulnerabilities; some show a large early batch, while others start small and grow steadily.
Reading between the lines
- If the pattern generalizes beyond six critical CVEs, feed providers could advertise expected coverage curves per CVE, letting defenders schedule re-pulls based on time since disclosure.
- The SIR analogy suggests a quantitative model: fit a three-phase curve to early IoC timestamps and predict when a CVE's indicator set will reach saturation; the paper does not fit such a model, but its data would support one.
- The paper's reliance on the union of 16 undisclosed feeds means its phase boundaries are tied to that particular aggregation; a testable extension would be to see whether the same slow-spike-slow shape appears within individual providers' feeds, which would determine whether the pattern is a property of the threat or of the aggregation.
- IoC expiration and churn, which the paper lists as future work, could change the tail shape: if old indicators stop being observed, the effective coverage curve may peak and decline rather than simply saturating at 100%.
Editorial analysis
A structured set of objections, weighed in public.
Referee Report
Summary. This paper investigates the temporal publication of indicators of compromise (IoCs) for six critical CVEs using data from 16 threat intelligence providers whose names are withheld. For each CVE, the authors plot cumulative IoC coverage over days since disclosure and describe the resulting curves. The central claim is that IoC publication often follows an epidemic-like three-phase pattern: a sparse initial period after CVE disclosure, a sudden surge, and then a slower final phase. The paper concludes that defenders should continuously update IoC sets and suggests future work with more CVE examples.
Significance. If the claimed recurrent epidemic-like pattern were established, the practical contribution would be real: defenders would know that early IoC snapshots systematically understate eventual coverage and should expect late indicators. The paper has useful features: it uses recent high-severity CVEs, aggregates multiple commercial and open feeds, presents simple coverage curves that are easy to interpret, and does not fit the SIR model to the data, so the analogy is not circular. The main weakness is that the presented data do not actually support the pattern as a recurrent generalization: three of six cases show an initial majority of IoCs, and the analysis is purely visual, with no formal phase definitions, no statistical comparison, no baseline, and no data release.
major comments (4)
- [Abstract; Section III-A] The central claim that IoC publication follows a sparse-initial/surge/slow-tail epidemic pattern is contradicted by three of the six presented cases. For CVE-2023-35078 (Fig. 2), 78% of 23 IoCs were present at first publication; for CVE-2023-37470 (Fig. 3), 79% of 63; for CVE-2023-21409 (Fig. 4), 68% of 16. These cases have no low-rate initial phase, and two of the remaining three cases (CVE-2023-2868, Fig. 5, and CVE-2023-39143, Fig. 6) do not show the described slow-fast-slow progression. Only CVE-2023-34362 (Fig. 1) clearly matches the narrative. The abstract's 'recurring pattern' and the Section III-A generalization therefore overstate what the data show; at most 'some cases' or 'one clear case' is supported.
- [Section III-A] The three phases are never defined quantitatively. The text labels a first batch of 7 of 18 IoCs (39%) for CVE-2023-39143 as a 'relatively small initial spike,' while calling 44% for CVE-2023-34362 a low-rate initial phase, but no threshold or rate criterion separates 'sparse,' 'surge,' and 'slow tail.' Without such definitions, the epidemic-like reading is a post-hoc narrative imposed on step-function coverage curves, and the claimed recurrence cannot be independently tested.
- [Section III; Figures 1-6] The completeness and attribution of the IoC sets is load-bearing but unverifiable. The coverage denominator is 'all known IoCs related to the respective CVE' from 16 providers whose names cannot be disclosed, and the analysis stops when coverage reaches 100% for those known IoCs. If any provider misses IoCs, misattributes indicators to a CVE, or the observation window is truncated, the phase boundaries and spike sizes change. No data release or per-day aggregate counts are provided, so the central empirical result cannot be reproduced or independently checked.
- [Section IV; Section III-A] No statistical comparison or control or baseline is provided. The paper compares six observed curves to an epidemic shape by visual inspection only; it does not test whether a random or constant publication process could produce similar coverage curves, nor does it report confidence intervals or any measure of fit. Given n=6 and the authors' own acknowledgement in Section IV that 'more CVE examples should be analyzed,' the conclusion that this is a recurring temporal dynamic is under-supported.
minor comments (4)
- [Figure 2] The figure caption says 'CVE-2022-35078' but the text and the CVE identifier used throughout describe CVE-2023-35078; the caption should be corrected.
- [Section III-A; Figure captions] There are inconsistencies between text and figure captions: the CVE-2023-35078 text says 23 IoCs were published 'over a period of 38 days' while Figure 2 says 'over 49 successive days,' and the CVE-2023-21409 text says 'over 55 days' while Figure 4 says 'over 25 successive days'; these numbers should be reconciled.
- [Section III-A] The first paragraph contains a formatting artifact in 'CVE-2023-391431) 1'; the CVE is otherwise given as CVE-2023-39143, so the stray digit and footnote marker should be cleaned up.
- [Section III-A; References] CVE-2023-37470 is described as having experienced 'an large IoC coverage increase' (should be 'a large'), and the prose could be polished for grammatical consistency; in addition, Reference [7] has a truncated URL and Reference [5] has line breaks that should be fixed.
Circularity Check
No significant circularity: IoC publication-rate observations are empirical summaries of coverage curves, not predictions derived from fitted inputs or self-citations.
full rationale
The paper makes an observational claim: for six CVEs, IoC coverage grows over time, and in several cases the growth resembles a slow-fast-slow epidemic pattern. This claim is presented as a direct interpretation of plotted coverage data, not as the output of a model fitted to those data. No parameter is fitted and then renamed as a prediction; no equation is used to derive the pattern from the data; and no load-bearing assertion depends on the authors' own prior work. The SIR comparison is an external analogy used after the fact to describe the shape of the curves, not a model whose parameters are estimated from the IoC sets, so the 'prediction' is not statistically forced by construction. The completeness and attribution of the IoC sets is an assumption about data quality, but it is not itself derived from the conclusion, and the paper's text explicitly acknowledges that the pattern occurs only 'in several cases' and that 'more CVE examples should be analyzed.' Concerns about feed completeness, misattribution, or the small sample are validity and soundness issues, not circularity. There are no self-citations that carry the argument, and the cited prior work [1,2,4,6] provides external context and modeling analogies rather than the paper's own conclusions. Accordingly, no circular step can be quoted or exhibited, and the appropriate score is 0.
Assumptions & free parameters
assumptions (3)
- domain assumption The union of IoCs from the 16 providers over the observation period represents the complete set of 'all known IoCs related to the respective CVE.'
- domain assumption Day 0 for each curve is the CVE disclosure date, and all observed publication intervals are measured from that date.
- ad hoc to paper The six selected CVEs, all with critical CVSS scores of 9.8, provide a sufficient basis for a general temporal pattern.
Cite this review
Pith. "Pith review of Investigating the Temporal Dynamics of Cyber Threat Intelligence." pith.science (2026). https://pith.science/paper/YAWQWUWJ
@misc{pith2026241219086,
  author       = {Pith},
  title        = {Pith review of: Investigating the Temporal Dynamics of Cyber Threat Intelligence},
  year         = {2026},
  howpublished = {\url{https://pith.science/paper/YAWQWUWJ}},
  note         = {Machine review of arXiv:2412.19086}
}
read the original abstract
Indicators of Compromise (IoCs) play a crucial role in the rapid detection and mitigation of cyber threats. However, the existing body of literature lacks in-depth analytical studies on the temporal aspects of IoC publication, especially when considering up-to-date datasets related to Common Vulnerabilities and Exposures (CVEs). This paper addresses this gap by conducting an analysis of the timeliness and comprehensiveness of Cyber Threat Intelligence (CTI) pertaining to several recent CVEs. The insights derived from this study aim to enhance cybersecurity defense strategies, particularly when dealing with dynamic cyber threats that continually adapt their Tactics, Techniques, and Procedures (TTPs). Utilizing IoCs sourced from multiple providers, we scrutinize the IoC publication rate. Our analysis delves into how various factors, including the inherent nature of a threat, its evolutionary trajectory, and its observability over time, influence the publication rate of IoCs. Our preliminary findings emphasize the critical need for cyber defenders to maintain a constant state of vigilance in updating their IoCs for any given vulnerability. This vigilance is warranted because the publication rate of IoCs may exhibit fluctuations over time. We observe a recurring pattern akin to an epidemic model, with an initial phase following the public disclosure of a vulnerability characterized by sparse IoC publications, followed by a sudden surge, and subsequently, a protracted period with a slower rate of IoC publication.
Figures


Figures from the paper (2 more)

Reference graph
Works this paper leans on
-
[1]
Reading the tea leaves: A comparative analysis of threat in telligence,
V . G. Li, M. Dunn, P . Pearce, D. McCoy, G. M. V oelker, and S. Savage, “Reading the tea leaves: A comparative analysis of threat in telligence,” in 28th USENIX Security Symposium (USENIX Security 19) , Aug. 2019, pp. 851–867
work page 2019
-
[2]
Quality evaluation of cyber threat intelligence feeds,
H. Griffioen, T. Booij, and C. Doerr, “Quality evaluation of cyber threat intelligence feeds,” in Applied Cryptography and Network Security: 18th International Conference, ACNS 2020, Rome, Italy, October 19–22, 2020, Proceedings, Part II . Berlin, Heidelberg: Springer-V erlag, 2020, p. 277–296
work page 2020
-
[3]
Indic ators of compromise (IoCs) and their role in attack defence,
K. Paine, O. Whitehouse, J. Sellwood, and A. Shaw, “Indic ators of compromise (IoCs) and their role in attack defence,” RFC 942 4, Aug
-
[4]
Measur ing and visualizing cyber threat intelligence quality,
F. B. Daniel Schlette, M. Caselli, and G. Pernul, “Measur ing and visualizing cyber threat intelligence quality,” International Journal of Information Security , vol. 20, pp. 21–38, 2021
work page 2021
-
[5]
2021 sans cyber threat intelligence (CTI) survey,
R. Brown and R. M. Lee, “2021 sans cyber threat intelligence (CTI) survey,” https://www.threatq.com/documentation/Survey CTI-2021 ThreatQuotient.pdf, 2021
work page 2021
-
[6]
Stability a nalysis of a SEIQV epidemic model for rapid spreading worms,
F. Wang, Y . Zhang, C. Wang, J. Ma, and S. Moon, “Stability a nalysis of a SEIQV epidemic model for rapid spreading worms,” Computers & Security, vol. 29, no. 4, pp. 410–418, 2010
work page 2010
-
[7]
Automated indicator sharing (ais),
“Automated indicator sharing (ais),” 2023. [Online]. A vailable: https://www.cisa.gov/topics/cyber-threats-and-advisories/information-sharing/automated-i
work page 2023
-
[8]
A different cup of TI? the added value of commercial t hreat intelligence,
X. Bouwman, H. Griffioen, J. Egbers, C. Doerr, B. Klievink , and M. van Eeten, “A different cup of TI? the added value of commercial t hreat intelligence,” in 29th USENIX Security Symposium (USENIX Security 20) , Aug. 2020, pp. 433–450
work page 2020
Show all 10 references
-
[9]
Filterin g spam with behavioral blacklisting,
A. Ramachandran, N. Feamster, and S. V empala, “Filterin g spam with behavioral blacklisting,” in Proceedings of the 14th ACM Conference on Computer and Communications Security , ser. CCS ’07, New Y ork, NY , USA, 2007, p. 342–351
2007
-
[2023]
Available: https://www.rfc-editor.org/ info/rfc9424
[Online]. Available: https://www.rfc-editor.org/ info/rfc9424
Reviewed August 11, 2026 · model on record in the stance chip above.
Discussion (0). Continue with ORCID to comment.