REVIEW 4 major objections 4 minor 21 references
n-MeRCI: A new Metric to Evaluate the Correlation Between Predictive Uncertainty and True Error
T0 review · 4 major / 4 minor · reviewed 2026-08-14 · deepseek-v4-flash
Pith's one-line read n-MeRCI is a new normalized metric for whether predicted uncertainties track true errors, with 0 for perfect, 1 for no better than constant, and above 1 for worse.
desk verdict A scale-invariant uncertainty metric with a genuinely useful core, but the headline interpretability claims break down in exactly the heavy-tailed regime it was designed to handle. read the letter →
The pith
A machine-rendered reading of the paper's core claim, the machinery that carries it, and where it could break.
The reading
What carries the argument
The load-bearing object is the rescaled confidence interval: each predicted uncertainty $\sigma_i$ is multiplied by a single global factor $\lambda_\alpha$ taken as the $\alpha$-th percentile of the ratios $|\hat{y}_i-y_i^*|/\sigma_i$, so that $\alpha\%$ of the true errors lie inside the interval centered on the prediction. n-MeRCI then normalizes the mean width of these intervals by subtracting the oracle's mean absolute error and dividing by the same quantity for a constant uncertainty predictor. This ties calibration and sharpness together: $\lambda_\alpha$ enforces calibration at one percentile, while the average width penalizes uncertainty estimates that are unnecessarily wide.
What would settle it
Construct a synthetic regression with known errors and assign each point an uncertainty equal to the reciprocal of its true error, rescaled so that 95% of the intervals still cover the errors. Since the uncertainties are anti-correlated with the errors, a metric that truly measures correlation should return a score at or above 1; if n-MeRCI scores near 0 on this construction, the global rescaling step is hiding the miscalibration.
Extended reading notes
Core claim
The central claim is that the quality of predictive uncertainty can be reduced to a single scale-invariant, outlier-robust number. For a chosen percentile $\alpha$, the metric finds the minimal global factor $\lambda_\alpha$ such that $\alpha\%$ of the absolute errors are covered by the rescaled intervals $\lambda_\alpha\sigma_i$, averages these rescaled uncertainties, subtracts the mean absolute error, and divides by the corresponding value for a constant uncertainty predictor. This yields 0 for an oracle, 1 for a constant predictor, and values above 1 for uncertainty estimates worse than none. Applied to monocular depth estimation on NYU-Depth v2, the paper finds Multi Epochs—the standard deviation of predictions from one network saved at different epochs after convergence—to be the best uncertainty estimator (average n-MeRCI$_{95}=0.11$, MAE $=0.29$), while Learned Error is the worst ($0.65$).
Load-bearing premise
The metric assumes that each uncertainty estimate is correct up to one global multiplier; if a model is overconfident in some regions and underconfident in others, no single rescaling factor can fix that mismatch, and the score stops measuring the true correlation between uncertainty and error.
Editorial extensions
If this is right
- Uncertainty evaluation no longer requires a full predictive distribution; any deep regression method that outputs a scalar $\sigma$ can be scored directly.
- Because the metric is invariant to a global rescaling of uncertainties, methods that simply inflate their variances are not rewarded.
- The percentile parameter makes the score robust to a controlled fraction of outliers, so a few bad points do not dominate the verdict.
- On monocular depth estimation, Multi Epochs produces the most trustworthy uncertainty estimates among the compared methods, at no additional training cost beyond saving checkpoints.
- A score above 1 identifies an uncertainty predictor that is worse than ignoring uncertainty entirely.
Reading between the lines
- If the metric becomes standard, it may expose a blind spot: a model that is well calibrated globally but overconfident in some regions and underconfident in others can still receive a good score, so practitioners should pair n-MeRCI with per-region or per-depth-interval inspection.
- The same rescaling construction could be turned into a training objective: minimize the normalized mean rescaled interval directly rather than treating it only as an evaluation metric.
- The Multi Epochs result points to a cheap general recipe for uncertainty in deep regression: use checkpointed predictions from the final epochs of a single training run, relying on stochastic oscillations to highlight error-prone regions.
- Because coverage is checked at a single percentile, two predictors with identical n-MeRCI scores can differ in tail behaviour; computing the score at a second percentile would probe tail miscalibration.
Signed reviews
Editorial analysis
A structured set of objections, weighed in public.
Referee Report
Summary. The paper proposes n-MeRCI, a normalized evaluation metric for predictive uncertainty in regression. The metric first rescales all predicted uncertainties by a common factor chosen so that an alpha-percentile of absolute errors is covered, yielding MeRCI_alpha as the average rescaled uncertainty (Eq. 1). It then normalizes by the scores of an oracle and a constant uncertainty predictor, giving n-MeRCI_alpha in Eq. (2), with claimed values 0 for the oracle, 1 for a constant predictor, and >1 for predictors worse than constant. The authors validate the metric on a toy regression problem and on NYU-Depth v2 monocular depth estimation, comparing Monte Carlo Dropout, Deep Ensembles variants, Multi Epochs, Multi Networks, Bagging, and a Learned Error approach.
Significance. If the metric fulfilled its stated properties, it would fill a real gap: a scale-invariant, outlier-robust, scalar measure of how well predicted uncertainties track true errors, applicable to regression without distributional assumptions. The paper is clearly written and the experimental comparison is relevant to the robotics and deep-learning communities. However, the central normalization claimed in Section III-D is not a mathematical property of Eq. (2), and the experimental protocol contains gaps (no error bars, double outlier removal, single-image qualitative support). The contribution is therefore not yet established, though the underlying idea is worth further development.
major comments (4)
- [Section III-D, Eq. (2)] The denominator max_alpha(|y_i - y*_i|) - MAE is not always positive, and the paper's interpretability claims fail when it is negative. For example, take 95 errors of size 1 and 5 errors of size 1000, with alpha=95. Then MAE=50.95 and max_95=1, so the denominator is -49.95. With sigma_i=2 on the 95 small-error points and sigma_i=1000 on the 5 large-error points, the smallest lambda covering 95% of points is lambda_95=0.5, giving MeRCI_95=25.95, which is 25 times the constant predictor's MeRCI of 1. Yet Eq. (2) gives n-MeRCI_95=(25.95-50.95)/(1-50.95)=0.50, i.e. below 1, contradicting the stated '>1 means worse than constant' property. Increasing the uncertainties on the discarded 5% outliers makes n-MeRCI even lower (more negative), so the metric rewards wasting uncertainty on the very points it claims to ignore. The claimed lower bound of 0 is also not guaranteed: by putting tiny uncertainties on the (1-alpha) smallest-error points, one can keep alpha coverage while making the numerator of Eq. (2) negative, yielding n-MeRCI < 0. These are not corner cases; they are the heavy-tailed and outlier-contaminated regimes the alpha parameter is explicitly designed to handle. The paper must either redefine the normalization, restrict the claims to distributions where Q_alpha(epsilon) > MAE, or provide a corrected analysis.
- [Section III-C, Eq. (1)] The metric rests on the assumption that a single global scaling factor lambda can make the uncertainties compatible with the errors. This is only appropriate when the predictive uncertainty is correctly specified up to a global constant; if the model is overconfident in some regions and underconfident in others, no single lambda can fix the mismatch. In that common heteroscedastic miscalibration regime, n-MeRCI may assign a good score to a model with poor local correlation between uncertainty and error, or a poor score to a model with good local correlation. The paper does not state or test this assumption, and the toy and depth experiments do not include a diagnostic for whether the assumption holds.
- [Section VI-C] The quantitative depth evaluation applies two separate outlier-removal mechanisms: the paper states 'We withdraw 5% of the worst points' and then computes n-MeRCI with alpha=95. Since n-MeRCI_95 is already designed to ignore up to 5% of outliers at the metric level, the additional removal changes the evaluation and means the reported scores are not the n-MeRCI defined in Eq. (2) on the full test set. This makes the ranking of methods, including the central claim that Multi Epochs is best, depend on an undocumented preprocessing choice. Please report results on the full set, state the number of points removed, or justify why double removal is appropriate.
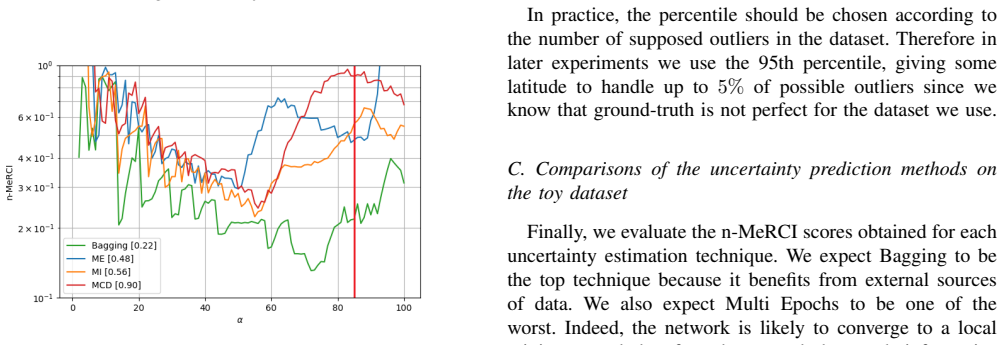
- [Section V-C and VI-C] The experimental validation lacks error bars or confidence intervals, although the text itself acknowledges that the toy results are 'very noisy' and that the NYU evaluation is based on a single trained model per method. The comparison in Fig. 5 reports only point estimates per depth interval, and Fig. 3 uses one image to explain the ranking. Without repeated runs or statistical testing, the observed differences between Multi Epochs, Monte Carlo Dropout, and Multi Inits (e.g. 0.45 vs 0.47 in Fig. 3, or 0.11 vs other averages in Fig. 5) cannot be distinguished from noise. At minimum, report standard deviations or confidence intervals and the number of images/depth pixels used for each average.
minor comments (4)
- [Section II and Section III] The notation 'max_alpha' is ambiguous: the text first describes an alpha-th percentile for the scaling factor, then calls a percentile an upper bound 'max_alpha'. Please define a single symbol such as Q_alpha(...) and use it consistently in Eq. (1), Eq. (2), and the discussion.
- [Abstract and Section II] There are several typos and wording issues: 'evaluated a on a toy dataset' in the abstract, 'inliners' should be 'inliers' in Section III-C, and the percentage inconsistency in Section V-B where 'although there is 85% of outliers' should read '15% of outliers'. These should be corrected.
- [Section V-B] The description of Fig. 2 says the score 'decreases as the number of inliners increases, to some extent', but the observed deterioration around alpha=60% shows non-monotonic behavior; a more careful explanation of why the percentile curve is not monotonic would help the reader.
- [Section VI-C] Figure captions for Fig. 4 and Fig. 5 report average MAE and average n-MeRCI in brackets, but the figures themselves are only referenced as plots w.r.t. depth intervals; please state in the text how the per-interval scores are aggregated and whether the averages are over pixels or over images.
Circularity Check
No circularity: n-MeRCI is defined directly, and its oracle/constant baselines are built into the normalization rather than derived from fitted data.
full rationale
The paper's central object, n-MeRCI, is introduced as a definition in Eqs. (1) and (2), not as a prediction derived from fitted parameters. The scale factor lambda_alpha is computed from the uncertainty/error pairs to make alpha% of errors covered, and the normalization by MAE and max_alpha is an explicit design choice; the claimed values for the oracle (0) and constant predictor (1) follow algebraically from that definition, so they are properties of the metric rather than empirical discoveries. The experimental section applies the metric to compare uncertainty-estimation methods, and the conclusion that Multi Epochs scores best is an empirical ranking under the defined metric, not a quantity forced by the metric's construction. The only self-citation is reference [21], which is used to obtain the NYU-Depth v2 architecture and data split; that citation is an experimental convenience and is not load-bearing for the validity of the metric. No step in the derivation reduces to its own inputs, and no fitted parameter is relabeled as a prediction. Potential mathematical issues with the denominator's sign in heavy-tailed regimes, if any, are correctness concerns rather than circularity.
Assumptions & free parameters
free parameters (1)
- coverage percentile alpha =
0.85 (toy), 0.95 (depth)
assumptions (2)
- domain assumption The alpha-th percentile of absolute errors is greater than the mean absolute error, so the denominator of Eq. (2) is positive.
- domain assumption A single global multiplicative scaling factor lambda_alpha can calibrate all uncertainties simultaneously, meaning the ratio error_i/sigma_i has a well-defined alpha-th percentile and the relative values of sigma_i are meaningful.
Cite this review
Pith. "Pith review of n-MeRCI: A new Metric to Evaluate the Correlation Between Predictive Uncertainty and True Error." pith.science (2026). https://pith.science/paper/YF4MLMGZ
@misc{pith2026190807253,
  author       = {Pith},
  title        = {Pith review of: n-MeRCI: A new Metric to Evaluate the Correlation Between Predictive Uncertainty and True Error},
  year         = {2026},
  howpublished = {\url{https://pith.science/paper/YF4MLMGZ}},
  note         = {Machine review of arXiv:1908.07253}
}
read the original abstract
As deep learning applications are becoming more and more pervasive in robotics, the question of evaluating the reliability of inferences becomes a central question in the robotics community. This domain, known as predictive uncertainty, has come under the scrutiny of research groups developing Bayesian approaches adapted to deep learning such as Monte Carlo Dropout. Unfortunately, for the time being, the real goal of predictive uncertainty has been swept under the rug. Indeed, these approaches are solely evaluated in terms of raw performance of the network prediction, while the quality of their estimated uncertainty is not assessed. Evaluating such uncertainty prediction quality is especially important in robotics, as actions shall depend on the confidence in perceived information. In this context, the main contribution of this article is to propose a novel metric that is adapted to the evaluation of relative uncertainty assessment and directly applicable to regression with deep neural networks. To experimentally validate this metric, we evaluate it on a toy dataset and then apply it to the task of monocular depth estimation.
Figures


Figures from the paper (2 more)


Reference graph
Works this paper leans on
-
[1]
Surpassing humans in boundary detection using deep learning,
I. Kokkinos, “Surpassing humans in boundary detection using deep learning,” CoRR, abs/1511.07386, vol. 2, 2015
arXiv 2015
-
[2]
Surpassing human-level face verification perfor- mance on lfw with gaussianface
C. Lu and X. Tang, “Surpassing human-level face verification perfor- mance on lfw with gaussianface.” in AAAI, 2015, pp. 3811–3819
work page 2015
-
[3]
The limits and potentials of deep learning for robotics,
N. S ¨underhauf, O. Brock, W. J. Scheirer, R. Hadsell, D. Fox, J. Leitner, B. Upcroft, P. Abbeel, W. Burgard, M. Milford, and P. Corke, “The limits and potentials of deep learning for robotics,” I. J. Robotics Res., vol. 37, no. 4-5, pp. 405–420, 2018
work page 2018
-
[4]
The limitations of deep learning in adversarial settings,
N. Papernot, P. McDaniel, S. Jha, M. Fredrikson, Z. B. Celik, and A. Swami, “The limitations of deep learning in adversarial settings,” in 2016 IEEE European Symposium on Security and Privacy (EuroS P), 2016, pp. 372–387
work page 2016
-
[5]
Neural RGB->D Sensing: Depth and Uncertainty from a Video Camera,
C. Liu, J. Gu, K. Kim, S. Narasimhan, and J. Kautz, “Neural RGB->D Sensing: Depth and Uncertainty from a Video Camera,” arXiv:1901.02571 [cs], Jan. 2019
arXiv 1901
-
[6]
Learning Depth from Single Monocular Images Using Deep Convolutional Neural Fields
F. Liu, C. Shen, G. Lin, and I. D. R. 0001, “Learning Depth from Single Monocular Images Using Deep Convolutional Neural Fields.” IEEE Trans. Pattern Anal. Mach. Intell., vol. 38, pp. 2024–2039, 2016
work page 2024
-
[7]
Dropout as a bayesian approximation: Representing model uncertainty in deep learning,
Y . Gal and Z. Ghahramani, “Dropout as a bayesian approximation: Representing model uncertainty in deep learning,” in international conference on machine learning , 2016, pp. 1050–1059
work page 2016
-
[8]
Simple and scalable predictive uncertainty estimation using deep ensembles,
B. Lakshminarayanan, A. Pritzel, and C. Blundell, “Simple and scalable predictive uncertainty estimation using deep ensembles,” in Advances in Neural Information Processing Systems , 2017
2017
Show all 21 references
-
[9]
What uncertainties do we need in bayesian deep learning for computer vision?
A. Kendall and Y . Gal, “What uncertainties do we need in bayesian deep learning for computer vision?” in Advances in Neural Informa- tion Processing Systems , 2017, pp. 5580–5590
2017
-
[10]
A Quantitative Evaluation of Confi- dence Measures for Stereo Vision,
Xiaoyan Hu and P. Mordohai, “A Quantitative Evaluation of Confi- dence Measures for Stereo Vision,” IEEE Tran.s on Pattern Analysis and Machine Intelligence, vol. 34, no. 11, pp. 2121–2133, Nov. 2012
2012
-
[11]
An overview of methods to evaluate uncertainty of deterministic models in decision support,
L. Uusitalo, A. Lehikoinen, I. Helle, and K. Myrberg, “An overview of methods to evaluate uncertainty of deterministic models in decision support,” Environmental Modelling & Software , vol. 63, 2015
2015
-
[12]
Probabilistic forecasts, calibration and sharpness,
T. Gneiting, F. Balabdaoui, and A. E. Raftery, “Probabilistic forecasts, calibration and sharpness,” Journal of the Royal Statistical Society: Series B (Statistical Methodology) , vol. 69, no. 2, pp. 243–268, 2007
2007
-
[13]
Strictly proper scoring rules, predic- tion, and estimation,
T. Gneiting and A. E. Raftery, “Strictly proper scoring rules, predic- tion, and estimation,” Journal of the American Statistical Association , vol. 102, no. 477, pp. 359–378, 2007. (a) input (b) prediction (c) absolute error (d) Multi Epochs n-MeRCI95 = 0.45, MAE 95 = 0.13 (e...
2007
-
[14]
Probabilistic backpropaga- tion for scalable learning of bayesian neural networks,
J. M. Hern ´andez-Lobato and R. Adams, “Probabilistic backpropaga- tion for scalable learning of bayesian neural networks,” in Interna- tional Conference on Machine Learning , 2015, pp. 1861–1869
2015
-
[15]
Fast unambiguous stereo matching using reliability-based dynamic programming,
M. Gong and Y . Yang, “Fast unambiguous stereo matching using reliability-based dynamic programming,” IEEE Trans. Pattern Anal. Mach. Intell., vol. 27, no. 6, pp. 998–1003, 2005. [Online]. Available: https://doi.org/10.1109/TPAMI.2005.120
2005 doi
-
[16]
Evaluating predictive uncertainty challenge,
J. Quinonero-Candela, C. E. Rasmussen, F. Sinz, O. Bousquet, and B. Sch ¨olkopf, “Evaluating predictive uncertainty challenge,” in Ma- chine Learning Challenges. Evaluating Predictive Uncertainty, Visual Object Classification, and Recognising Tectual Entailment , 2006
2006
-
[17]
Accurate uncertainties for deep learning using calibrated regression,
V . Kuleshov, N. Fenner, and S. Ermon, “Accurate uncertainties for deep learning using calibrated regression,” International Conference on Machine Learning , 2018
2018
-
[18]
Bagging predictors,
L. Breiman, “Bagging predictors,” Machine learning , vol. 24, no. 2, pp. 123–140, 1996
1996
-
[19]
Snapshot ensembles: Train 1, get m for free,
G. Huang, Y . Li, G. Pleiss, Z. Liu, J. E. Hopcroft, and K. Q. Weinberger, “Snapshot ensembles: Train 1, get m for free,” ICLR, 2017
2017
-
[20]
Indoor seg- mentation and support inference from rgbd images,
P. K. Nathan Silberman, Derek Hoiem and R. Fergus, “Indoor seg- mentation and support inference from rgbd images,” in ECCV, 2012
2012
-
[21]
Deep multi-scale architectures for monocular depth estimation,
M. Moukari, S. Picard, L. Simon, and F. Jurie, “Deep multi-scale architectures for monocular depth estimation,” in Image Processing (ICIP), 2018 IEEE International Conference on . IEEE, 2018. Fig. 4: MAE w.r.t. depth intervals for 95% of the points. Average MAE scores are disp...
2018
Reviewed August 14, 2026 · model on record in the stance chip above.
Discussion (0). Continue with ORCID to comment.