REVIEW 3 major objections 6 minor 23 references
A comparative analysis of GNSS-inferred precipitable water vapour at the potential sites for the Africa Millimetre Telescope
T0 review · 3 major / 6 minor · reviewed 2026-08-15 · deepseek-v4-flash
Pith's one-line read Gamsberg Mountain is the drier, more suitable site for the Africa Millimetre Telescope, and supports 345 GHz observing in winter.
desk verdict A useful, honest site assessment that correctly favors Gamsberg, but the headline 345 GHz winter claim rests on a six-week transfer relation extrapolated across all seasons. read the letter →
The pith
A machine-rendered reading of the paper's core claim, the machinery that carries it, and where it could break.
The reading
What carries the argument
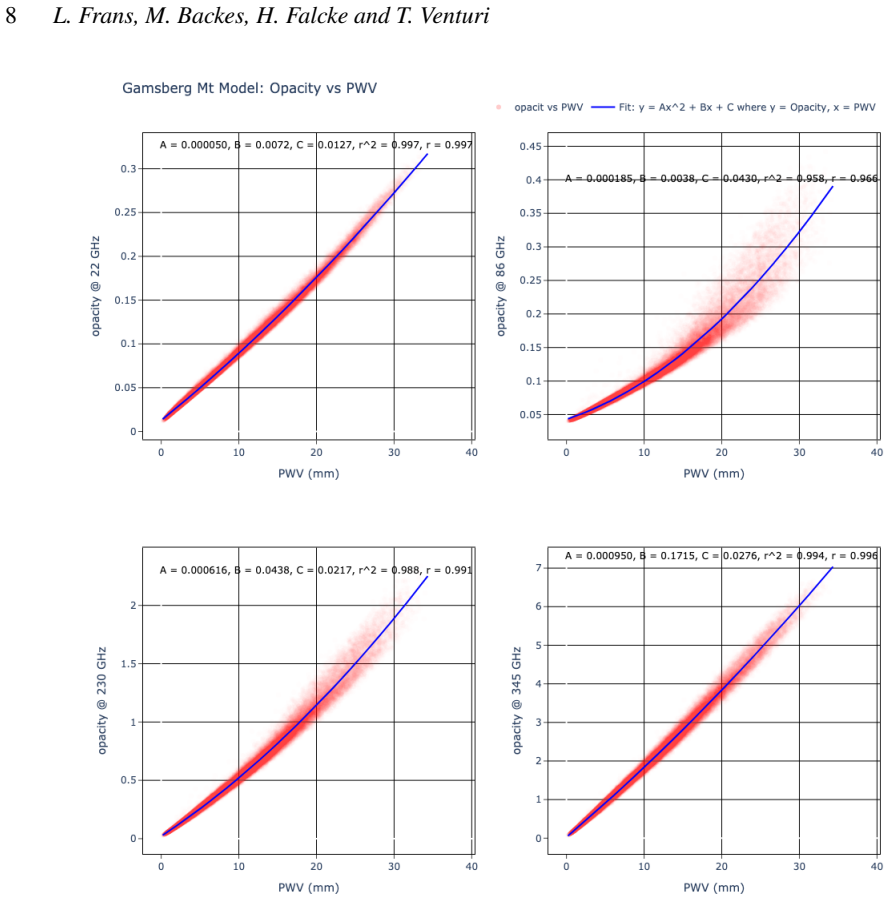
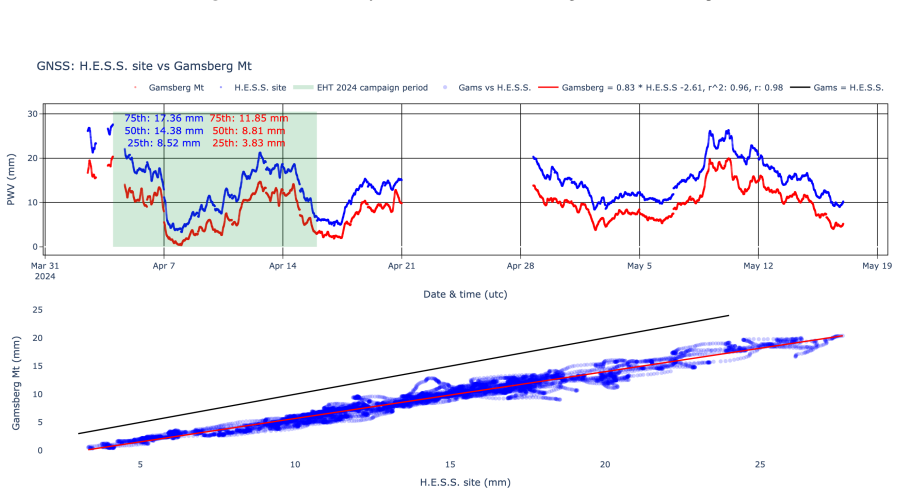
The argument runs on a conversion chain from raw GNSS signal delays to PWV and then to opacity. The zenith total delay is split into hydrostatic and wet parts using on-site pressure and the Saastamoinen-Davis hydrostatic models; the wet delay becomes PWV through the Bevis water-vapour constants and the weighted mean temperature. Because the Gamsberg GNSS record covers only six weeks, the paper manufactures a multi-season Gamsberg series by applying the linear relation $\mathrm{PWV}_{\mathrm{Gam}} = 0.83\,\mathrm{PWV}_{\mathrm{H.E.S.S.}} - 2.61\ \mathrm{mm}$, calibrated on the overlapping April-May 2024 data. PWV is then turned into opacity at 86, 230, and 345 GHz with quadratic fits built from MERRA-2 and the am atmospheric model, and transmission is $t(\nu)=e^{-\tau(\nu)}$.
What would settle it
Put a PWV radiometer, or a sustained GNSS receiver, on Gamsberg Mountain through June, July, and August and compare the measured winter median PWV with the predicted 2.62 mm. If the measured median comes out instead near the H.E.S.S. winter value, or if the Gamsberg-to-H.E.S.S. offset changes seasonally, the 345 GHz winter transmission claim fails.
Extended reading notes
Core claim
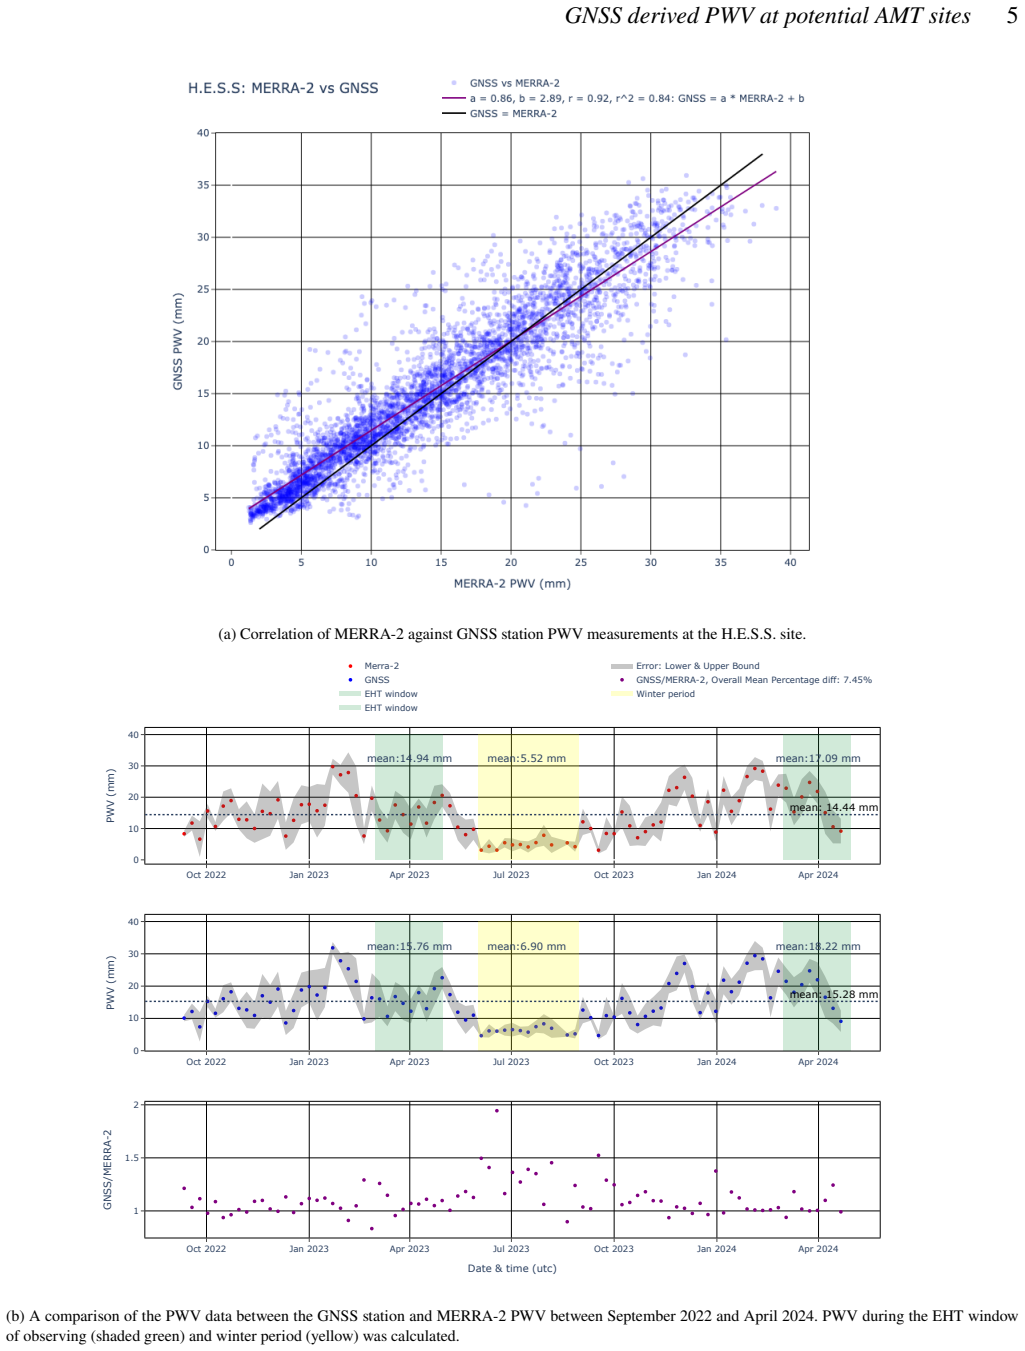
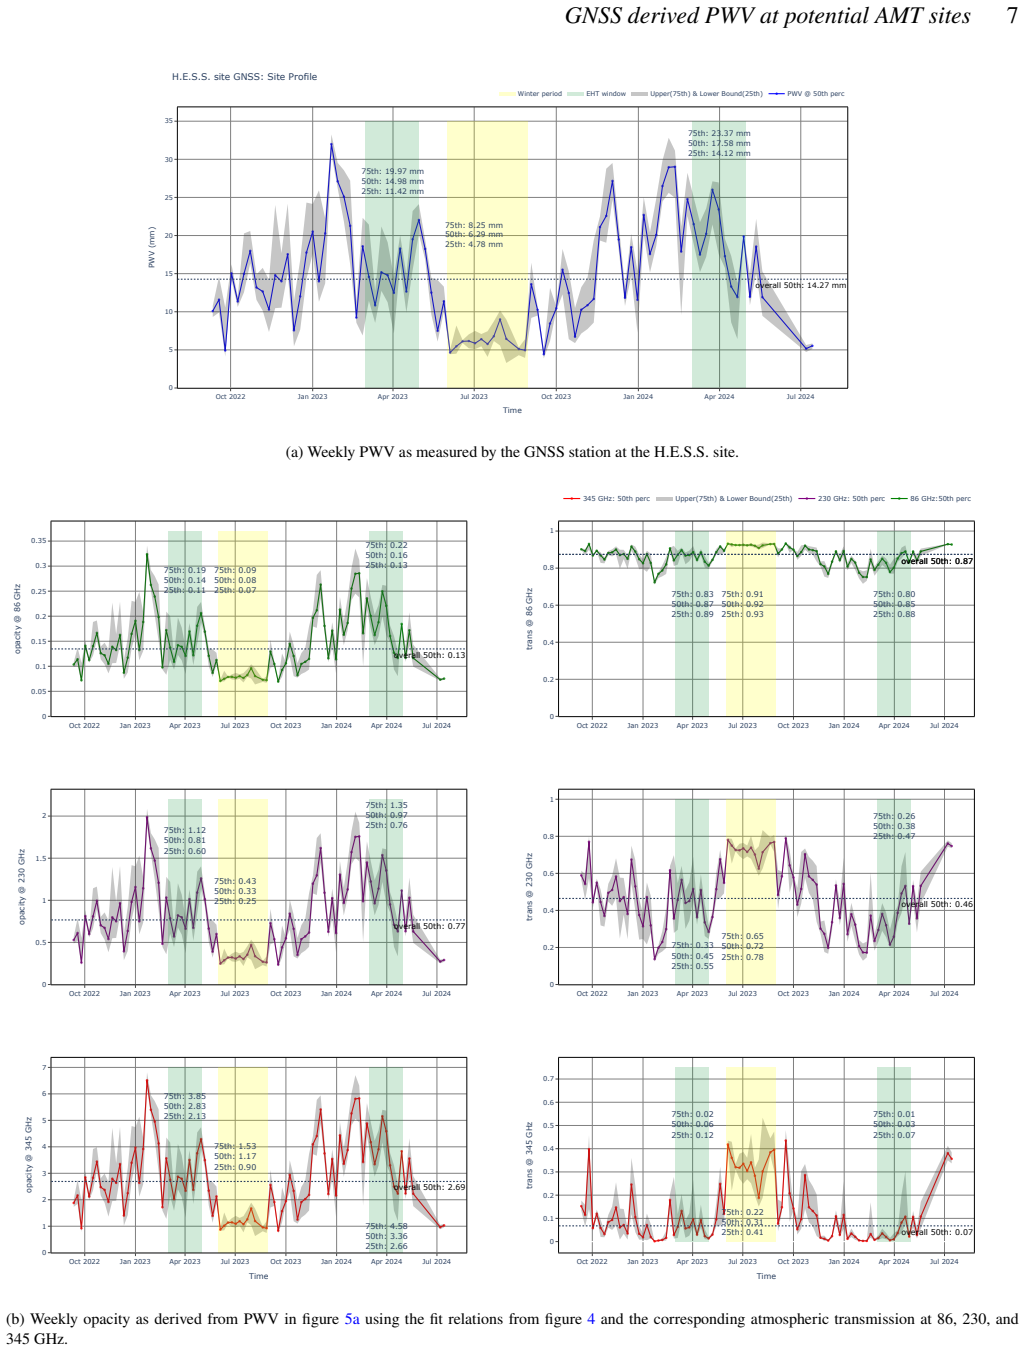
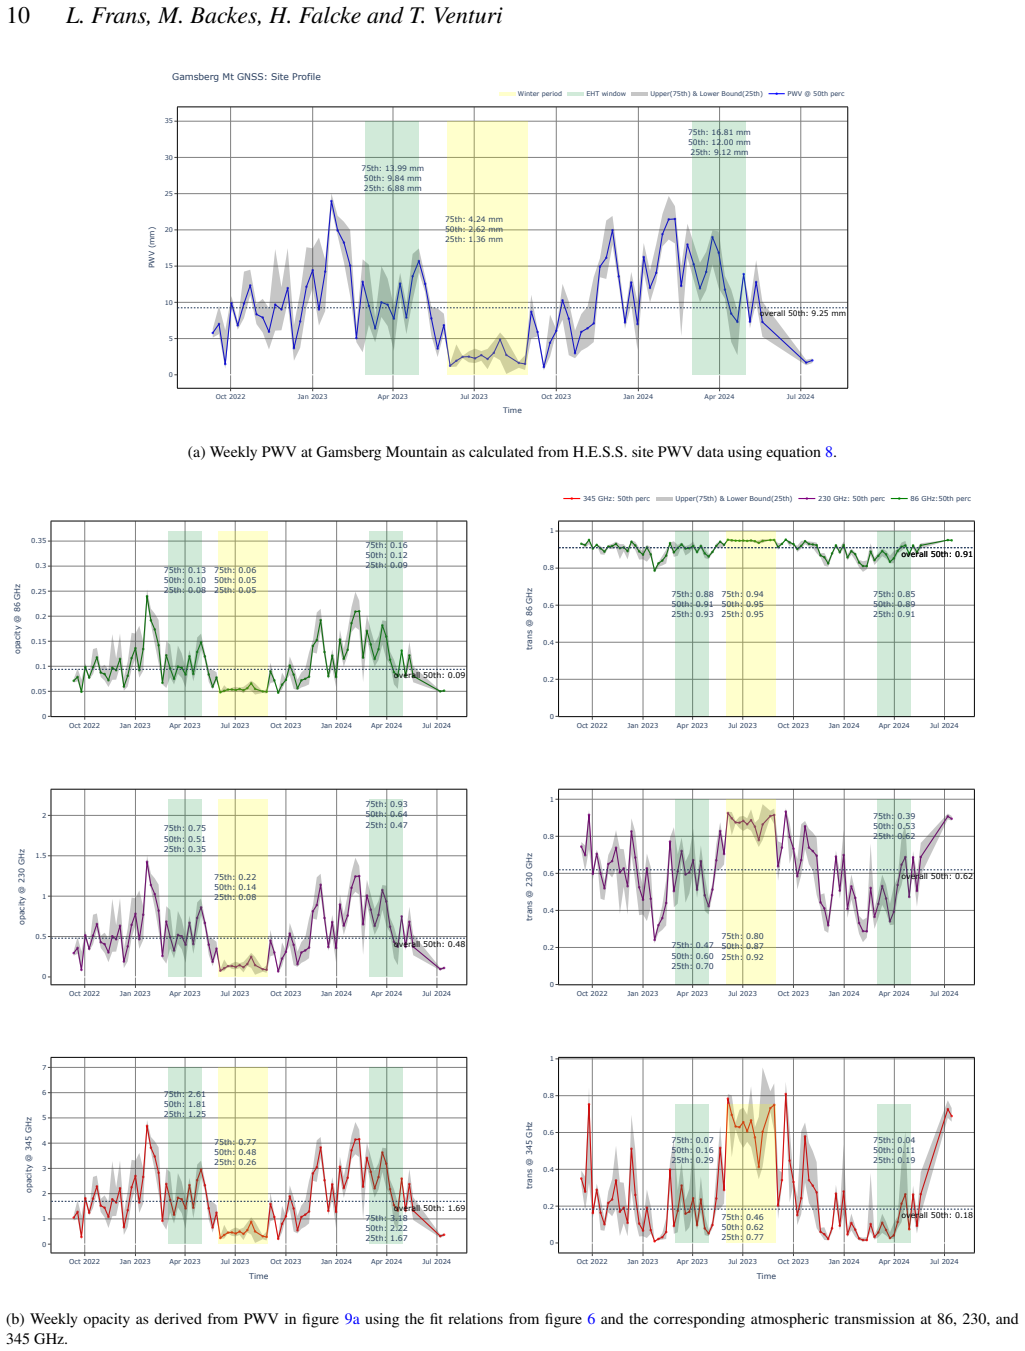
The central claim is that the Gamsberg Mountain, which stands 518 m higher, has consistently lower precipitable water vapour than the H.E.S.S. site and is therefore the most suitable location for the AMT. The paper derives PWV from GNSS signal-delay measurements, checks them against MERRA-2 reanalysis data (92% correlation), and then fills in the short Gamsberg record by converting H.E.S.S. PWV with the relation $\mathrm{PWV}_{\mathrm{Gam}} = 0.83\,\mathrm{PWV}_{\mathrm{H.E.S.S.}} - 2.61\ \mathrm{mm}$. On that basis it reports overall PWV medians of 14.27 mm at H.E.S.S. and 9.25 mm at Gamsberg, EHT-window medians of 16.62 mm and 11.20 mm, and a Gamsberg winter median of 2.62 mm, for which the 345 GHz transmission reaches a 62% median (77% at the 25th percentile). At the H.E.S.S. site, 345 GHz is effectively ruled out in the March-April EHT window, where even the best quartile passes only 10%.
Load-bearing premise
The load-bearing premise is that the two sites, 30 km apart, experience the same atmospheric conditions all year, so that a Gamsberg PWV series can be reconstructed from H.E.S.S. measurements using a relation fitted to six weeks of overlap.
Editorial extensions
If this is right
- Gamsberg would deliver median atmospheric transmission of 91% at 86 GHz and 62% at 230 GHz, versus 87% and 46% at the H.E.S.S. site.
- During the current March-April EHT window, a Gamsberg AMT would receive median 55% transmission at 230 GHz (68% in the best quartile), compared with 40% (52%) at H.E.S.S.
- 345 GHz observing is viable only from Gamsberg and only in winter, with a median transmission of 62%; at H.E.S.S. the EHT-window best is 10%.
- If the EHT extends beyond March-April, both sites could host 230 GHz EHT observations in the southern winter, with Gamsberg providing the most transparent sky.
Reading between the lines
- Inference: because the Gamsberg calibration record runs from April to May only, the same-atmosphere assumption carries the entire winter and 345 GHz result; an independent winter measurement could overturn it.
- Inference: the 518 m altitude advantage is doing most of the work in the PWV gap, so a short dedicated winter campaign at Gamsberg, even a few weeks of radiometer data, would directly test the most consequential claim.
- Inference: the exponential sensitivity of 345 GHz transmission to PWV means that a small dry-end error in the linear conversion changes the winter 345 GHz verdict; a modest PWV error near the winter median would move the transmission result by tens of percent.
- Inference: a natural next check is to use the same MERRA-2 reanalysis to predict seasonal Gamsberg PWV directly, since the paper uses MERRA-2 for opacity calibration but not as an independent seasonal Gamsberg PWV estimate.
Signed reviews
Editorial analysis
A structured set of objections, weighed in public.
Referee Report
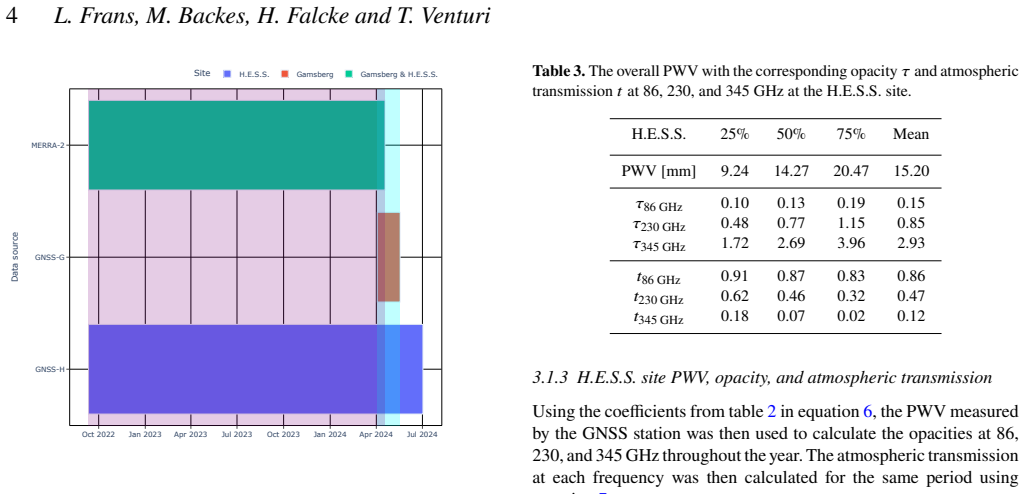
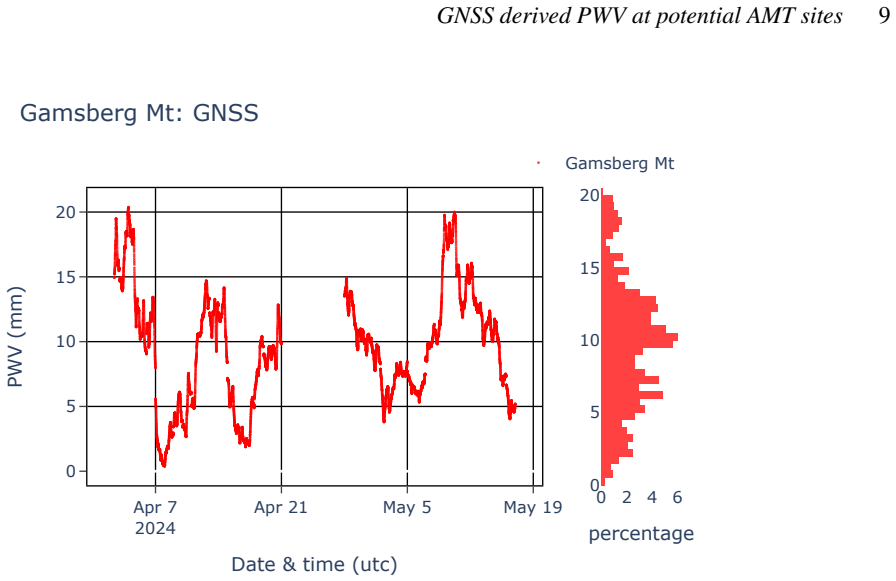
Summary. The manuscript compares GNSS-derived precipitable water vapour (PWV) at two candidate sites for the Africa Millimetre Telescope, the H.E.S.S. site and Gamsberg Mountain, and uses MERRA-2 reanalysis together with the am atmospheric model to derive opacities and atmospheric transmissions at 86, 230, and 345 GHz. The authors report that both sites are viable at 86 and 230 GHz, that Gamsberg has lower PWV overall (median 9.25 mm versus 14.27 mm), and that 345 GHz observations are possible at Gamsberg during winter, with a winter median PWV of 2.62 mm and a median 345 GHz transmission of 62%. The analysis rests on a short six-week overlap of GNSS data at the two sites (2 April to 16 May 2024), from which a linear transfer relation is derived and then applied to the full H.E.S.S. GNSS record to synthesize the Gamsberg seasonal statistics.
Significance. If the central seasonal results can be supported, the paper provides a valuable contribution to AMT site selection and to the broader EHT site-testing literature: it supplies a direct GNSS PWV record at H.E.S.S., demonstrates a high (92%) correlation between GNSS and MERRA-2 PWV, and applies a standard radiative-transfer tool to produce opacity and transmission estimates at three frequencies. The qualitative ranking of Gamsberg as drier is consistent with its 518 m altitude advantage and with Sarazin (1995), and the H.E.S.S. PWV analysis is largely sound. The main unresolved significance-risk is that the winter Gamsberg statistics, including the headline 345 GHz claim, are not directly measured but are synthesized through an extrapolated linear relation.
major comments (3)
- [§3.2.2, Eq. (8)] The entire multi-season Gamsberg PWV series, including the winter median of 2.62 mm and the winter 345 GHz transmission values in Section 3.2.3, Table 6, and Figure 9, is synthesized by applying the relation PWV_Gam = 0.83 * PWV_HESS - 2.61 mm to the H.E.S.S. GNSS record. This relation is fitted to only the six-week concurrent period between 2 April and 16 May 2024 and is applied under the explicit assumption that the two sites experience the same atmospheric conditions. The sites differ by 30 km in horizontal separation and 518 m in altitude, so seasonal changes in moisture advection, orographic lifting, or valley-level processes could alter the slope or intercept during winter. Because the abstract's central claim that 345 GHz is possible at Gamsberg during winter rests on this extrapolation, the paper should (i) test the seasonal stationarity of Eq. (8) using the 24-year MERRA-2 record at both sites, (ii) provide uncertainties on the fitted parameters and propagate them through the opacity and transmission calculations, and (iii) state explicitly that no direct Gamsberg GNSS data exist for June-August.
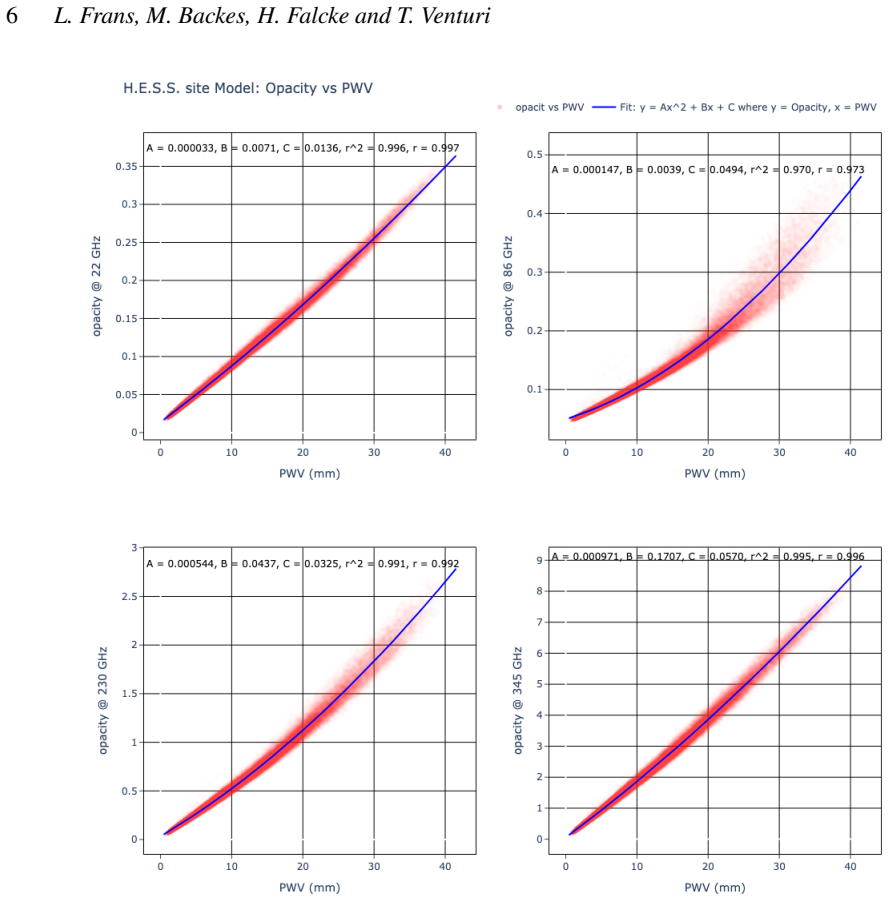
- [§3.1.2 and §3.2.1, Tables 2 and 5] The polynomial coefficients A, B, C in Eq. (6) are fitted to MERRA-2 PWV and opacity, but the transmission statistics in Tables 3, 4, 6, and 7 are computed by inserting GNSS PWV into these same fits. Section 3.1.1 reports a mean 7.45% difference (0.84 mm) between MERRA-2 and GNSS PWV at the H.E.S.S. site, yet this calibration offset is not propagated through Eq. (6). The resulting opacities and transmissions therefore carry an unquantified systematic uncertainty that is relevant to the 345 GHz conclusions. Please add an error-propagation or sensitivity analysis that shows how a PWV bias of the reported magnitude changes the transmission percentiles, especially at 345 GHz.
- [§3.2.3, Figure 9b and Table 6] The text states that during winter the Gamsberg 345 GHz median transmission is 62% and the 25th-percentile value is 77%, while Table 6 lists an overall 345 GHz median transmission of 18% and a 25th-percentile value of 40%. These numbers are not contradictory only if the winter statements are understood to be conditioned on the June-August weeks, but the paper never states how many winter weeks or seasons contribute to Figure 9b or Table 6. Please make the conditioning explicit and report the sample size behind each winter percentile; as written, the abstract's phrase '345 GHz possible at the Gamsberg Mountain during winter' can easily be misread as being supported by the overall statistics in Table 6.
minor comments (6)
- [§2.1, Eq. (5)] The typesetting of Eq. (5) is difficult to parse: the factor 10^6 and the combination k'_2 + k_3 T_m^{-1} should be displayed with standard mathematical notation and clear parentheses.
- [§3.1.1] The text says the GNSS-MERRA-2 comparison covers 'over a year,' but the period from September 2022 to April 2024 is actually about 19 months; please state the exact span.
- [§3.2.2] The sentence 'only spans over 2 Months from 2 April 2024 and May 2024' should give the exact end date, 16 May 2024, as shown in Figure 7.
- [§3.1.1, Figure 3a] The reported '92% correlation' should specify whether this is Pearson's r, Spearman's rank, or R^2, and should be accompanied by the scatter or residual statistics, since the transfer relation in Eq. (8) is also a correlation-based fit.
- [§1 and §4] The paper should briefly reconcile its H.E.S.S. winter median PWV of 6.29 mm with the Backes et al. (2024) winter value of 3.04 mm cited in Section 1, rather than leaving the reader to infer all of the differences from the discussion of instrument biases.
- [§3.2.2] Please add a small table or text comparing the six-week concurrent GNSS statistics at both sites with the full synthesized year, so that the proportion of directly measured versus extrapolated data behind the final Gamsberg statistics is transparent.
Circularity Check
No significant circularity; the central PWV comparison is an explicit extrapolation, not a definitional tautology.
full rationale
The derivation is self-contained. H.E.S.S. PWV is directly observed from GNSS delay data using standard formulas (Eqs. 1-5). MERRA-2 is an independent reanalysis used to validate GNSS (92% correlation, Fig. 3) and to fit PWV-opacity polynomials (Eq. 6, Tables 2 and 5) with the am model; these fits are then applied to GNSS PWV, an independent input. The Gamsberg long-term series is transparently generated by Eq. 8, a linear transfer fitted to the six-week overlap of concurrent GNSS measurements, and is labeled as converted/estimated rather than measured. The winter Gamsberg statistics and 345 GHz transmission claims therefore rest on an unverified seasonal-stationarity assumption, which is a data-coverage and robustness concern, not a circular reduction: no target PWV or transmission value is used as input to the fit, and no result is definitionally identical to its premises. The only self-citations (Backes et al. 2016, 2024) provide site context and auxiliary H.E.S.S. instrument comparisons, but are not load-bearing for the main quantitative derivation.
Assumptions & free parameters
free parameters (3)
- H.E.S.S. PWV-opacity quadratic coefficients A, B, C at 86/230/345 GHz =
e.g. 230 GHz: A=0.000544 mm^-2, B=0.0437 mm^-1, C=0.0325 (Table 2)
- Gamsberg PWV-opacity quadratic coefficients A, B, C at 86/230/345 GHz =
e.g. 230 GHz: A=0.000616 mm^-2, B=0.0438 mm^-1, C=0.0217 (Table 5)
- Gamsberg-to-H.E.S.S. transfer slope and intercept =
0.83 and -2.61 mm (Eq.8)
assumptions (5)
- domain assumption NGL GipsyX ZTD solutions and VMF1 interpolated Tm are valid inputs for PWV estimation.
- domain assumption The two sites experience the same atmospheric conditions because they are in the same locality, so H.E.S.S. PWV can be mapped to Gamsberg PWV with Eq.8.
- domain assumption The am atmospheric model (Paine 2022) provides accurate PWV-opacity relations at 86, 230, and 345 GHz for these sites.
- standard math Bevis et al. (1994) constants and Saastamoinen/Davis ZHD models are applicable.
- domain assumption MERRA-2 reanalysis interpolated to the two sites is a faithful weather proxy over 24 years.
Cite this review
Pith. "Pith review of A comparative analysis of GNSS-inferred precipitable water vapour at the potential sites for the Africa Millimetre Telescope." pith.science (2026). https://pith.science/paper/YQ5WC4FM
@misc{pith2026250505310,
  author       = {Pith},
  title        = {Pith review of: A comparative analysis of GNSS-inferred precipitable water vapour at the potential sites for the Africa Millimetre Telescope},
  year         = {2026},
  howpublished = {\url{https://pith.science/paper/YQ5WC4FM}},
  note         = {Machine review of arXiv:2505.05310}
}
abstract
The Event Horizon Telescope (EHT) is a network of antennas across the globe currently used to image super-massive black holes (SMBHs) at a frequency of 230 GHz. Since the release of the image of M87$^\ast$ in 2019 and, subsequently, that of Sgr A$^\ast$ in 2022 by the EHT collaboration, the focus has shifted to dynamically imaging SMBHs. This has led to a search for potential sites to extend and fill in the gaps within the EHT network. The Gamsberg Mountain and the H.E.S.S. site are both located within the Khomas highlands and have been identified as potential sites for the Africa Millimetre Telescope (AMT). Precipitable water vapour (PWV) in the atmosphere is the main source of opacity and noise from atmospheric emissions when observing at millimetre to sub-millimetre wavelengths. This study aims to establish the PWV content and the atmospheric transmission at 86, 230, and 345 GHz at the AMT potential sites using Global Navigation Satellite System (GNSS) derived PWV data. Results show both sites have potential for observations at 86 and 230 GHz, with 345 GHz possible at the Gamsberg Mountain during winter. The overall median PWV of 14.27 mm and 9.25 mm was calculated at the H.E.S.S. site and the Gamsberg Mountain, respectively. The EHT window had PWV medians of 16.62 mm and 11.20 mm at the H.E.S.S. site and Gamsberg Mountain, respectively. Among the two sites, the Gamsberg Mountain had the lowest PWV conditions, therefore making it the most suitable site for the AMT.
Figures

Figures from the paper (6 more)
Reference graph
Works this paper leans on
-
[1]
Alshawaf F., Balidakis K., Dick G., Heise S., Wickert J., 2017, Atmospheric Measurement Techniques, 10, 3117
work page 2017
-
[2]
Backes M., et al., 2016, in The 4th Annual Conference on High Energy Astrophysics in Southern Africa PoS(HEASA 2016). p. 29, @doi 10.22323/1.275.0029
-
[3]
Backes M., Macucule F. F., Frans L. N., 2024, in Proceedings of High Energy Astrophysics in Southern Africa 2023 PoS(HEASA2023). p. 003, @doi 10.22323/1.459.0003
-
[4]
Bertiger W., et al., 2020, Advances in space research, 66, 469
work page 2020
-
[5]
Bevis M., Businger S., Chiswell S., Herring T. A., Anthes R. A., Rocken C., Ware R. H., 1994, @doi [Journal of Applied Meteorology] 10.1175/1520-0450(1994)033<0379:GMMZWD>2.0.CO;2 , https://ui.adsabs.harvard.edu/abs/1994JApMe..33..379B 33, 379
-
[6]
Blewitt G., Hammond W., Kreemer C., 2018, Eos, 99, e2020943118
work page 2018
-
[7]
Booth R. S., de Jonge M. J., Shaver P. A., 1987, The Messenger, https://ui.adsabs.harvard.edu/abs/1987Msngr..48....2B 48, 2
work page 1987
-
[8]
Combrink A. Z. A., 2006, PhD thesis, University of Cape Town, http://hdl.handle.net/11427/14811
work page 2006
Show all 23 references
-
[9]
Davis J., Herring T., Shapiro I., Rogers A., Elgered G., 1985, Radio science, 20, 1593
1985
-
[10]
Event Horizon Telescope Collaboration et al., 2019, @doi [ ] 10.3847/2041-8213/ab0e85 , https://ui.adsabs.harvard.edu/abs/2019ApJ...875L...4E 875, L4
2019 doi
-
[11]
Event Horizon Telescope Collaboration et al., 2022, @doi [ ] 10.3847/2041-8213/ac6429 , https://ui.adsabs.harvard.edu/abs/2022ApJ...930L..14E 930, L14
2022 doi
-
[12]
Fruck C., et al., 2015, @doi [Journal of Instrumentation] 10.1088/1748-0221/10/04/P04012 , http://adsabs.harvard.edu/abs/2015JInst..10P4012F 10, P04012
2015 doi
-
[13]
Global Modeling and Assimilation Office (GMAO), Goddard Earth Sciences Data and Information Services Center (GES DISC) 2015, MERRA-2 inst3\_3d\_asm\_Np: 3d , 3-Hourly, Aggregated Statistics, @doi 10.5067/QBZ6MG944HW0
2015 doi
-
[14]
Gueth F., 2019, in ALMA Development Workshop. p. 20, @doi 10.5281/zenodo.3240345
2019 doi
-
[15]
N., et al., 1998, @doi [Remote Sensing of Environment] 10.1016/S0034-4257(98)00031-5 , https://ui.adsabs.harvard.edu/abs/1998RSEnv..66....1H 66, 1
Holben B. N., et al., 1998, @doi [Remote Sensing of Environment] 10.1016/S0034-4257(98)00031-5 , https://ui.adsabs.harvard.edu/abs/1998RSEnv..66....1H 66, 1
1998 doi
-
[16]
Ohm S., Wagner S., H. E. S. S. Collaboration 2023, @doi [Nuclear Instruments and Methods in Physics Research A] 10.1016/j.nima.2023.168442 , https://ui.adsabs.harvard.edu/abs/2023NIMPA105568442O 1055, 168442
2023
-
[17]
Paine S., 2022, The am atmospheric model, @doi 10.5281/zenodo.5794521 , https://doi.org/10.5281/zenodo.5794521
2022 doi
-
[18]
W., et al., 2021, @doi [ ] 10.3847/1538-3881/abc3c3 , https://ui.adsabs.harvard.edu/abs/2021ApJS..253....5R 253, 5
Raymond A. W., et al., 2021, @doi [ ] 10.3847/1538-3881/abc3c3 , https://ui.adsabs.harvard.edu/abs/2021ApJS..253....5R 253, 5
2021 doi
-
[19]
Saastamoinen J., 1972, The use of artificial satellites for geodesy, 15, 247
1972
-
[20]
Sarazin M., 1995, Final Summary Report: Environmental conditions on Potential Observatories, Gamsberg Astroclimatological Summary Report VLT.TRE.ESO.17400
1995
-
[21]
Smette A., Horst H., Navarrete J., 2008, in Kaufer A., Kerber F., eds, 2007 ESO Instrument Calibration Workshop. p. 433, @doi 10.1007/978-3-540-76963-7_58
2008 doi
-
[22]
Sugiyama J., Nishino H., Kusaka A., 2024, @doi [Monthly Notices of the Royal Astronomical Society] 10.1093/mnras/stae270 , 528, 4582
2024 doi
-
[23]
write newline
" write newline "" before.all 'output.state := FUNCTION fin.entry write newline FUNCTION new.block output.state before.all = 'skip after.block 'output.state := if FUNCTION new.sentence output.state after.block = 'skip output.state before.all = 'skip after.sentence 'output.stat...
Reviewed August 15, 2026 · model on record in the stance chip above.
Discussion (0). Continue with ORCID to comment.