REVIEW 4 major objections 4 minor 1 cited by
Gamma-ray–lensing cross-check finds no WIMP signal
Reviewed by Pith at T0; open to challenge. T0 means a machine referee read the full paper against a public rubric. the ladder, T0–T4 →
T0 review · deepseek-v4-flash
2026-08-03 10:06 UTC pith:Z2D6CEH7
load-bearing objection Credible KiDS-Legacy x Fermi-LAT null; WIMP limits are a new data point but ride on a fixed blazar-only background. the 4 major comments →
KiDS-Legacy: WIMP dark matter constraints from the cross-correlation of weak lensing and Fermi-LAT gamma rays
The pith
A machine-rendered reading of the paper's core claim, the machinery that carries it, and where it could break.
Core claim
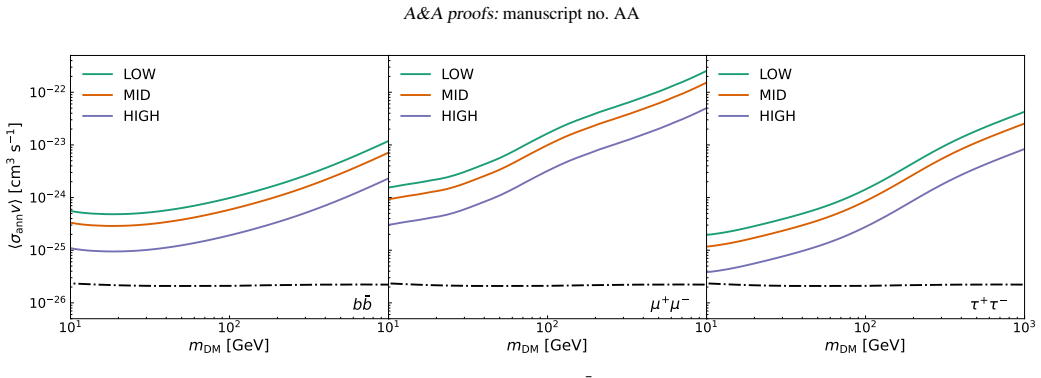
The central claim is a null result with upper limits: after constructing gamma-ray intensity maps in ten energy bins between 0.5 and 1000 GeV from 15 years of telescope data and cross-correlating them with six tomographic bins of cosmic shear, the measured cross-power spectra are consistent with zero. The expected signal from WIMP annihilation and decay is modeled with projection window functions and a halo-model power spectrum, treating blazars as the only unresolved astrophysical source. Because the data do not prefer a dark-matter component, the authors report 95% upper bounds on the velocity-averaged annihilation cross-section and the decay rate. They also show the same pipeline recovers
What carries the argument
The load-bearing object is the projected angular cross-power spectrum between gamma-ray intensity and lensing convergence, computed by Limber projection of the three-dimensional cross-spectrum. The WIMP contribution enters through annihilation and decay window functions that include a clumping factor describing dark matter concentration in haloes and subhaloes; the astrophysical baseline is a blazar window function built from a luminosity function with fixed parameters. The measurement uses a pseudo-Cell estimator on masked maps with a hybrid covariance: jackknife variances on the diagonal combined with a Gaussian, mode-coupling-aware model for cross-bin correlations.
Load-bearing premise
The DM limits hold only if the unresolved gamma-ray background is completely described by blazars with fixed luminosity-function parameters; if unmodeled source populations contribute differently in redshift or luminosity, the predicted baseline shifts and the limits change.
What would settle it
Recompute the UGRB–lensing cross-spectrum with a background model that includes star-forming galaxies, misaligned AGNs, and millisecond pulsars, and compare it with the measured null; if the predicted baseline rises substantially above the blazar-only model, the quoted WIMP limits would not stand. Observationally, a robust >5-sigma UGRB–lensing cross-correlation that persists across different masks and footprints and exceeds the blazar-only prediction would directly contradict the non-detection.
If this is right
- If the null is real, the 95% curves exclude WIMP annihilation and decay at or above the quoted levels for masses 10–1000 GeV in all three final states considered.
- Lensing-based constraints do not rely on galaxy bias, so they provide an independent check on galaxy-clustering and local-target indirect searches.
- The pipeline's successful recovery of a previously reported shear–gamma-ray signal suggests the discrepancy between surveys reflects sky-region and processing effects, not an estimator failure.
- A future wide-area lensing survey is forecast to tighten the bounds by about a factor of two, with the gain capped by gamma-ray angular resolution and photon noise.
- At current sensitivity, most channels do not exclude the canonical thermal-relic cross-section; the strongest exclusions appear at low masses and in high-clumping scenarios.
Where Pith is reading between the lines
- If the null is caused by inhomogeneous exposure and residual Galactic foregrounds, then a full-sky lensing survey with better large-scale systematics control could recover a signal or tighten limits by more than the forecast factor of two.
- A direct robustness test is to replace the blazar-only background with a model including star-forming galaxies, misaligned active galactic nuclei, and millisecond pulsars, then re-derive the limits; the size of the shift would measure how much the quoted numbers depend on that choice.
- The global chi-squared falling below the number of data points suggests the covariance is conservative; a less conservative covariance would likely sharpen the null and produce somewhat tighter upper bounds.
- Because the forecast reuses the same gamma-ray maps, the factor-of-two improvement is a floor; the next large gain requires better gamma-ray exposure and sky modeling, not only more lensing area.
Editorial analysis
A structured set of objections, weighed in public.
Referee Report
Summary. This paper presents a tomographic cross-correlation analysis between 15 years of Fermi-LAT unresolved gamma-ray background (UGRB) maps in ten energy bins (0.5–1000 GeV) and KiDS-Legacy weak lensing shear in six redshift bins, using pseudo-C_ell estimates with a hybrid jackknife/Gaussian covariance. The measured E- and B-mode cross-spectra are consistent with null (global chi^2 = 176.5 for 300 data points; B-mode chi^2 = 185.6). Interpreting this null under a WIMP annihilation/decay model with PPPC4DMID spectra, EBL attenuation, NFW/subhalo clumping, and a fixed blazar-only astrophysical background (Ajello et al. 2015 LDDE GLF), the authors derive 95% upper limits on <sigma_ann v> and Gamma_dec for masses 10–1000 GeV in the b bbar, mu+mu-, and tau+tau- channels. A Fisher forecast for a Euclid-like lensing survey combined with current Fermi-LAT maps gives roughly 2x tighter limits. The paper includes extensive validation and an appendix investigating the tension with the DES Y1/Y3 UGRB-lensing detections.
Significance. The non-detection itself and the derived upper limits are a useful addition to indirect WIMP searches, and the paper is particularly valuable because the KiDS null contrasts with the claimed DES detections; the cross-checks in Appendix C (reproducing galaxy–gamma and DES shear–gamma signals) are informative. The constraints are competitive at low WIMP masses under the stated modeling assumptions. However, the central numeric bounds inherit strong model dependence from the fixed blazar template and from unresolved foreground systematics; the paper's own Appendix C leaves open a systematic explanation for the KiDS null. These issues must be addressed before the quantitative limits can be regarded as robust.
major comments (4)
- [Section 2.3, Eq. (12)] The SED term is written as dF/dE = ∫ dE dN_S/dE e^{-tau(E,z)}, which is dimensionally inconsistent: the right-hand side is an integrated flux, not a differential flux, and the normalization K of Eq. (13) does not appear. This quantity enters Eq. (10) and therefore the entire blazar window function W_g^S. Please correct the equation and confirm the implementation; if the code uses the written form, the blazar baseline and all DM limits in Figs. 8–9 must be recomputed.
- [Sections 2.3 and 6] The DM limits assume a fixed blazar-only UGRB model with no nuisance parameters, no marginalization over the GLF normalization, the luminosity–halo mass mapping of Eq. (23), or omitted source populations (SFGs, mAGN, MSPs). Because the data are null, the total model must remain near zero; any change in the astrophysical template changes the DM amplitude allowed by the likelihood. The statement in Sect. 6 that 'the coupling between the blazar contribution and the DM-related parameters is negligible' is not demonstrated. Please either marginalize over astrophysical parameters with priors or show explicitly how the 95% limits shift under plausible variations of the blazar normalization, the M–L relation, and an added SFG/mAGN component. Without this, the headline bounds are conditional on an untested template choice.
- [Appendix C] The paper's own tests show that the same pipeline recovers a ~6 sigma DES Y3 shear–gamma signal but a null when applied to KiDS, and the concluding 'working hypothesis' is that foregrounds and large-scale Fermi-LAT anisotropies make the effective signal in the KiDS footprint differ from the homogeneous expectation. If this hypothesis is correct, the KiDS cross-spectra are not an unbiased estimate of the UGRB–lensing signal, and the 95% DM limits in Figs. 8–9—which treat the null as unbiased—could be biased. Please quantify the foreground/exposure effect in the KiDS footprint or add a corresponding systematic term to the likelihood; at minimum the abstract and conclusions should state that the limits are contingent on the null not being produced by these systematics.
- [Section 4.3 and Figs. 8–9] Limits are computed from a two-parameter likelihood over {<sigma_ann v>, Gamma_dec} using Delta chi^2 = 6.18, but are presented as one-dimensional 95% upper limits on each parameter. Please clarify whether these are projections of the joint 2D region or profile-likelihood upper limits. If the intended statement is a marginal 95% upper bound on one parameter, the appropriate Delta chi^2 threshold is 2.71 (or a profile over the other parameter); if a joint 2D region is meant, this should be stated and the figures should not be read as independent 1D limits.
minor comments (4)
- [Eq. (30)] The text says 'the contours were defined by the parameter sets d'; this should be 'parameter sets p'.
- [Abstract] The phrase 'particularly at low masses (GeV/TeV)' is ambiguous; please specify the range 10 GeV–1 TeV.
- [Fig. 10 caption] The acronym 'HWAC' should be 'HAWC'.
- [Section 5.1] The global chi^2 is significantly below the number of data points, indicating a likely overestimated covariance. The authors do discuss this, but it should also be explicitly noted that the quoted 'p-value close to unity' is therefore not a meaningful goodness-of-fit and that the resulting DM limits are conservative.
Circularity Check
No significant circularity: DM upper limits are derived from the measured null cross-spectra against externally calibrated model templates; the fixed blazar-only UGRB model is a systematic limitation, not a circular input.
full rationale
The claimed derivation chain is self-contained with respect to inputs. The data vector d is the measured KiDS-Legacy x Fermi-LAT pseudo-C_l cross-spectra (Sect. 4.1), and the model mu(p) is built from Eq. (4) using external ingredients: PPPC4DMID spectra (Cirelli et al. 2011), the Ajello et al. (2015) GLF, a Tinker et al. (2010) bias, a Camera et al. (2013) luminosity-halo mapping, and Planck cosmology. The DM parameters enter only as linear prefactors in W_g^ann (Eq. 6) and W_g^dec (Eq. 8), and the 95% upper limits are defined by the likelihood contour condition Eq. (30), chi^2(d,p)=chi^2(d,p_ML)+6.18. Nothing in these equations defines the fitted parameters in terms of the output limits or vice versa; the limits are what the null data allow once the external model templates are fixed. Some inputs are taken from co-authored prior work (Tröster et al. 2017 for clumping assumptions and confidence-contour convention; Paopiamsap et al. 2024 for M_min uncertainty), but these are stated assumptions with external origins (Fornengo & Regis 2014; Cuoco et al. 2015), not a uniqueness theorem or a fitted prediction, and they do not by themselves force the reported bounds. The paper explicitly flags its main limitation in Sect. 6: "we adopted fixed spectra and modelled the UGRB with blazars only... without marginalising over astrophysical-background parameters." This is a model-dependence/correctness concern, not circularity, because the blazar template is calibrated externally and is not constructed from the DM parameters it is used to constrain. Appendix C further shows the null result is not an artifact of the authors' own maps, since the pipeline recovers the literature galaxy-gamma-ray and DES shear-gamma-ray signals with external data products. Under the stated assumptions, the upper limits are a genuine consequence of the measurement rather than an equivalence to the inputs.
Axiom & Free-Parameter Ledger
free parameters (3)
- Minimum halo mass M_min =
10^-6 M_sun
- Subhalo concentration/boost scenario =
low / mid / high
- Euclid forecast per-bin effective number density =
~3 arcmin^-2 per bin
axioms (7)
- domain assumption Flat ΛCDM cosmology with Planck 2018 parameters (h=0.677, Ω_DM h^2=0.119, Ω_b h^2=0.022, σ_8=0.810, n_s=0.967)
- standard math Limber approximation for angular power spectra (Eq. 2), applied at ℓ≥200
- domain assumption Halo model decomposition into one- and two-halo terms, with Sheth-Tormen mass function and halofit nonlinear matter power
- domain assumption NFW halo density profile and clumping factor Δ² (Eq. 7) with M_min=10^-6 M_sun, M_max=10^18 M_sun, and literature subhalo boost models
- domain assumption Blazars are the only unresolved astrophysical UGRB component, with luminosity function and spectra from Ajello et al. (2015) and Korsmeier et al. (2022)
- domain assumption Gamma-ray yields for DM annihilation/decay from PPPC4DMID with electroweak corrections and unit branching ratio per final state
- standard math Gaussian likelihood and Δχ²=6.18 to define 95% confidence regions
read the original abstract
Dark matter dominates the matter content of the Universe, and its properties can be constrained through large-scale structure probes such as the cross-correlation between the unresolved gamma-ray background (UGRB) and weak gravitational lensing. We analysed 15 years of Fermi-LAT data, constructing UGRB intensity maps in ten energy bins (0.5-1000 GeV), and cross-correlated them with KiDS-Legacy shear in six tomographic bins. The measurements were performed using angular power spectra estimated with the pseudo-$C_\ell$ method. No significant cross-correlation is found. Based on this non-detection, we present 95% upper bounds on the weakly interacting massive particle (WIMP) decay rate $\Gamma_{\rm dec}$ and velocity-averaged annihilation cross-section $\langle\sigma_{\rm ann} v\rangle$ as functions of mass. We compare our results with bounds from other cosmological tracers and from local probes, and found them to be complementary, particularly at low masses ($\rm GeV/TeV$). In addition, using a Euclid-like lensing survey cross-correlated with Fermi-LAT, we forecast $\sim$2 times tighter limits, highlighting the potential of forthcoming data to strengthen constraints on dark matter annihilation and decay.
Figures




Forward citations
Cited by 1 Pith paper
-
Constraints on Annihilating Dark Matter from Gamma-Ray Background-Galaxy Shape Correlations: Model-independent Null Results and Moderate Template-based Signals
Fourier-space gamma-ray–cosmic-shear cross-correlations give model-independent null results that exclude thermal WIMP annihilation for 7–40 GeV masses under high substructure boost and wino-like 2–3 TeV scenarios unde...
Reference graph
Works this paper leans on
-
[1]
G., Ackermann, M., Adams, J., et al
Aartsen, M. G., Ackermann, M., Adams, J., et al. 2018, European Physical Jour- nal C, 78, 831 Abbasi, R., Ackermann, M., Adams, J., et al. 2023, Phys. Rev. D, 108, 102004 Abdallah, H., Abramowski, A., Aharonian, F., et al. 2016, Phys. Rev. Lett., 117, 111301 Abdallah, H., Abramowski, A., Aharonian, F., et al. 2018, Phys. Rev. Lett., 120, 201101 Abdollahi,...
Pith/arXiv arXiv 2018
-
[2]
The energy bins (E1 – E10) span 0.5–1000 GeV from low to high energy. Appendix B: Forecast from different covariance We adopted a Fisher forecast for aEuclid-like survey with wider sky coverage and better photometry to estimate the 95% upper bounds of the DM parameters, as detailed in Sect. 5.3. In the forecasts, we used the analytical covariance detailed...
2024
discussion (0)
Sign in with ORCID, Apple, or X to comment. Anyone can read and Pith papers without signing in.