Defect Engineered 2D MoS2 Materials for ML-enabled Neurotransmitter SERS Detection
Pith reviewed 2026-06-25 21:47 UTC · model grok-4.3
The pith
Sulfur vacancies in monolayer MoS2 enable selective SERS detection of dopamine and epinephrine down to 5×10^{-10} M.
A machine-rendered reading of the paper's core claim, the machinery that carries it, and where it could break.
Core claim
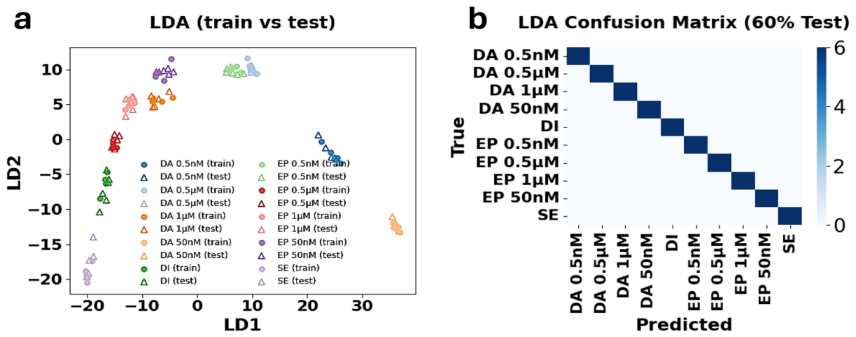
Defect-engineered MoS2 has enabled SERS detection of dopamine and epinephrine down to the sub-nanomolar range (5×10^{-10} M), with strong calibration reliability (R² = 0.95 and 0.99 for pure samples). PCA-LDA achieved 100% accuracy in distinguishing dopamine and epinephrine, which establishes defect-engineered MoS2 as a tunable, low-cost SERS platform for future sensing applications.
What carries the argument
Sulfur vacancies created by soft plasma etching, which regulate catechol-specific molecular adsorption and thereby activate charge-transfer SERS.
Load-bearing premise
The assumption that the sulfur vacancies are what specifically cause the catechol-group attachment and resulting SERS signal, rather than other defects or surface changes.
What would settle it
A control experiment showing either SERS response to dopamine on non-etched MoS2 or SERS response to serotonin on plasma-etched MoS2 would falsify the claimed role of sulfur vacancies.
Figures
read the original abstract
An attachment of catechol-containing neurotransmitter molecules is demonstrated on defect-engineered two-dimensional MoS2 platform, leading to activation of SERS due to molecular charge transfer. Mechanisms of neurotransmitters' bio-detection are discussed and Machine Learning methods are applied to distinguish spectra of structurally similar analytes. The SERS effect and selective docking of biomolecules are achieved through an optimized approach for defect engineering: namely, introducing the sulfur vacancies in MoS2 monolayer films via soft plasma etching led to molecular attachment driven by catechol functional groups. The quality of the sensor material was controlled by Raman, photoluminescence, and XPS characterization, thus allowing for optimization of the process of defect formation and achieving sensing selectivity. The sensor material showed no response to serotonin, confirming the specificity of attachment/SERS due to S-vacancies that regulate the strength of catechol-specific molecular adsorption. Defect-engineered MoS2 has enabled SERS detection of dopamine and epinephrine down to the sub-nanomolar range ($5\times10^{-10}$ M), with strong calibration reliability ($R^2$ = 0.95 and 0.99 for pure samples). PCA-LDA achieved 100$\%$ accuracy in distinguishing dopamine and epinephrine, which establishes defect-engineered MoS2 as a tunable, low-cost SERS platform for future sensing applications.
Editorial analysis
A structured set of objections, weighed in public.
Referee Report
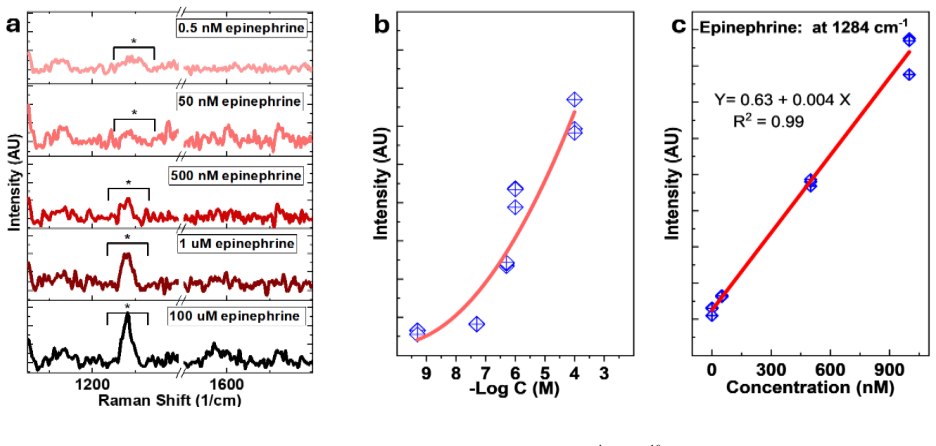
Summary. The manuscript demonstrates that soft plasma etching introduces sulfur vacancies in monolayer MoS2, enabling selective attachment of catechol-containing neurotransmitters (dopamine, epinephrine) that activates charge-transfer SERS down to 5×10^{-10} M, with R² calibration values of 0.95–0.99. No SERS response is observed for serotonin, supporting specificity; Raman/PL/XPS characterize the defects, and PCA-LDA ML classification achieves 100% accuracy in distinguishing the two analytes.
Significance. If validated, the approach supplies a low-cost, tunable 2D-material SERS platform for neurotransmitter detection that combines defect engineering for molecular selectivity with ML for spectral discrimination. The use of multiple orthogonal characterization methods (Raman, PL, XPS) to optimize the etching process is a clear experimental strength.
major comments (2)
- [Results, defect formation optimization] Results section on defect formation and optimization: the claim that sulfur vacancies specifically drive catechol attachment and SERS activation rests on the serotonin negative control and the Raman/PL/XPS data, yet no quantitative correlation is shown between XPS-derived vacancy fraction and either SERS intensity or limit-of-detection across the range of plasma-etching conditions. Without this correlation, other plasma-induced changes (roughness, Mo oxidation) cannot be ruled out as the origin of the observed effects.
- [SERS detection results] SERS performance and selectivity subsection: the reported sub-nanomolar detection limits and R² values are presented without accompanying details on the number of independent samples, replicate measurements, or error bars on the calibration curves; these statistics are required to assess whether the central performance numbers are robust or potentially affected by post-hoc selection.
minor comments (1)
- [Abstract] The abstract states concrete numerical claims (detection limit, R², 100% accuracy) but does not cross-reference the corresponding figures or tables that contain the underlying data.
Simulated Author's Rebuttal
We thank the referee for the positive assessment of our work and the constructive major comments. We address each point below and will revise the manuscript to strengthen the claims.
read point-by-point responses
-
Referee: [Results, defect formation optimization] Results section on defect formation and optimization: the claim that sulfur vacancies specifically drive catechol attachment and SERS activation rests on the serotonin negative control and the Raman/PL/XPS data, yet no quantitative correlation is shown between XPS-derived vacancy fraction and either SERS intensity or limit-of-detection across the range of plasma-etching conditions. Without this correlation, other plasma-induced changes (roughness, Mo oxidation) cannot be ruled out as the origin of the observed effects.
Authors: We agree that a direct quantitative correlation between XPS-derived S-vacancy fraction and SERS intensity/LOD across the etching conditions would more rigorously exclude contributions from roughness or Mo oxidation. The existing Raman/PL/XPS data were used to optimize the process and the serotonin control supports selectivity, but we will add a supplementary figure plotting vacancy percentage versus SERS intensity and LOD for the different plasma conditions in the revised manuscript. revision: yes
-
Referee: [SERS detection results] SERS performance and selectivity subsection: the reported sub-nanomolar detection limits and R² values are presented without accompanying details on the number of independent samples, replicate measurements, or error bars on the calibration curves; these statistics are required to assess whether the central performance numbers are robust or potentially affected by post-hoc selection.
Authors: We acknowledge that the manuscript lacks explicit reporting of the number of independent samples, replicates, and error bars on the calibration curves. In the revised version we will add these details (N=3 independent samples per concentration, triplicate measurements, and error bars on the log-log calibration plots) to demonstrate robustness of the reported LOD and R² values. revision: yes
Circularity Check
No circularity: experimental measurements and ML classification are independent of internal fits or self-citations
full rationale
The paper reports physical sample fabrication (soft plasma etching of MoS2), characterization (Raman/PL/XPS), SERS spectra collection for dopamine/epinephrine/serotonin, calibration curves, and PCA-LDA classification. Detection limits (5e-10 M), R^2 values, and 100% accuracy are direct experimental outcomes. No equations, derivations, or predictions appear that reduce these quantities to fitted parameters or self-cited results by construction. The serotonin negative control is an external experimental observation, not a definitional loop. Self-contained against benchmarks; no load-bearing self-citation chains or ansatzes identified.
Axiom & Free-Parameter Ledger
axioms (1)
- domain assumption Raman, photoluminescence, and XPS measurements accurately indicate the presence and density of sulfur vacancies in MoS2 monolayers
Reference graph
Works this paper leans on
-
[1]
As -received MoS₂ was transferred onto a target substrate (SiO₂/Si) following our previous method1, using a polymethyl methacrylate (PMMA A6) support layer
RANSFER PROTOCOL OF MOS₂ FROM SAPPHIRE TO THE TARGET SUBSTRATE The MoS2 samples used for this study were grown at The Pennsylvania State University Two-Dimensional Crystal Consortium – Materials Innovation Platform (2DCC -MIP) via metal -organic chemical vapor deposition (MOCVD) on a sapphire substrate. As -received MoS₂ was transferred onto a target subs...
-
[2]
DEFECT DENSITY CALCULATIONS
DETAILS ON CHARACTERIZATION PLASMA TREATED MOS 2. DEFECT DENSITY CALCULATIONS. Plasma-Induced Quenching of Raman and PL Signals Raman mapping was performed over a 15 µm × 15 µm area both before and after plasma etching, and the data were fitted with a Gaussian function. The plasma etching process caused a significant decrease in the intensity of the E₂g a...
-
[3]
SERS MEASUREMENTS Raman Spectrum of Neurotransmitters Figure S6: (left) Raman spectra of Dopamine (red), Epinephrine (blue) and Serotonin (green) powder. (right) Comparison of Raman spectra (from bottom to top) of Dopamine in powder form, 10 mM Dopamine in water solution, 1 mM Dopamine incubated for 2 hours on bare Si substrate, MoS2 substrate (no DA), 1 ...
-
[4]
However, the proximity of the SERS peaks of the DA and EP poses a challenge in distinguishing them
MACHINE LEARNING BASED MULTIVARIATE ANALYSIS Our results demonstrate that defect -engineered MoS₂ is capable of detecting analytes containing the catechol functional group (DA and EP) while showing no significant response to other (5- HT). However, the proximity of the SERS peaks of the DA and EP poses a challenge in distinguishing them. For example, even...
-
[5]
ADDITIONAL SUPPLEMENTAL INFORMATION Python code for the LDA model 28 29 30 References: 1 M. A. R. Khan, S. Kalkar, B. Khader, O. O. Ayodele, A. Prokofjevs and T. Ignatova, Nanoscale , 2025, 17, 19870–19881. 2 F. Bussolotti, K. E. J. Goh, J. Yang, H. Kawai and C. P. Y. Wong, ACS Nano, 2021, 15, 2686–2697. 3 F. Bussolotti, J. Chai, M. Yang, H. Kawai, Z. Zha...
discussion (0)
Sign in with ORCID, Apple, or X to comment. Anyone can read and Pith papers without signing in.