A Cap-Axis Integral Diagnostic of Factor Models
Pith reviewed 2026-07-03 02:08 UTC · model grok-4.3
The pith
A cap-axis integral diagnostic detects zero-alpha violations along the market-capitalization rank that low-dimensional factor models can leave even after improving the Sharpe frontier.
A machine-rendered reading of the paper's core claim, the machinery that carries it, and where it could break.
Core claim
Under an aggregate-market gate a zero curve on the cap-axis integral is equivalent to pricing the market's internal cap-rank subspace; the proposed diagnostic therefore isolates whether a factor model leaves systematic pricing errors along the capitalization rank even when it improves the overall Sharpe frontier.
What carries the argument
bridge-alpha curve obtained by lifting pricing errors along the market-capitalization rank axis under an aggregate-market gate
If this is right
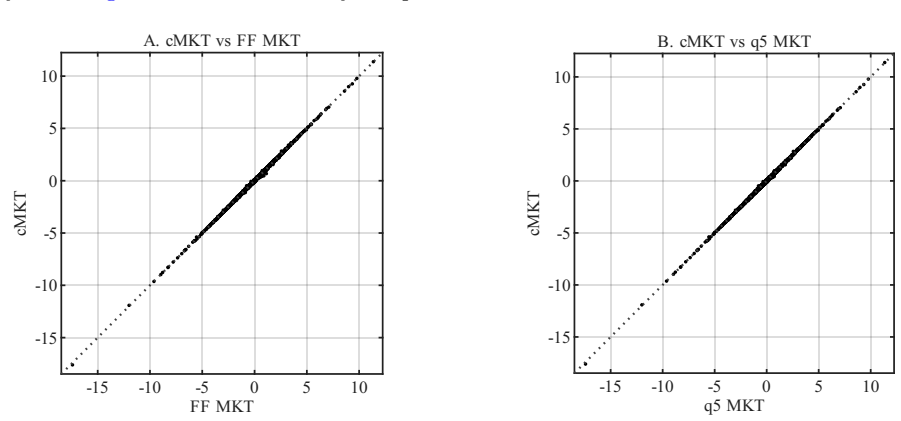
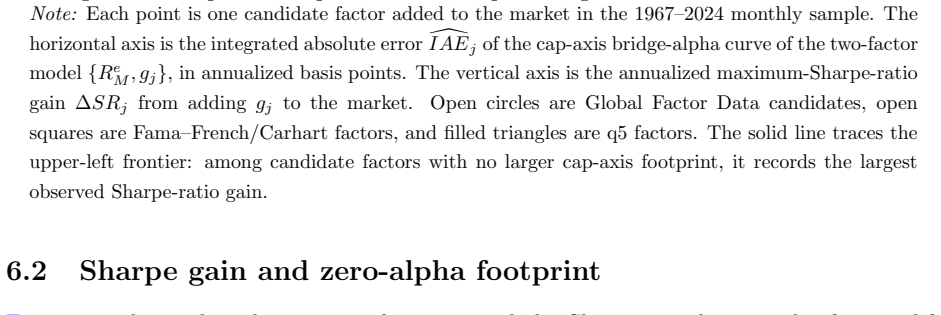
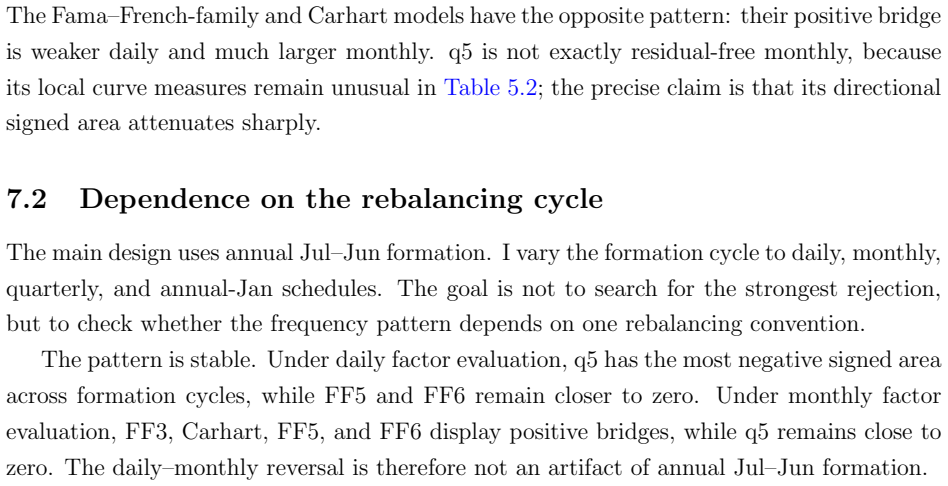
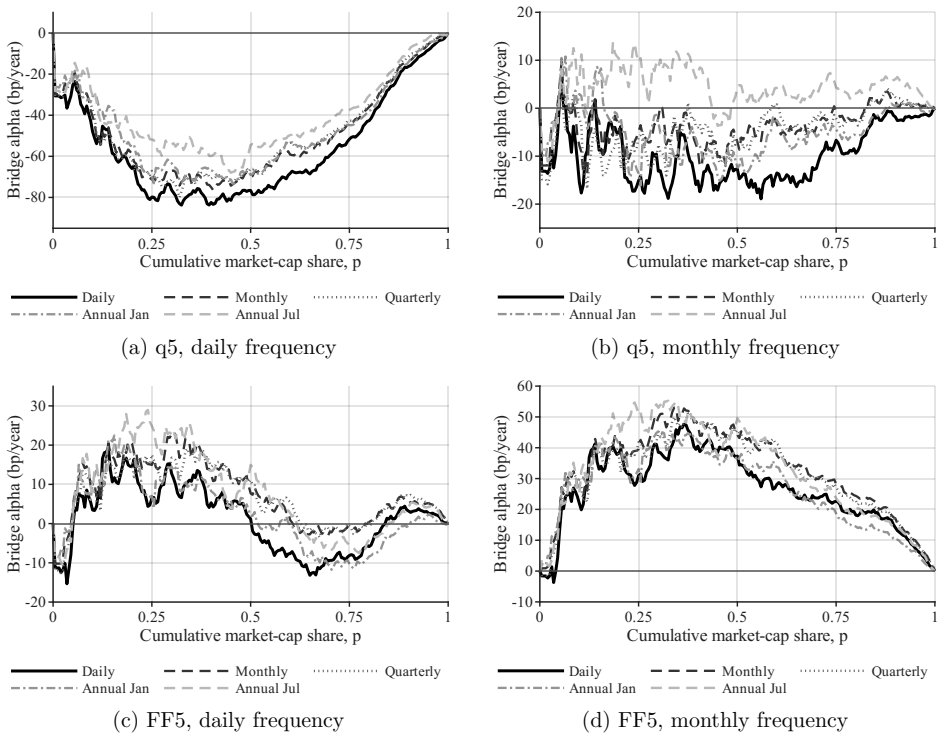
- q5 exhibits a daily negative bridge that attenuates once lead-lag correction is applied
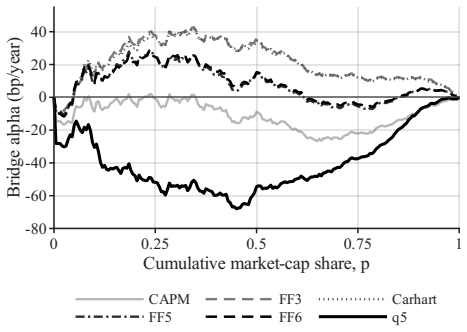
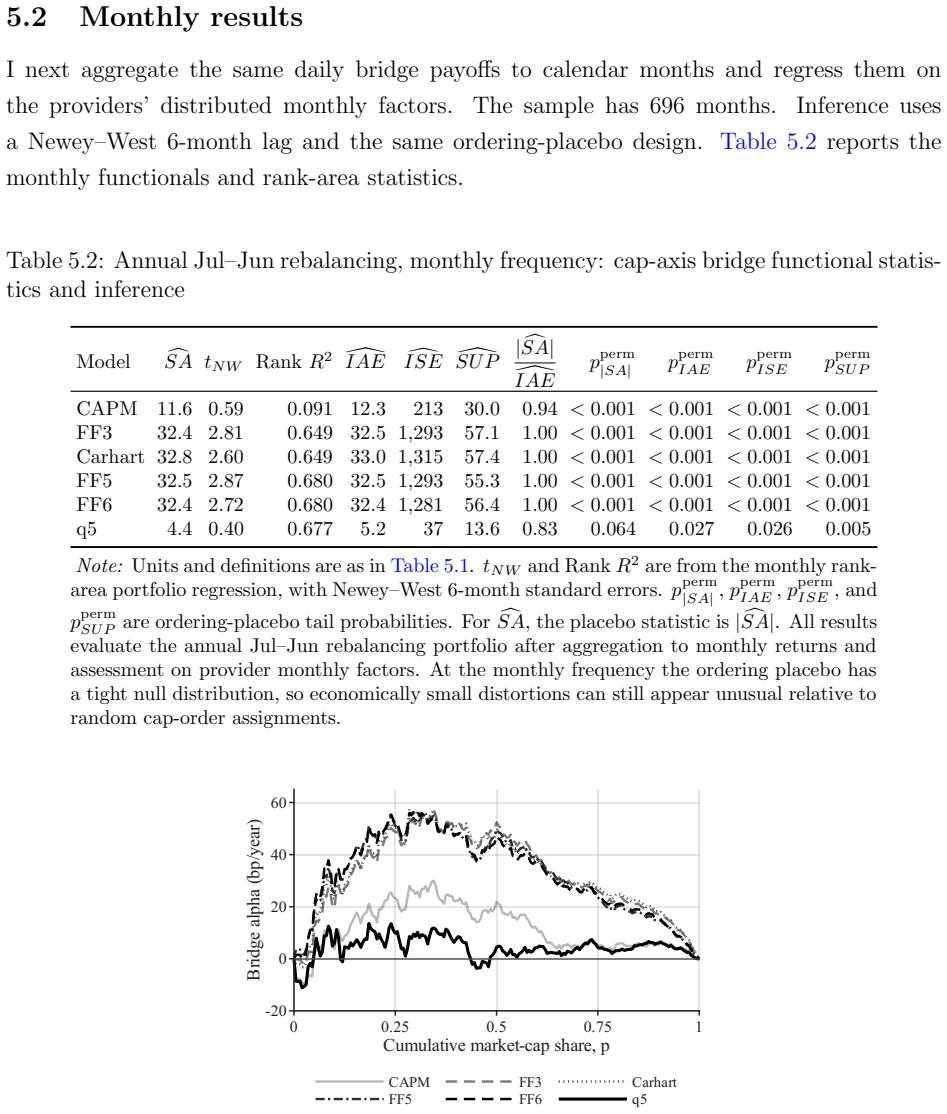
- Fama-French and Carhart bridges remain visible at monthly frequency
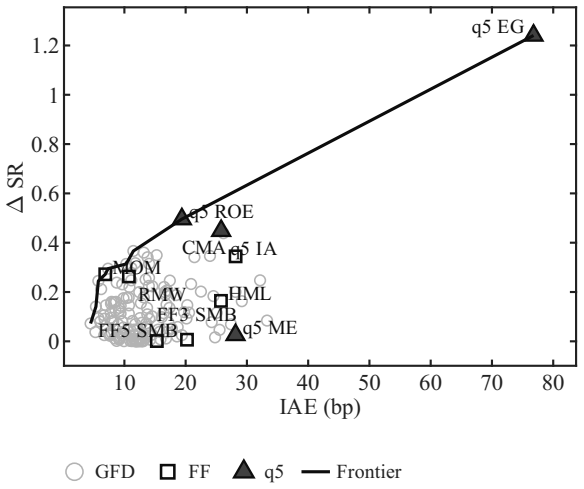
- The cap-axis norm differs from Sharpe gain and from size exposure when evaluated across 154 factors
Where Pith is reading between the lines
- The same lifting procedure could be applied to other fixed economic partitions such as industry or momentum groups
- Factor-model selection criteria could be augmented with a requirement that the cap-axis bridge be flat in addition to Sharpe improvement
- The observed distinction from size exposure implies the diagnostic isolates a dimension of mispricing not reducible to conventional size factors
Load-bearing premise
Lifting pricing errors into a bridge-alpha curve along the market-capitalization rank axis under an aggregate-market gate validly captures zero-alpha violations on economically fixed subspaces.
What would settle it
A model that is known to price every asset in the cap-rank subspace yet produces a persistently non-zero bridge-alpha curve would falsify the claimed equivalence between a zero curve and correct pricing of that subspace.
Figures
read the original abstract
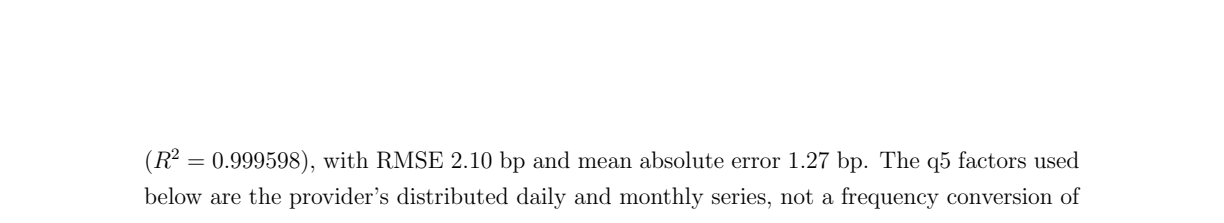
I propose a cap-axis integral diagnostic for factor-model evaluation. Low-dimensional factor models can improve the maximum-Sharpe frontier while leaving zero-alpha violations on economically fixed subspaces. The diagnostic studies one such subspace by lifting pricing errors into a bridge-alpha curve along the market-capitalization rank axis. Under an aggregate-market gate, a zero curve is equivalent to pricing the market's internal cap-rank subspace. In 1967-2024 CRSP data, q5's daily negative bridge attenuates under lead-lag correction, while Fama-French and Carhart bridges are more visible monthly. Across 154 factors, the cap-axis norm is distinct from Sharpe gain and size exposure.
Editorial analysis
A structured set of objections, weighed in public.
Referee Report
Summary. The manuscript proposes a cap-axis integral diagnostic for factor-model evaluation. Low-dimensional factor models can improve the maximum-Sharpe frontier while leaving zero-alpha violations on economically fixed subspaces. The diagnostic lifts pricing errors into a bridge-alpha curve along the market-capitalization rank axis; under an aggregate-market gate, a zero curve is equivalent to pricing the market's internal cap-rank subspace. In 1967-2024 CRSP data, q5's daily negative bridge attenuates under lead-lag correction, while Fama-French and Carhart bridges are more visible monthly. Across 154 factors, the cap-axis norm is distinct from Sharpe gain and size exposure.
Significance. If the equivalence holds and the empirical patterns are robust, the diagnostic supplies a new, subspace-focused tool for factor-model assessment that is orthogonal to Sharpe-ratio gains and size exposure. This could help identify zero-alpha violations on fixed economic partitions that standard metrics overlook, with potential value for daily versus monthly pricing tests.
major comments (2)
- [Abstract] Abstract: the central claim that 'under an aggregate-market gate, a zero curve is equivalent to pricing the market's internal cap-rank subspace' rests on the lifting procedure isolating fixed subspaces; no derivation is supplied showing how the gate orthogonalizes or conditions errors when cap ranks are time-varying or when factors induce cross-rank correlations, rendering the equivalence load-bearing and unverified.
- [Empirical Results] Empirical section: the statements that q5's daily negative bridge attenuates under lead-lag correction and that Fama-French/Carhart bridges are more visible monthly lack reported data-exclusion rules, error-bar information, or statistical tests; without these, it is impossible to confirm whether the math and empirical steps support the stated distinctions.
minor comments (2)
- [Abstract] The term 'bridge-alpha curve' is introduced without a concise definition or reference to its construction equation; a one-sentence gloss would aid readability.
- The selection criteria and exact count for the 154 factors are not stated; adding a brief description or table reference would improve reproducibility.
Simulated Author's Rebuttal
We thank the referee for the constructive comments on our manuscript. We address each major comment point by point below. The revisions will strengthen the paper by adding the requested derivation and empirical details.
read point-by-point responses
-
Referee: [Abstract] Abstract: the central claim that 'under an aggregate-market gate, a zero curve is equivalent to pricing the market's internal cap-rank subspace' rests on the lifting procedure isolating fixed subspaces; no derivation is supplied showing how the gate orthogonalizes or conditions errors when cap ranks are time-varying or when factors induce cross-rank correlations, rendering the equivalence load-bearing and unverified.
Authors: We agree that the manuscript does not supply an explicit derivation of the equivalence. In revision we will insert a formal derivation subsection showing that the aggregate-market gate conditions the pricing errors by subtracting the market-wide component at each date, after which the cap-axis integral aggregates deviations along the period-specific rank ordering. This isolates the internal cap-rank subspace because the rank axis is redefined each period from the cross-section, rendering the subspace economically fixed even as individual stock ranks change. We will also add a paragraph addressing factor-induced cross-rank correlations, including a robustness exercise that recomputes the bridge after orthogonalizing factors to the cap axis. revision: yes
-
Referee: [Empirical Results] Empirical section: the statements that q5's daily negative bridge attenuates under lead-lag correction and that Fama-French/Carhart bridges are more visible monthly lack reported data-exclusion rules, error-bar information, or statistical tests; without these, it is impossible to confirm whether the math and empirical steps support the stated distinctions.
Authors: The referee is correct that the current empirical section omits these details. We will revise the empirical results to report: (i) explicit data filters (minimum 60 observations per stock, exclusion of stocks with price below $1 at month-end, and treatment of delistings via CRSP delisting returns), (ii) pointwise standard-error bands obtained from a block bootstrap that respects the time-series dependence, and (iii) formal tests (two-sided t-tests on the integrated bridge norm and a test for equality of daily versus monthly norms) with p-values. These additions will be placed in the main text and an expanded appendix table. revision: yes
Circularity Check
No circularity: new diagnostic construction is self-contained
full rationale
The abstract presents a proposed diagnostic that lifts pricing errors into a bridge-alpha curve and states an equivalence under an aggregate-market gate. No equations, self-citations, fitted parameters renamed as predictions, or derivation steps reducing to inputs by construction appear in the provided text. The equivalence is offered as a property of the new construction rather than a re-expression of prior fits or self-referential definitions. This matches the default expectation of a non-circular paper.
Axiom & Free-Parameter Ledger
axioms (1)
- domain assumption Factor models should achieve zero alpha on all economically fixed subspaces including the market's internal cap-rank subspace.
invented entities (1)
-
bridge-alpha curve
no independent evidence
Reference graph
Works this paper leans on
-
[1]
Scholes, M., & Williams, J. (1977). Estimating betas from nonsynchronous data. Journal of Financial Economics, 5(3), 309--327. https://doi.org/10.1016/0304-405X(77)90041-1
-
[2]
Dimson, E. (1979). Risk measurement when shares are subject to infrequent trading. Journal of Financial Economics, 7(2), 197--226. https://doi.org/10.1016/0304-405X(79)90013-8
-
[3]
Gibbons, M. R., Ross, S. A., & Shanken, J. (1989). A test of the efficiency of a given portfolio. Econometrica, 57(5), 1121--1152. https://www.jstor.org/stable/1913625
-
[4]
Lo, A. W., & MacKinlay, A. C. (1990). Data-snooping biases in tests of financial asset pricing models. The Review of Financial Studies, 3(3), 431--467. https://doi.org/10.1093/rfs/3.3.431
-
[5]
Hansen, L. P., & Jagannathan, R. (1997). Assessing specification errors in stochastic discount factor models. The Journal of Finance, 52(2), 557--590. https://doi.org/10.1111/j.1540-6261.1997.tb04813.x
-
[6]
Cochrane, J. H. (2005). Asset Pricing (Revised ed.). Princeton University Press. https://www.johnhcochrane.com/asset-pricing
2005
-
[7]
Lewellen, J., Nagel, S., & Shanken, J. (2010). A skeptical appraisal of asset-pricing tests. Journal of Financial Economics, 96(2), 175--194. https://doi.org/10.1016/j.jfineco.2009.09.001
-
[8]
Barillas, F., & Shanken, J. (2017). Which alpha? The Review of Financial Studies, 30(4), 1316--1338. https://doi.org/10.1093/rfs/hhw101
-
[9]
Barillas, F., & Shanken, J. (2018). Comparing asset pricing models. The Journal of Finance, 73(2), 715--754. https://doi.org/10.1111/jofi.12607
-
[10]
Kozak, S., Nagel, S., & Santosh, S. (2018). Interpreting factor models. The Journal of Finance, 73(3), 1183--1223. https://doi.org/10.1111/jofi.12612
-
[11]
Cattaneo, M. D., Crump, R. K., Farrell, M. H., & Schaumburg, E. (2020). Characteristic-sorted portfolios: Estimation and inference. The Review of Economics and Statistics, 102(3), 531--551. https://doi.org/10.1162/rest_a_00883
-
[12]
Jensen, T. I., Kelly, B., & Pedersen, L. H. (2023). Is there a replication crisis in finance? The Journal of Finance, 78(5), 2465--2518. https://doi.org/10.1111/jofi.13249
-
[13]
Giglio, S., Xiu, D., & Zhang, D. (2025). Test assets and weak factors. The Journal of Finance, 80(1), 259--319. https://doi.org/10.1111/jofi.13415
-
[14]
Shin, U. (2026a). Which portfolios? The construction dependence of factor model performance. arXiv preprint arXiv:2606.19550. https://doi.org/10.48550/arXiv.2606.19550
work page internal anchor Pith review Pith/arXiv arXiv doi:10.48550/arxiv.2606.19550
-
[15]
Shin, U. (2026b). Anatomy of the Market: A Body-Tail Test of Factor Models. arXiv preprint arXiv:2606.23596. https://doi.org/10.48550/arXiv.2606.23596
work page internal anchor Pith review Pith/arXiv arXiv doi:10.48550/arxiv.2606.23596
-
[16]
Jegadeesh, N., & Titman, S. (1993). Returns to buying winners and selling losers: Implications for stock market efficiency. The Journal of Finance, 48(1), 65--91. https://doi.org/10.1111/j.1540-6261.1993.tb04702.x
-
[17]
Carhart, M. M. (1997). On persistence in mutual fund performance. The Journal of Finance, 52(1), 57--82. https://doi.org/10.1111/j.1540-6261.1997.tb03808.x
-
[18]
Fama, E. F., & French, K. R. (1992). The cross-section of expected stock returns. The Journal of Finance, 47(2), 427--465. https://doi.org/10.1111/j.1540-6261.1992.tb04398.x
-
[19]
Fama, E. F., & French, K. R. (1993). Common risk factors in the returns on stocks and bonds. Journal of Financial Economics, 33(1), 3--56. https://doi.org/10.1016/0304-405X(93)90023-5
-
[20]
Fama, E. F., & French, K. R. (2015). A five-factor asset pricing model. Journal of Financial Economics, 116(1), 1--22. https://doi.org/10.1016/j.jfineco.2014.10.010
-
[21]
Fama, E. F., & French, K. R. (2018). Choosing factors. Journal of Financial Economics, 128(2), 234--252. https://doi.org/10.1016/j.jfineco.2018.02.012
-
[22]
Hou, K., Xue, C., & Zhang, L. (2015). Digesting anomalies: An investment approach. The Review of Financial Studies, 28(3), 650--705. https://doi.org/10.1093/rfs/hhu068
-
[23]
Hou, K., Mo, H., Xue, C., & Zhang, L. (2019). Which factors? Review of Finance, 23(1), 1--35. https://doi.org/10.1093/rof/rfy032
-
[24]
Hou, K., Xue, C., & Zhang, L. (2020). Replicating anomalies. The Review of Financial Studies, 33(5), 2019--2133. https://doi.org/10.1093/rfs/hhy131
-
[25]
Hou, K., Mo, H., Xue, C., & Zhang, L. (2021). An augmented q-factor model with expected growth. Review of Finance, 25(1), 1--41. https://doi.org/10.1093/rof/rfaa004
-
[26]
Hou, K., Mo, H., Xue, C., & Zhang, L. (2024). The economics of security analysis. Management Science, 70(1), 164--186. https://doi.org/10.1287/mnsc.2022.4640
-
[27]
Center for Research in Security Prices, LLC. (2026). CRSP US Stock Databases [Data set]. Accessed via Wharton Research Data Services, June 5, 2026. https://www.crsp.org/research/
2026
-
[28]
French, K. R. (2026). Kenneth R. French Data Library [Data set]. Accessed May 5, 2026. https://mba.tuck.dartmouth.edu/pages/faculty/ken.french/data_library.html
2026
-
[29]
Global-q.org. (2026). Factors and testing portfolios [Data set]. Accessed May 5, 2026. https://global-q.org/factors.html
2026
-
[30]
Global Factor Data. (2026). Global Factor Data [Data set]. Accessed June 28, 2026. https://jkpfactors.com
2026
discussion (0)
Sign in with ORCID, Apple, or X to comment. Anyone can read and Pith papers without signing in.