REVIEW 4 major objections 4 minor 52 references
No Location Left Behind: Measuring and Improving the Fairness of Implicit Representations for Earth Data
T0 review · 4 major / 4 minor · reviewed 2026-08-09 · deepseek-v4-flash
Pith's one-line read Spherical wavelets end Earth models' island blind spot.
desk verdict A useful fairness benchmark for Earth INRs, with a plausible wavelet mitigation that is oversold by the title and a correlation analysis that needs more statistical care. read the letter →
The pith
A machine-rendered reading of the paper's core claim, the machinery that carries it, and where it could break.
The reading
What carries the argument
The load-bearing object is a spherical Morlet mother wavelet, $\psi_M(\theta,\phi) = [\Pi^{-1}\psi_{\mathbb{R}^2}](\theta,\phi) = e^{i\tan(\theta/2)\cos\phi}\,e^{-\frac{1}{2}\tan^2(\theta/2)}/(1+\cos\theta)$, obtained by inverse stereographic projection of the Euclidean Morlet wavelet. From it, the encoding builds an orthogonal family by rotations $R(\rho)$ over a Fibonacci lattice $F_N$ and dyadic dilations $D(a)$ with $a \in \{2^{i/Q}\}$, giving $O(NM)$-size embeddings that localize signals in both dilation and rotation. This multi-scale localization is what lets the encoding represent islands and coastlines at coarse resolutions without aliasing the global land-sea structure. The same construction is what breaks near the poles: the inverse stereographic projection is ill-defined there, and the paper's latitudinal analysis shows error rising from equator to poles.
What would settle it
On a FAIR-Earth task, restrict evaluation to latitudes above $80^\circ$ and compare spherical-wavelet and spherical-harmonic error; if the wavelet encoding's polar error exceeds the harmonic encoding's by more than the island error dropped, the claim that no location is left behind is not supported for polar regions.
Extended reading notes
Core claim
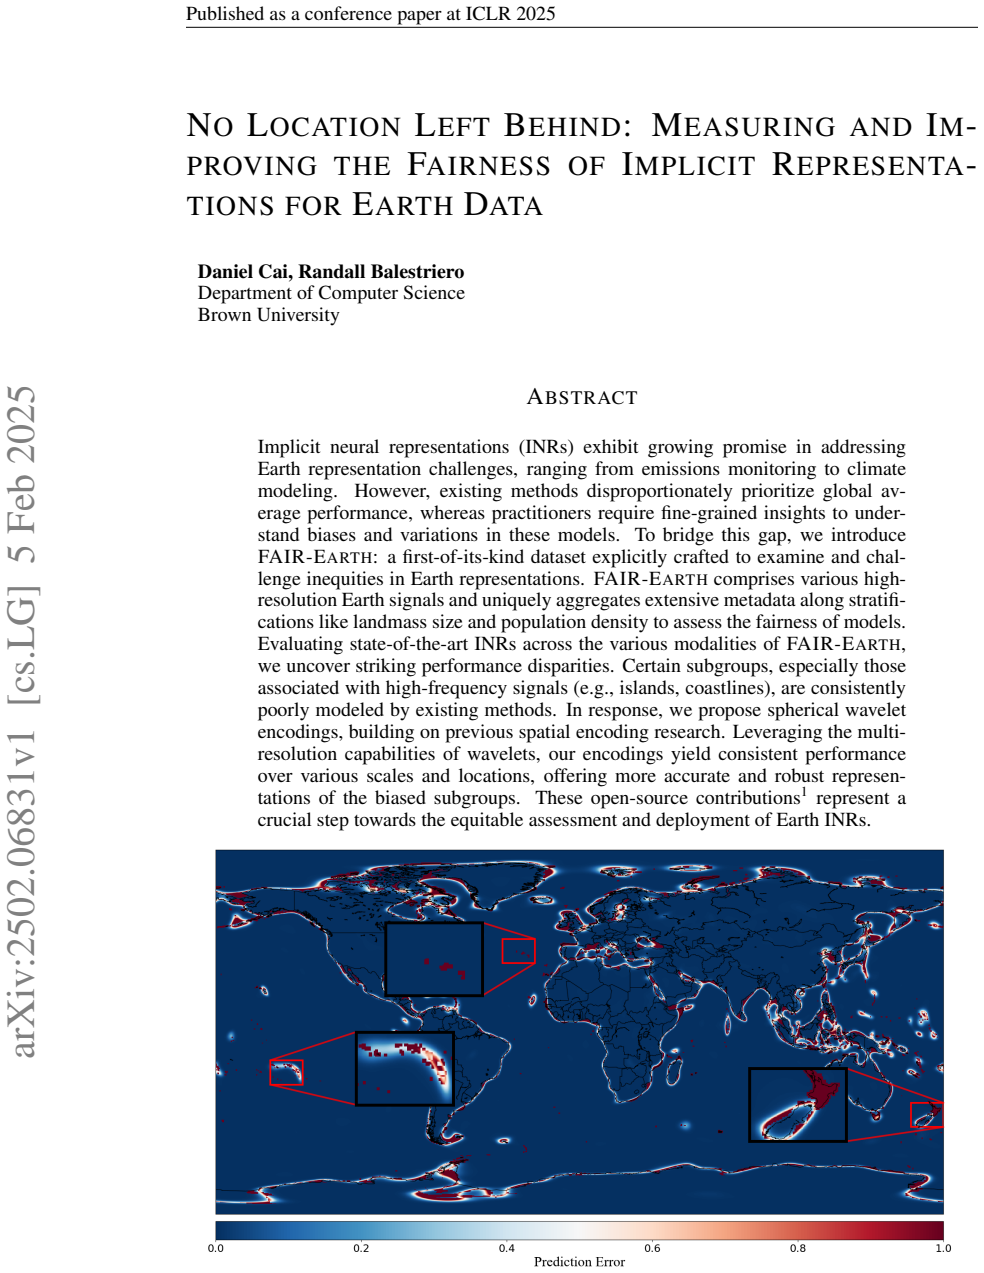
The paper's central claim is that optimizing Earth INRs for global loss is not fairness-neutral: on FAIR-Earth, spherical-harmonic, theory, and grid/sphere encodings all exhibit much higher loss on islands and coastlines than on land or sea, and when trained at finer resolution the harmonic encodings trade off land accuracy against island accuracy, producing a negative correlation. The authors attribute this to the global support of Fourier bases, which alias around sharp localized discontinuities. Their proposed spherical wavelet encoding replaces global harmonics with a multi-scale basis built from the inverse stereographic projection of the Morlet wavelet, discretized over a Fibonacci lattice with dyadic dilations; this encoding maintains competitive or better average loss while producing a positive correlation between land and island performance, meaning local and global accuracy improve together. The authors also report that spherical wavelets are computationally cheaper at large encoding sizes than spherical harmonics, though they degrade at high latitudes and underperform harmonics on a coarse single-scale checkerboard task.
Load-bearing premise
The encoding is built from a projection that is not defined at the poles and that visibly degrades near them; the paper assumes those polar regions are a small enough share of Earth-data tasks that the fairness gain on islands and coastlines is not offset by a newly introduced high-latitude bias.
Editorial extensions
If this is right
- Spherical wavelet encodings turn the land-island performance correlation from negative to positive across training resolutions, so optimizing for global accuracy no longer sacrifices island accuracy.
- On FAIR-Earth's land-sea, temperature, precipitation, and CO2 tasks, spherical wavelet encodings match or beat spherical harmonic encodings in average loss while narrowing island and coastline gaps.
- Spherical wavelet encodings scale better in generation time at larger sizes than spherical harmonic encodings, which suffer factorial-related numerical instability at high Legendre degree.
- The method does not dominate everywhere: spherical harmonics remain better on the coarse single-scale checkerboard task, and spherical wavelets degrade toward the poles.
- FAIR-Earth enables country-level and population-stratified fairness audits that were not possible with previously available geospatial datasets.
Reading between the lines
- If the multi-scale property transfers, combining a global harmonic branch with a localized wavelet branch could remove the polar degradation while keeping the island gain; the paper does not test such a hybrid.
- Because FAIR-Earth's grid is uniform in latitude and longitude, polar cells cover much smaller areas than equatorial cells, so the fairness metrics may under-weight polar surface area and soften the polar caveat.
- The same wavelet-encoding idea could be evaluated on other INR domains with multi-scale structure, such as 3D scene or medical signal reconstruction, to see whether the positive land-island correlation generalizes beyond Earth data.
- The reported negative land-island correlation for spherical harmonics could be used as a cheap diagnostic in other geospatial benchmarks: compute per-subgroup loss on land versus small landmasses before deploying an Earth INR.
Editorial analysis
A structured set of objections, weighed in public.
Referee Report
Summary. This paper introduces FAIR-Earth, an open-source benchmark package for measuring subgroup-level performance of implicit neural representations (INRs) on Earth data, with metadata stratifications for islands, coastlines, population density, and countries. Using this benchmark, the authors evaluate spherical harmonic, theory, grid-and-sphere, and their proposed Spherical Wavelet (SW) encodings, and report that existing encodings show strong biases against islands and coastlines. They propose SW encodings built from inverse stereographic projections of Morlet wavelets over a Fibonacci lattice, and argue that SW produces positive correlations between land and island performance across training resolutions, reduces island/coastline losses on the land-sea task, and remains competitive with spherical harmonics on global metrics. The paper also includes external validation on checkerboard and Rußwurm land-sea tasks and reports computational comparisons.
Significance. The FAIR-Earth dataset and accompanying open-source package are a useful contribution: they provide a concrete way to stratify Earth INR evaluation by geographic and demographic subgroups, and the empirical documentation of island/coastline bias in spherical harmonic and related encodings is valuable and credible. The SW encoding is a reasonable proposal, and the paper includes external tasks, hyperparameter sweeps, and error analyses that go beyond a single benchmark. However, the central claim that SW 'corrects localized biases' is currently supported mainly by the land-sea classification task; the correlation evidence in Table 2 is under-specified, and the temperature subgroup results in Table 15 show SW worse than SH on every subgroup. The theoretical claim of an orthogonal wavelet basis is also not established. With these points clarified, the paper could be a solid contribution.
major comments (4)
- [Section 4.3, Table 2] The claim that SW 'induces a positive trend between global (land) and localized (island) performance' rests on Pearson correlations whose sample size is not reported. If each correlation is computed across hyperparameter configurations at a fixed training resolution, the number of pairs needs to be stated and confidence intervals or significance tests provided; if it is computed across the four resolutions, n=4 and the sequence 0.51, 0.42, 0.04, 0.31 is not consistently positive and the conclusion would be fragile to a single resolution. The post hoc omission of SPHERE C+ from Table 2 'due to abnormally high bias' should be replaced by a prespecified exclusion criterion or by an appendix table including all baselines.
- [Section 4.2, after Eq. (2)] The text states that the rotated and dilated Morlet wavelets form 'a set of orthogonal basis functions.' Inverse stereographic projection of an admissible Euclidean wavelet yields an admissible spherical wavelet (zero-mean), but admissibility does not imply orthogonality, and Morlet wavelets are typically frames rather than orthogonal bases; discretization over a Fibonacci lattice with dyadic dilations does not by itself restore orthogonality. Please either prove the claim, replace it with the correct frame terminology, or provide a numerical check (e.g., Gram matrix condition) if orthogonality is used in the reconstruction formula.
- [Section 4.3 and Fig. 23] The paper acknowledges that the inverse stereographic construction is ill-defined at the poles and that SW performance degrades at high latitudes. Because the title and framing promise that 'no location is left behind,' the paper should quantify the affected area or population and state explicitly that the fairness improvement applies away from polar regions. As written, the polar degradation is a known limitation but its scope is not assessed.
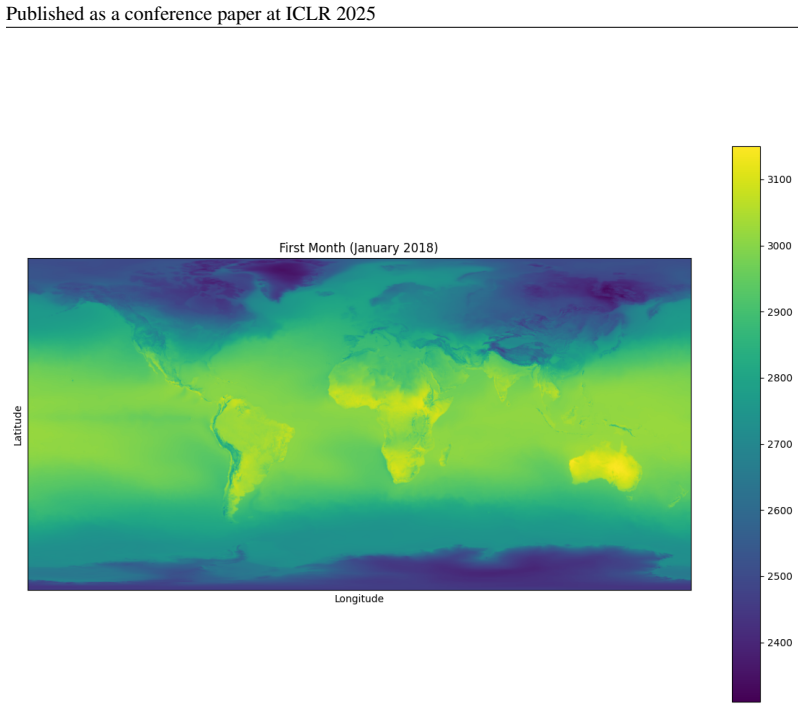
- [Section 4.3 and Table 15] On the surface temperature regression task, SW has higher subgroup loss than SH for every subgroup (land 0.087 vs. 0.076, sea 0.043 vs. 0.028, island 0.049 vs. 0.041, coast 0.101 vs. 0.083). Thus the claimed fairness improvement over baselines is demonstrated only on the land-sea binary classification task, not across the modalities promised in the abstract. The paper should either restrict the fairness claim to the land-sea task or provide subgroup-level evidence showing improvement on other FAIR-Earth modalities.
minor comments (4)
- [Table 1] The sea loss at resolution 30000 is reported as 0.80 ± 0.03, while all other sea entries are 0.16 or below; this appears to be a typo for 0.08 and should be corrected.
- [Section 3.2] The phrase 'data specifications available in Appendix A.1 and Appendix A.1' should reference the correct appendix sections, as the duplicate reference is a typo.
- [Section 4.1] The sentence 'particularly struggle with to demarcate the Spain's fine Mediterranean coastline' contains a grammatical error and should be rephrased.
- [Section 3.2] The description of the 0.1° grid as 'state-of-the-art resolution' is an overstatement for some of the constituent datasets and should be qualified.
Circularity Check
No significant circularity: the SW fairness claim is empirical and externally benchmarked, and the dataset construction and wavelet derivation do not reduce to the measured outcomes.
full rationale
The paper's claimed derivation chain is self-contained rather than circular. FAIR-Earth is assembled from external geophysical sources (IMERG, OCO-2, CHELSA, GPWv4) with metadata thresholds such as islands defined as landmasses under 30,000 square miles, and the fairness findings are empirical measurements on that benchmark, not consequences of the benchmark's definition. The spherical wavelet encoding is built on external wavelet theory: 'As proven in Sanz et al. (2006), this inverse stereographic projection of an admissible Euclidean wavelet yields an admissible spherical wavelet'; the Morlet mother wavelet is selected by an ablation (Fig. 25), not by the fairness metric. The claim that SW mitigates subgroup bias is tested under 'identical settings' against SH, THEORY, and GRID AND SPHERE baselines over a shared hyperparameter grid (Section 4.3, Tables 2 and 4), and additionally checked on external checkerboard and Rußwurm land-sea tasks (Tables 13-14), including an acknowledged polar failure mode (Fig. 23). The only self-citations (Balestriero et al. 2022; Kirichenko et al. 2023) motivate subgroup-level evaluation in general and do not appear in the derivation of the SW encoder or in the definition of the fairness statistics. No equation in the paper defines the SW correlation or the fairness metric in terms of the SW construction, and no fitted parameter is relabeled as a prediction; the positive-trend claim is an empirical correlation over trained configurations, however statistically fragile it may be. Hence no circular step is exhibited.
Assumptions & free parameters
free parameters (4)
- K Value (wave number) =
grid-searched, range 4-10, default 6
- Scale Factor =
grid-searched, range 0.75-1.25, default 1
- Maximum Scale (dilations) =
grid {2,3,4,5} or {3,4,5}
- Maximum Rotations =
grid {20..200 step 40} or {50,90,130,170}
assumptions (4)
- standard math Inverse stereographic projection of an admissible Euclidean wavelet yields an admissible spherical wavelet.
- domain assumption The discretized set {R(ρ)D(a)ψ_M} over a Fibonacci lattice and dyadic scales forms an orthogonal basis or well-behaved frame of L2(S2).
- domain assumption The FAIR-Earth 0.1° gridded sampling introduces only negligible temporal and polar bias.
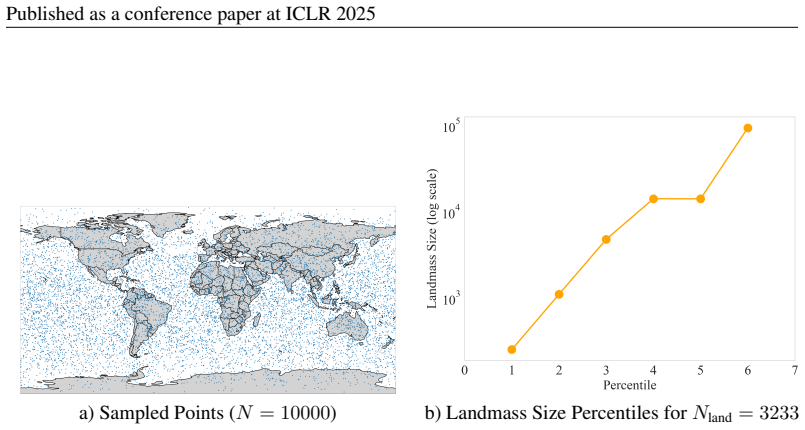
- ad hoc to paper Islands are defined as landmasses under 30,000 square miles, and coastline distance thresholds are set by the authors.
Cite this review
Pith. "Pith review of No Location Left Behind: Measuring and Improving the Fairness of Implicit Representations for Earth Data." pith.science (2026). https://pith.science/paper/ZAOYOQBP
@misc{pith2026250206831,
  author       = {Pith},
  title        = {Pith review of: No Location Left Behind: Measuring and Improving the Fairness of Implicit Representations for Earth Data},
  year         = {2026},
  howpublished = {\url{https://pith.science/paper/ZAOYOQBP}},
  note         = {Machine review of arXiv:2502.06831}
}
read the original abstract
Implicit neural representations (INRs) exhibit growing promise in addressing Earth representation challenges, ranging from emissions monitoring to climate modeling. However, existing methods disproportionately prioritize global average performance, whereas practitioners require fine-grained insights to understand biases and variations in these models. To bridge this gap, we introduce FAIR-Earth: a first-of-its-kind dataset explicitly crafted to examine and challenge inequities in Earth representations. FAIR-Earth comprises various high-resolution Earth signals and uniquely aggregates extensive metadata along stratifications like landmass size and population density to assess the fairness of models. Evaluating state-of-the-art INRs across the various modalities of FAIR-Earth, we uncover striking performance disparities. Certain subgroups, especially those associated with high-frequency signals (e.g., islands, coastlines), are consistently poorly modeled by existing methods. In response, we propose spherical wavelet encodings, building on previous spatial encoding research. Leveraging the multi-resolution capabilities of wavelets, our encodings yield consistent performance over various scales and locations, offering more accurate and robust representations of the biased subgroups. These open-source contributions represent a crucial step towards the equitable assessment and deployment of Earth INRs.
Figures


Figures from the paper (22 more)






Reference graph
Works this paper leans on
-
[1]
write newline
" write newline "" before.all 'output.state := FUNCTION n.dashify 't := "" t empty not t #1 #1 substring "-" = t #1 #2 substring "--" = not "--" * t #2 global.max substring 't := t #1 #1 substring "-" = "-" * t #2 global.max substring 't := while if t #1 #1 substring * t #2 global.max substring 't := if while FUNCTION format.date year duplicate empty "emp...
- [2]
-
[3]
Model error in weather and climate forecasting
Myles R Allen, JA Kettleborough, and DA Stainforth. Model error in weather and climate forecasting. In ECMWF Predictability of Weather and Climate Seminar, pp.\ 279--304. European Centre for Medium Range Weather Forecasts, Reading, UK, 2002
work page 2002
-
[4]
The Effects of Regularization and Data Augmentation are Class Dependent
Randall Balestriero, Leon Bottou, and Yann LeCun. The effects of regularization and data augmentation are class dependent, 2022. URL https://arxiv.org/abs/2204.03632
work page Pith review arXiv 2022
-
[5]
H. E. Beck, E. F. Wood, M. Pan, C. K. Fisher, D. G. Miralles, A. I. J. M. van Dijk, T. R. McVicar, and R. F. Adler. Mswep v2 global 3-hourly 0.1° precipitation: Methodology and quantitative assessment. Bulletin of the American Meteorological Society, 100: 0 473--500, 2019. doi:10.1175/BAMS-D-17-0138.1
-
[6]
Center for International Earth Science Information Network - CIESIN - Columbia University . Gridded population of the world, version 4 (gpwv4): Population density adjusted to match 2015 revision un wpp country totals, revision 11. Technical report, NASA Socioeconomic Data and Applications Center (SEDAC), Palisades, New York, 2018 a . Accessed 29 August, 2024
work page 2015
-
[7]
Center for International Earth Science Information Network - CIESIN - Columbia University . Gridded population of the world, version 4 (gpwv4): Population density adjusted to match 2015 revision un wpp country totals, revision 11, 2018 b . URL https://doi.org/10.7927/H4F47M65
-
[8]
Implicit Neural Spatial Representations for Time-dependent PDEs
Honglin Chen, Rundi Wu, Eitan Grinspun, Changxi Zheng, and Peter Yichen Chen. Implicit neural spatial representations for time-dependent pdes, 2023. URL https://arxiv.org/abs/2210.00124
work page Pith review arXiv 2023
Show all 52 references
-
[9]
Spatial implicit neural representations for global-scale species mapping
Elijah Cole, Grant Van Horn, Christian Lange, Alexander Shepard, Patrick Leary, Pietro Perona, Scott Loarie, and Oisin Mac Aodha. Spatial implicit neural representations for global-scale species mapping. In International Conference on Machine Learning, pp.\ 6320--6342. PMLR, 2023
2023
-
[10]
Gabor wavelets on the sphere
Laurent Demanet and Pierre Vandergheynst . Gabor wavelets on the sphere . In Michael A. Unser , Akram Aldroubi , and Andrew F. Laine (eds.), Wavelets: Applications in Signal and Image Processing X, volume 5207 of Society of Photo-Optical Instrumentation Engineers (SPIE) Confer...
2003 doi
-
[11]
A world of islands
C Depraetere, AL Dahl, and G Baldacchino. A world of islands. an island studies reader. 2007
2007
-
[12]
X. Dou, J. Hong, P. Ciais, et al. Near-real-time global gridded daily co2 emissions 2021. Scientific Data, 10: 0 69, 2023. doi:10.1038/s41597-023-01963-0
2021 doi
-
[13]
An introduction to Laplace transforms and Fourier series
Phil PG Dyke and PP Dyke. An introduction to Laplace transforms and Fourier series. Springer, 2001
2001
-
[14]
Flores, Timothy W
Aaron B. Flores, Timothy W. Collins, Sara E. Grineski, Mike Amodeo, Jeremy R. Porter, Christopher C. Sampson, and Oliver Wing. Federally overlooked flood risk inequities in houston, texas: Novel insights based on dasymetric mapping and state-of-the-art flood modeling. Annals o...
2022
-
[15]
Napier, Helen M
Andres Garcia-Silva, Jose Manuel Gomez-Perez, Raul Palma, Marcin Krystek, Simone Mantovani, Federica Foglini, Valentina Grande, Francesco De Leo, Stefano Salvi, Elisa Trasati, Vito Romaniello, Mirko Albani, Cristiano Silvagni, Rosemarie Leone, Fulvio Marelli, Sergio Albani, Mi...
2018 arXiv
-
[16]
Nvidia earth2studio, 2024
Nicholas Geneva and Dallas Foster. Nvidia earth2studio, 2024. URL https://github.com/NVIDIA/earth2studio
2024
-
[17]
Measurement of areas on a sphere using fibonacci and latitude–longitude lattices
Álvaro González. Measurement of areas on a sphere using fibonacci and latitude–longitude lattices. Mathematical Geosciences, 42 0 (1): 0 49–64, November 2009. ISSN 1874-8953. doi:10.1007/s11004-009-9257-x. URL http://dx.doi.org/10.1007/s11004-009-9257-x
2009 doi
-
[18]
Seismic Reservoir Modeling: Theory, Examples, and Algorithms
Dario Grana, Tapan Mukerji, and Philippe Doyen. Seismic Reservoir Modeling: Theory, Examples, and Algorithms. 04 2021. ISBN 9781119086215. doi:10.1002/9781119086215
2021 doi
-
[19]
The era5 global reanalysis, qj roy
H Hersbach, B Bell, P Berrisford, S Hirahara, A Hor \'a nyi, J Mu \ n oz-Sabater, J Nicolas, C Peubey, R Radu, D Schepers, et al. The era5 global reanalysis, qj roy. Meteor. Soc, 146 0 (730): 0 1999--985, 1999
1999
-
[20]
Geoinr 1.0: an implicit neural network approach to three-dimensional geological modelling
Michael Hillier, Florian Wellmann, Eric A de Kemp, Boyan Brodaric, Ernst Schetselaar, and Karine B \'e dard. Geoinr 1.0: an implicit neural network approach to three-dimensional geological modelling. Geoscientific Model Development, 16 0 (23): 0 6987--7012, 2023
2023
-
[21]
Huffman, D
G. Huffman, D. Bolvin, D. Braithwaite, K. Hsu, R. Joyce, and P. Xie. Integrated multi-satellite retrievals for gpm (imerg), version 4.4. Technical report, NASA's Precipitation Processing Center, 2014. URL ftp://arthurhou.pps.eosdis.nasa.gov/gpmdata/. Accessed 29 August, 2024
2014
-
[22]
D. N. Karger, O. Conrad, J. Böhner, T. Kawohl, H. Kreft, R. W. Soria-Auza, N. E. Zimmermann, P. Linder, and M. Kessler. Climatologies at high resolution for the earth land surface areas. Scientific Data, 4: 0 170122, 2017. doi:10.1038/sdata.2017.122
2017 doi
-
[23]
Climate endgame: Exploring catastrophic climate change scenarios
Luke Kemp, Chi Xu, Joanna Depledge, Kristie L Ebi, Goodwin Gibbins, Timothy A Kohler, Johan Rockstr \"o m, Marten Scheffer, Hans Joachim Schellnhuber, Will Steffen, and Timothy M Lenton. Climate endgame: Exploring catastrophic climate change scenarios. Proceedings of the Natio...
2022 doi
-
[24]
Understanding the detrimental class-level effects of data augmentation, 2023
Polina Kirichenko, Mark Ibrahim, Randall Balestriero, Diane Bouchacourt, Ramakrishna Vedantam, Hamed Firooz, and Andrew Gordon Wilson. Understanding the detrimental class-level effects of data augmentation, 2023. URL https://arxiv.org/abs/2401.01764
2023 arXiv
-
[25]
An efficient implicit neural representation image codec based on mixed autoregressive model for low-complexity decoding, 2024
Xiang Liu, Jiahong Chen, Bin Chen, Zimo Liu, Baoyi An, Shu-Tao Xia, and Zhi Wang. An efficient implicit neural representation image codec based on mixed autoregressive model for low-complexity decoding, 2024. URL https://arxiv.org/abs/2401.12587
2024 arXiv
-
[26]
Multi-scale representation learning for spatial feature distributions using grid cells, 2020
Gengchen Mai, Krzysztof Janowicz, Bo Yan, Rui Zhu, Ling Cai, and Ni Lao. Multi-scale representation learning for spatial feature distributions using grid cells, 2020. URL https://arxiv.org/abs/2003.00824
2020 arXiv
-
[27]
A review of location encoding for geoai: methods and applications
Gengchen Mai, Krzysztof Janowicz, Yingjie Hu, Song Gao, Bo Yan, Rui Zhu, Ling Cai, and Ni Lao. A review of location encoding for geoai: methods and applications. International Journal of Geographical Information Science, 36 0 (4): 0 639–673, January 2022. ISSN 1362-3087. doi:1...
2022
-
[28]
Sphere2vec: A general-purpose location representation learning over a spherical surface for large-scale geospatial predictions, 2023
Gengchen Mai, Yao Xuan, Wenyun Zuo, Yutong He, Jiaming Song, Stefano Ermon, Krzysztof Janowicz, and Ni Lao. Sphere2vec: A general-purpose location representation learning over a spherical surface for large-scale geospatial predictions, 2023. URL https://arxiv.org/abs/2306.17624
2023 arXiv
-
[29]
A wavelet tour of signal processing
Stephane Mallat. A wavelet tour of signal processing. Academic Press, 1999
1999
-
[30]
McEwen, Michael P
Jason D. McEwen, Michael P. Hobson, Daniel J. Mortlock, and Anthony N. Lasenby. Fast directional continuous spherical wavelet transform algorithms. IEEE Transactions on Signal Processing, 55 0 (2): 0 520–529, February 2007. ISSN 1053-587X. doi:10.1109/tsp.2006.887148. URL http...
2007
-
[31]
Srinivasan, Matthew Tancik, Jonathan T
Ben Mildenhall, Pratul P. Srinivasan, Matthew Tancik, Jonathan T. Barron, Ravi Ramamoorthi, and Ren Ng. Nerf: Representing scenes as neural radiance fields for view synthesis, 2020. URL https://arxiv.org/abs/2003.08934
2020 arXiv
-
[32]
Implicit neural representation in medical imaging: A comparative survey, 2023
Amirali Molaei, Amirhossein Aminimehr, Armin Tavakoli, Amirhossein Kazerouni, Bobby Azad, Reza Azad, and Dorit Merhof. Implicit neural representation in medical imaging: A comparative survey, 2023. URL https://arxiv.org/abs/2307.16142
2023 arXiv
-
[33]
Munday and R
C. Munday and R. Washington. Systematic climate model rainfall biases over southern africa: Links to moisture circulation and topography. Journal of Climate, 31 0 (18): 0 7533--7548, 2018. doi:10.1175/JCLI-D-18-0008.1. URL https://doi.org/10.1175/JCLI-D-18-0008.1
2018 doi
-
[34]
R. E. Murphy, Phillip Ardanuy, Frank J. Deluccia, J. E. Clement, and Carl F. Schueler. The Visible Infrared Imaging Radiometer Suite, pp.\ 199--223. Springer Berlin Heidelberg, Berlin, Heidelberg, 2006. ISBN 978-3-540-37293-6. doi:10.1007/978-3-540-37293-6_11. URL https://doi....
2006 doi
-
[35]
Shuttle radar topography mission (srtm) global
NASA Shuttle Radar Topography Mission . Shuttle radar topography mission (srtm) global. https://doi.org/10.5069/G9445JDF, 2013. URL https://doi.org/10.5069/G9445JDF. Distributed by OpenTopography
2013 doi
-
[36]
OCO-2 Level 2 bias-corrected XCO2 and other select fields from the full-physics retrieval aggregated as daily files , 2020
OCO-2 Science Team/Michael Gunson, Annmarie Eldering . OCO-2 Level 2 bias-corrected XCO2 and other select fields from the full-physics retrieval aggregated as daily files , 2020. URL https://disc.gsfc.nasa.gov/datasets/OCO2_L2_Lite_FP_10r/summary
2020
-
[37]
C. W. O'Dell, A. Eldering, P. O. Wennberg, D. Crisp, M. R. Gunson, B. Fisher, C. Frankenberg, M. Kiel, H. Lindqvist, L. Mandrake, A. Merrelli, V. Natraj, R. R. Nelson, G. B. Osterman, V. H. Payne, T. E. Taylor, D. Wunch, B. J. Drouin, F. Oyafuso, A. Chang, J. McDuffie, M. Smyt...
2018
-
[38]
Planet dump retrieved from https://planet.osm.org
OpenStreetMap contributors . Planet dump retrieved from https://planet.osm.org . https://www.openstreetmap.org , 2017
2017
-
[39]
Palecki, J.H
M.A. Palecki, J.H. Lawrimore, R.D. Leeper, J.E. Bell, S. Embler, and N. Casey. U.s. climate reference network products, 2013. Accessed 29 August, 2024
2013
-
[40]
Physics informed deep learning (part i): Data-driven solutions of nonlinear partial differential equations, 2017
Maziar Raissi, Paris Perdikaris, and George Em Karniadakis. Physics informed deep learning (part i): Data-driven solutions of nonlinear partial differential equations, 2017. URL https://arxiv.org/abs/1711.10561
2017 arXiv
-
[41]
Geographic location encoding with spherical harmonics and sinusoidal representation networks, 2024
Marc Rußwurm, Konstantin Klemmer, Esther Rolf, Robin Zbinden, and Devis Tuia. Geographic location encoding with spherical harmonics and sinusoidal representation networks, 2024. URL https://arxiv.org/abs/2310.06743
2024 arXiv
-
[42]
J. L. Sanz, D. Herranz, M. Lopez-Caniego, and F. Argueso. Wavelets on the sphere. application to the detection problem, 2006. URL https://arxiv.org/abs/astro-ph/0609351
2006 arXiv
-
[43]
Baraniuk
Vishwanath Saragadam, Daniel LeJeune, Jasper Tan, Guha Balakrishnan, Ashok Veeraraghavan, and Richard G. Baraniuk. Wire: Wavelet implicit neural representations, 2023. URL https://arxiv.org/abs/2301.05187
2023 arXiv
-
[44]
Implicit neural representations with periodic activation functions
Vincent Sitzmann, Julien Martel, Alexander Bergman, David Lindell, and Gordon Wetzstein. Implicit neural representations with periodic activation functions. Advances in neural information processing systems, 33: 0 7462--7473, 2020
2020
-
[45]
Noaa climate data record (cdr) of precipitation estimation from remotely sensed information using artificial neural networks (persiann-cdr), version 1 revision 1, 2014
Soroosh Sorooshian, Kuolin Hsu, Dan Braithwaite, Hamed Ashouri, and NOAA CDR Program . Noaa climate data record (cdr) of precipitation estimation from remotely sensed information using artificial neural networks (persiann-cdr), version 1 revision 1, 2014. Accessed 29 August, 2024
2014
-
[46]
Epistemic uncertainty-weighted loss for visual bias mitigation, 2024
Rebecca S Stone, Nishant Ravikumar, Andrew J Bulpitt, and David C Hogg. Epistemic uncertainty-weighted loss for visual bias mitigation, 2024. URL https://arxiv.org/abs/2204.09389
2024 arXiv
-
[47]
T. E. Taylor, C. W. O'Dell, A. Eldering, D. Crisp, B. M. Fisher, M. R. Gunson, R. R. Basilio, F. Kronk, M. Kiel, L. Kuai, G. B. Osterman, R. R. Nelson, V. H. Payne, P. O. Wennberg, D. Wunch, and J. Ziegler. The oco-3 retrievals and data products. Atmospheric Measurement Techni...
2023 doi
-
[48]
Timl: Task-informed meta-learning for agriculture, 2022
Gabriel Tseng, Hannah Kerner, and David Rolnick. Timl: Task-informed meta-learning for agriculture, 2022. URL https://arxiv.org/abs/2202.02124
2022 arXiv
-
[49]
Signal processing for implicit neural representations, 2022
Dejia Xu, Peihao Wang, Yifan Jiang, Zhiwen Fan, and Zhangyang Wang. Signal processing for implicit neural representations, 2022. URL https://arxiv.org/abs/2210.08772
2022 arXiv
-
[50]
@esa (Ref
\@ifxundefined[1] #1\@undefined \@firstoftwo \@secondoftwo \@ifnum[1] #1 \@firstoftwo \@secondoftwo \@ifx[1] #1 \@firstoftwo \@secondoftwo [2] @ #1 \@temptokena #2 #1 @ \@temptokena \@ifclassloaded agu2001 natbib The agu2001 class already includes natbib coding, so you should ...
-
[51]
\@lbibitem[] @bibitem@first@sw\@secondoftwo \@lbibitem[#1]#2 \@extra@b@citeb \@ifundefined br@#2\@extra@b@citeb \@namedef br@#2 \@nameuse br@#2\@extra@b@citeb \@ifundefined b@#2\@extra@b@citeb @num @parse #2 @tmp #1 NAT@b@open@#2 NAT@b@shut@#2 \@ifnum @merge>\@ne @bibitem@firs...
-
[52]
@open @close @open @close and [1] URL: #1 \@ifundefined chapter * \@mkboth \@ifxundefined @sectionbib * \@mkboth * \@mkboth\@gobbletwo \@ifclassloaded amsart * \@ifclassloaded amsbook * \@ifxundefined @heading @heading NAT@ctr thebibliography [1] @ \@biblabel @NAT@ctr \@bibset...
Reviewed August 9, 2026 · model on record in the stance chip above.
Discussion (0). Continue with ORCID to comment.