REVIEW 5 major objections 6 minor 18 references
Accident-Driven Congestion Prediction and Simulation: An Explainable Framework Using Advanced Clustering and Bayesian Networks
T0 review · 5 major / 6 minor · reviewed 2026-08-06 · deepseek-v4-flash
Pith's one-line read An explainable pipeline using AutoML-tuned clustering and a Bayesian network predicts accident-driven congestion with 95.6% accuracy.
desk verdict The 95.6% accuracy claim is circular: the BN is trained and evaluated on the authors' own cluster labels, not against real congestion, and the SUMO validation is internally inconsistent. read the letter →
The pith
A machine-rendered reading of the paper's core claim, the machinery that carries it, and where it could break.
The reading
What carries the argument
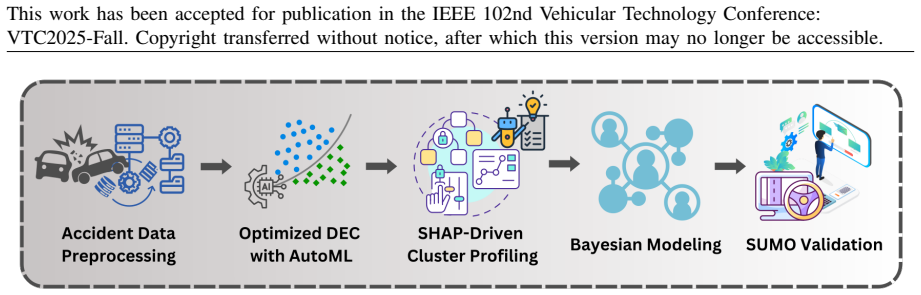
The load-bearing mechanism is the pairing of Deep Embedded Clustering (DEC) with AutoML hyperparameter optimization to create the target labels, and a Bayesian Network (BN) to do the probabilistic prediction. DEC is a deep autoencoder with a clustering layer; the encoder maps 23 accident features into 19 latent features, and the clustering loss separates the data into two groups. Shapley-value attribution then links the latent clusters back to original features so the two clusters can be interpreted and named High and Low Congestion. The BN is a 14-node directed acyclic graph with conditional probability tables learned under structural constraints, and it is queried with accident evidence to output congestion-state probabilities. SUMO simulation provides the external check: four evidence-based accident scenarios are recreated and their queue lengths, waiting times, and speeds are compared with the BN's probabilities.
What would settle it
Take the same 50,000 accident records and pair each with an independent congestion measurement, such as average travel speed or queue length from loop detectors or GPS probes at the accident time and location. If the BN's congestion-state predictions agree with the Shapley-derived labels but agree no better than chance with the measured congestion, the central accuracy claim would be refuted as a claim about real congestion.
Extended reading notes
Core claim
On the paper's own terms, the discovery is that accident-driven congestion can be treated as a two-state problem—High versus Low Congestion—learned without hand-labeled ground truth. The authors report that DEC with AutoML hyperparameter optimization yields a silhouette score of 0.49 at two clusters, higher than traditional methods, and that Shapley-value analysis of the features permits naming the clusters. A Bayesian network built over 14 accident variables then predicts the congestion state with 95.64% overall accuracy, 99.02% sensitivity for high congestion, and 82.97% specificity. Scenario queries show sensible reasoning—fatal severity raises high-congestion probability from 48.08% to 79.88%, and junction proximity raises it to 98.12%—and SUMO simulations of the same scenarios produce waiting times and queue lengths that the authors read as close agreement with the network's probabilities.
Load-bearing premise
The load-bearing premise is that the two clusters produced by AutoML-tuned DEC, labeled High and Low Congestion through Shapley-value feature weights, really correspond to high and low congestion in the real world; if that labeling is arbitrary, the reported accuracy only measures how well the Bayesian network reproduces the clustering, not how well it predicts congestion.
Editorial extensions
If this is right
- If the 95.6% accuracy holds, traffic operators could feed accident attributes such as severity, junction proximity, crossing presence, and peak hour into the BN and receive an explicit congestion probability for both states.
- The two-state labeling could replace manual hotspot mapping with an automated, data-driven congestion typology for accident records.
- The scenario results imply that severity and junction proximity are the dominant levers, so targeting those locations with signal timing or quick-response measures would address the highest-probability congestion cases.
- Because the BN is probabilistic and explainable, its outputs could be audited by a human operator, which is a practical advantage over black-box classifiers in traffic-management centers.
- The SUMO validation suggests the model could serve as a cheap pre-screening step before running full microsimulations.
Reading between the lines
- The 95.6% accuracy is a measure of how well the BN reproduces the AutoML-DEC cluster assignments, not of agreement with independently measured congestion; a real-world deployment would need ground-truth congestion labels such as speed or delay data to confirm the cluster names are meaningful.
- The four SUMO scenarios are consistent with the claim but far from a statistical proof, so a natural extension is to simulate a larger random sample of accidents and correlate BN probabilities with continuous SUMO metrics.
- The same AutoML-optimized clustering plus BN pipeline could be transferred to other cities, but the Shapley-value-based labels would need to be re-established per region because the paper notes its U.S.-based data carries regional bias.
- The framework's explainability could be leveraged for adaptive control: instead of only predicting congestion, the BN's conditional probabilities could feed a reinforcement-learning traffic-signal agent that anticipates accident-driven surges.
Signed reviews
Editorial analysis
A structured set of objections, weighed in public.
Referee Report
Summary. The paper proposes an accident-driven congestion prediction framework that combines AutoML-optimized Deep Embedding Clustering (DEC) with SHAP-based cluster profiling, a 14-variable Bayesian Network for congestion probability inference, and SUMO simulation for validation. The authors report that DEC+AutoML achieves a silhouette score of 0.49, the BN reaches 95.64% overall accuracy on two congestion classes, and four scenario-based SUMO simulations broadly confirm the BN predictions.
Significance. If the reported validation were sound, the framework could be a practically useful, explainable tool for accident-driven congestion management. The paper has several commendable elements: the systematic comparison with k-means, DBSCAN, and hierarchical clustering; the use of AutoML to tune DEC; the SHAP-based attempt at interpretability; and the effort to ground probabilistic predictions in SUMO traffic simulation. However, the headline quantitative claims are not supported because the BN is trained and evaluated on target labels that the authors themselves generate, and the external SUMO validation is internally inconsistent. The current contribution is best viewed as a prototype pipeline rather than a validated prediction method.
major comments (5)
- [V-C and V-D] The target variable for the BN is not an independent congestion measurement. Section V-C assigns cluster labels by interpreting SHAP values, and then states that 'congestion serves as a target label.' Section V-D then reports 95.64% accuracy, 99.02% sensitivity, and 82.97% specificity against these self-generated labels. No external ground truth such as measured speed, delay, occupancy, or a manually labeled congestion set is used. Consequently, the reported accuracy measures how well the BN reproduces the authors' cluster assignments, not how well it predicts real congestion. This circularity makes the central predictive claim unsupported.
- [Table III vs. Table IV (Section V-D/V-E)] The scenario probabilities are internally inconsistent. Table III for Scenario 3 gives Low (51.74%) and High (48.26%), yet Table IV and the Section V-E text report the BN Congestion Prediction as High (57.01%) for the same scenario. Section V-D also states that 'scenarios 3 and 4 show ... a 98.12% chance of causing high congestion,' which is only true for Scenario 4. Table III Scenario 1 gives Low 51.92%, while Table IV gives Low 51.96%. These discrepancies indicate that the scenario evaluation, which is central to the paper's practical claims, is not reproducible as written.
- [Table IV (Section V-E)] The SUMO metrics do not support the claim that SUMO and BN predictions are 'closely aligned.' Scenario 1 is labeled Low Congestion with BN Low 51.96%, while Scenario 3 is labeled High Congestion with BN High 57.01%; however, their SUMO metrics are nearly identical: AQL 4.6 vs. 4.6, AWT 42.8 vs. 42.6, MQL 6 vs. 6, QL 45 vs. 40, and SCI 0.35 vs. 0.30. In several metrics the supposedly low-congestion scenario is worse than the supposedly high-congestion scenario. Scenario 4, with the highest BN probability of 98.12%, has an Average Queue Length of 4.3, which is lower than Scenario 1's 4.6. This pattern contradicts the claimed alignment and undermines the simulation-based validation.
- [V-D] No evaluation protocol is described for the BN metrics in Table II. There is no train/test split, no cross-validation, no confidence intervals, and no error bars, and the text does not state whether the accuracy is computed on the training data. Given that the congestion labels themselves are derived from the same data used to learn the BN structure, the reported figures are likely optimistic. The paper should specify the evaluation protocol and report variance across runs or folds.
- [V-C] The SHAP-based labeling contains a direct contradiction that affects the definition of both target labels. The text states that 'traffic signals exhibit negative SHAP values, as they negatively impact congestion for cluster 0,' but two sentences later it claims Cluster 0 is labeled High Congestion because of 'high positive SHAP values, as seen in Fig. 6, of features like traffic signal, junction, crossing, precipitation, severity, and severe weather.' A reader cannot determine whether traffic signal contributes positively or negatively to the high-congestion label. This needs to be corrected and the directional reasoning justified before the labels can be trusted.
minor comments (6)
- [V-D] The text says 'BN models' precession, recall, and F1 scores' but should read 'precision, recall, and F1 scores.'
- [V-E] The phrase 'highest weighting time of 89.3 seconds' should be 'highest waiting time of 89.3 seconds.'
- [III-A] The dataset description says '1.3 billion accidents across 49 states of the USA,' which is implausible for the US Accidents dataset and likely a typo for 1.3 million or 7.7 million; please correct the number.
- [IV-B] Reference [18] is cited for SUMO but points to a paper about Markov traffic models, not the SUMO simulator; the authors should cite the original SUMO documentation or the standard SUMO reference.
- [IV-B] Table IV reports RMSE values without defining the reference quantity or explaining how RMSE is computed across SUMO metrics; please clarify.
- [V-B] Table I shows silhouette scores for varying numbers of clusters, but the paper does not state how many random seeds or repeated runs were used; providing this information would strengthen the comparison.
Circularity Check
BN 'congestion prediction' accuracy measures reproduction of the authors' own cluster labels; no independent ground truth is used.
-
fitted input called prediction
[Section V-C (Cluster Profiling and Feature Explainability Using SHAP Analysis) and Section V-D (Table II)]
"Cluster 0 with high positive SHAP values, as seen in Fig. 6, of features like traffic signal, junction, crossing, precipitation, severity, and severe weather are labeled as High Congestion ... The practical assignment of congestion labels enhances the interpretability of clustering. This step is crucial before BN prediction, as congestion serves as a target label. ... The proposed BN model achieved a remarkable accuracy of 95.64% and a true positive rate of 99.02% because it perfectly predicts high congestion instances."
The BN's target variable is not an external congestion measurement; it is the two DEC+AutoML clusters renamed 'High Congestion' and 'Low Congestion' based on the sign of SHAP values. The paper itself says 'congestion serves as a target label' directly after describing that SHAP-based labeling. The BN is therefore trained and evaluated to predict labels the authors constructed from the same accident features. The 95.64% accuracy measures how well the BN reproduces the authors' cluster assignment, not how well it predicts real-world congestion. No independent ground truth (speed, delay, occupancy, or a validated congestion label) enters the accuracy calculation, so the headline prediction reduces to a self-consistency check by construction.
full rationale
The central quantitative claim is the BN's 95.64% accuracy for 'congestion prediction'. Tracing the derivation: Section V-B clusters accident features with DEC+AutoML; Section V-C converts the two clusters into congestion labels by reading SHAP value directions; Section V-C then states 'congestion serves as a target label' for the BN; Section V-D reports accuracy against that target. Thus the congestion variable is constructed by the authors from the same accident features and is not independently measured or validated. The reported accuracy is therefore internal consistency with the authors' cluster assignment, not predictive validity for externally observed congestion. The SUMO validation (Section V-E, Table IV) is qualitative and does not supply an independent label or threshold; furthermore, Scenario 3 (BN High 57.01%) has SUMO metrics (AQL 4.6, AWT 42.6, MQL 6, QL 40, SCI 0.30) nearly identical to Scenario 1 (BN Low, AQL 4.6, AWT 42.8, MQL 6, QL 45, SCI 0.35), so it cannot break the by-construction relationship. Self-citations [4] and [12] are present but not load-bearing: the claimed prediction does not rest on a cited uniqueness theorem or ansatz. The paper is partially circular because the headline prediction metric reduces to reproducing self-assigned labels.
Assumptions & free parameters
free parameters (3)
- Number of clusters (K) =
2
- DEC hyperparameters (learning rate, batch size, epochs, latent dimension, hidden units) =
lr=0.0002, batch_size=64, epochs=50, latent=19, hidden units/layers reported as '190 hidden layers' in text
- Discretization thresholds for continuous features in BN =
Not reported
assumptions (4)
- domain assumption The 50,000-record 2022 subset is representative of US accident-congestion relationships.
- ad hoc to paper SHAP feature attribution can correctly map abstract latent clusters to real congestion states.
- domain assumption SUMO simulations faithfully reproduce the congestion impact of the modeled accidents.
- domain assumption The selected features (severity, junction, crossing, peak hours, accident duration, etc.) are sufficient to determine congestion level.
Cite this review
Pith. "Pith review of Accident-Driven Congestion Prediction and Simulation: An Explainable Framework Using Advanced Clustering and Bayesian Networks." pith.science (2026). https://pith.science/paper/ZHIS3VBA
@misc{pith2026250722529,
  author       = {Pith},
  title        = {Pith review of: Accident-Driven Congestion Prediction and Simulation: An Explainable Framework Using Advanced Clustering and Bayesian Networks},
  year         = {2026},
  howpublished = {\url{https://pith.science/paper/ZHIS3VBA}},
  note         = {Machine review of arXiv:2507.22529}
}
read the original abstract
Traffic congestion due to uncertainties, such as accidents, is a significant issue in urban areas, as the ripple effect of accidents causes longer delays, increased emissions, and safety concerns. To address this issue, we propose a robust framework for predicting the impact of accidents on congestion. We implement Automated Machine Learning (AutoML)-enhanced Deep Embedding Clustering (DEC) to assign congestion labels to accident data and predict congestion probability using a Bayesian Network (BN). The Simulation of Urban Mobility (SUMO) simulation is utilized to evaluate the correctness of BN predictions using evidence-based scenarios. Results demonstrate that the AutoML-enhanced DEC has outperformed traditional clustering approaches. The performance of the proposed BN model achieved an overall accuracy of 95.6%, indicating its ability to understand the complex relationship of accidents causing congestion. Validation in SUMO with evidence-based scenarios demonstrated that the BN model's prediction of congestion states closely matches those of SUMO, indicating the high reliability of the proposed BN model in ensuring smooth urban mobility.
Figures


Figures from the paper (4 more)


Reference graph
Works this paper leans on
-
[1]
Machine learning approaches to traffic accident analysis and hotspot prediction,
D. Santos, J. Saias, P. Quaresma, and V . B. Nogueira, “Machine learning approaches to traffic accident analysis and hotspot prediction,” Computers, vol. 10, no. 12, p. 157, 2021
work page 2021
-
[2]
A probabilistic estimation of traffic congestion using bayesian network,
T. Afrin and N. Yodo, “A probabilistic estimation of traffic congestion using bayesian network,” Measurement, vol. 174, p. 109051, 2021
work page 2021
-
[3]
Traffic congestion propagation inference using dynamic bayesian graph convo- lution network,
S. Luan, R. Ke, Z. Huang, and X. Ma, “Traffic congestion propagation inference using dynamic bayesian graph convo- lution network,” Transportation research part C: emerging technologies, vol. 135, p. 103526, 2022
work page 2022
-
[4]
Bayesian network for analysis and prediction of traffic congestion using the accident data
K. K. Talluri and G. Weidl, “Bayesian network for analysis and prediction of traffic congestion using the accident data.” in VEHITS, 2024, pp. 19–30
2024
-
[5]
Intensity of traffic due to road accidents in us: A predictive model,
P. Mudgil and I. Joshi, “Intensity of traffic due to road accidents in us: A predictive model,” in International Conference on Innovative Computing and Communications: Proceedings of ICICC 2021, Volume 3 . Springer, 2022, pp. 43–50. © 2025 IEEE. Personal use of this material is permitted. Permission from IEEE must be obtained for all other uses, in any cu...
work page 2021
-
[6]
M. Manzoor, M. Umer, S. Sadiq, A. Ishaq, S. Ullah, H. A. Madni, and C. Bisogni, “Rfcnn: Traffic accident severity pre- diction based on decision level fusion of machine and deep learning model,” IEEE Access , vol. 9, pp. 128 359–128 371, 2021
work page 2021
-
[7]
Clustering algorithms to analyze the road traffic crashes,
M. R. Islam, I. J. Jenny, M. Nayon, M. R. Islam, M. Amiruz- zaman, and M. Abdullah-Al-Wadud, “Clustering algorithms to analyze the road traffic crashes,” in 2021 International Con- ference on Science & Contemporary Technologies (ICSCT) . IEEE, 2021, pp. 1–6
work page 2021
-
[8]
R. Zhou, H. Huang, J. Lee, X. Huang, J. Chen, and H. Zhou, “Identifying typical pre-crash scenarios based on in-depth crash data with deep embedded clustering for autonomous vehicle safety testing,” Accident Analysis & Prevention , vol. 191, p. 107218, 2023
work page 2023
Show all 18 references
-
[9]
Optimal ambulance positioning for road accidents with deep embedded clustering,
D. D. Desai, J. Dey, S. K. Satapathy, S. Mishra, S. N. Mohanty, P. Mishra, and S. K. Panda, “Optimal ambulance positioning for road accidents with deep embedded clustering,” IEEE Access, vol. 11, pp. 59 917–59 934, 2023
2023
-
[10]
Determinants of the congestion caused by a traffic accident in urban road networks,
Z. Zheng, Z. Wang, L. Zhu, and H. Jiang, “Determinants of the congestion caused by a traffic accident in urban road networks,” Accident Analysis & Prevention , vol. 136, p. 105327, 2020
2020
-
[11]
Exploring the spatial effects on the level of congestion caused by traffic accidents in urban road networks: A case study of beijing,
Z. Zheng, Z. Wang, S. Liu, and W. Ma, “Exploring the spatial effects on the level of congestion caused by traffic accidents in urban road networks: A case study of beijing,” Travel behaviour and society , vol. 35, p. 100728, 2024
2024
-
[12]
Impact of accidents on traffic con- gestions: A bayesian network approach using real city data,
K. K. Talluri and G. Weidl, “Impact of accidents on traffic con- gestions: A bayesian network approach using real city data,” in Emerging Cutting-Edge Applied Research and Development in Intelligent Traffic and Transportation Systems . IOS Press, 2024, pp. 64–78
2024
-
[13]
Exploring road traffic accidents hotspots using clus- tering algorithms and gis-based spatial analysis,
H. Kamh, S. H. Alyami, A. Khattak, M. Alyami, and H. Al- mujibah, “Exploring road traffic accidents hotspots using clus- tering algorithms and gis-based spatial analysis,” IEEE Access, 2024
2024
-
[14]
Short- term traffic prediction based on deepcluster in large-scale road networks,
L. Han, K. Zheng, L. Zhao, X. Wang, and X. Shen, “Short- term traffic prediction based on deepcluster in large-scale road networks,” IEEE Transactions on Vehicular Technology , vol. 68, no. 12, pp. 12 301–12 313, 2019
2019
-
[15]
Upper mid-band spectrum for 6g: Vision, opportunity and challenges,
A. Bazzi, R. Bomfin, M. Mezzavilla, S. Rangan, T. Rappaport, and M. Chafii, “Upper mid-band spectrum for 6g: Vision, opportunity and challenges,” arXiv preprint arXiv:2502.17914, 2025
2025 arXiv
-
[16]
Accident risk prediction based on het- erogeneous sparse data: New dataset and insights,
S. Moosavi, M. H. Samavatian, S. Parthasarathy, R. Teodor- escu, and R. Ramnath, “Accident risk prediction based on het- erogeneous sparse data: New dataset and insights,” in Proceed- ings of the 27th ACM SIGSPATIAL international conference on advances in geographic informatio...
2019
-
[17]
Bayesian networks and influence diagrams,
U. B. Kjaerulff and A. L. Madsen, “Bayesian networks and influence diagrams,” Springer Science+ Business Media , vol. 200, p. 114, 2008
2008
-
[18]
A markov traffic model for signalized traffic networks based on bayesian estimation,
S. Liu, S. Lin, Y . Wang, B. De Schutter, and W. Lam, “A markov traffic model for signalized traffic networks based on bayesian estimation,” IFAC-PapersOnLine, vol. 53, no. 2, pp. 15 029–15 034, 2020. © 2025 IEEE. Personal use of this material is permitted. Permission from IEE...
2020
Reviewed August 6, 2026 · model on record in the stance chip above.
Discussion (0). Continue with ORCID to comment.