REVIEW 3 major objections 6 minor 19 references
Impute With Confidence: A Framework for Uncertainty Aware Multivariate Time Series Imputation
T0 review · 3 major / 6 minor · reviewed 2026-08-06 · deepseek-v4-flash
Pith's one-line read The paper's central claim is that Monte Carlo dropout variance measures imputation confidence well enough that a threshold-based selective imputation framework can reduce imputation error and, in some cases, improve downstream mortality…
desk verdict MC dropout uncertainty correlates cleanly with imputation error on ICU data, but the selective-imputation downstream claim rests entirely on validation-set AUPRC with thresholds chosen on that same set, so the benefit is not yet established. read the letter →
The pith
A machine-rendered reading of the paper's core claim, the machinery that carries it, and where it could break.
The reading
What carries the argument
The central object is the Monte Carlo dropout uncertainty estimate: after training, the model runs $F$ forward passes with dropout enabled, and the standard deviation of the predicted values at each time step and variable is taken as the uncertainty $U \in \mathbb{R}^{T \times D}$. The threshold set $U$ is the collection of these uncertainties at positions that were synthetically masked during validation, and quantiles $t_{10}, t_{20}, \dots, t_{100}$ become the operating points for selective imputation. This object carries the argument because it links model confidence to observable error, and the calibration step is what turns the uncertainty measure into a decision rule.
What would settle it
Take a dataset with completely recorded ground truth, train an imputation model, then compare the uncertainty-to-error relationship for synthetically masked positions with the same relationship for positions that were genuinely missing but whose true values can later be recovered, for example from a redundant sensor; if the monotone increase of error with uncertainty disappears or flips on the genuine missing values, or if imputing only the lowest-uncertainty genuine missing values gives no error reduction over random selection, the framework's calibration does not transfer.
Extended reading notes
Core claim
The central claim is that the elementwise standard deviation of Monte Carlo dropout forward passes is a faithful uncertainty measure for deep time series imputation models, and that this uncertainty can be used to impute selectively. Across MIMIC-IV, eICU, and HiRID, and across five synthetic missingness patterns, the paper shows that mean absolute error on imputed values increases with the uncertainty threshold, typically in a near-linear fashion, so that the model's least certain imputations are its least accurate. The framework calibrates thresholds t10, t20, ..., t100 on synthetically masked validation positions, then at inference time imputes only missing values whose uncertainty falls below the chosen threshold. The paper reports that in the clearest experiments (block blackout on eICU, MCAR on HiRID) the downstream 24-hour mortality classifier performs best with selective imputation rather than full imputation, and states more generally that choosing not to impute highly uncertain values can improve downstream performance in certain cases.
Load-bearing premise
The thresholds chosen from synthetically masked validation values are assumed to stay meaningful when the model imputes genuinely missing values, so that uncertainty and error remain coupled on the real missingness at inference.
Editorial extensions
If this is right
- Any deep imputation model with dropout layers can obtain an uncertainty map at inference time by running $F$ forward passes and taking the standard deviation, without changing the architecture or the loss.
- Setting an uncertainty threshold turns the imputer into a selective imputer: values above the threshold are left missing, which reduces mean absolute error on the values actually imputed.
- In configurations where the synthetic training missingness resembles the real missingness, such as block blackout on eICU, a mid-range threshold like the 60th percentile can give better downstream AUPRC than either full imputation or no imputation.
- Because the uncertainty measure is calibrated with quantiles $t_{10}, t_{20}, \dots, t_{100}$, the framework gives practitioners a simple knob to trade imputation coverage against imputation reliability.
Reading between the lines
- The paper leaves open whether the thresholds chosen on synthetically masked validation values still separate good from bad imputations when the model faces genuinely missing values at inference, since no experiment compares uncertainty distributions or optimal thresholds between the two settings.
- A natural extension would be to amortize the multiple forward passes or study how small $F$ can become before the uncertainty ranking degrades, which would address the inference-time cost the paper identifies as a limitation.
- The 'certain cases' phrasing implies selective imputation is not always beneficial; a practical rule for when to expect gains would need to connect the benefit to the similarity between the training missingness type and the real missingness, which the paper flags as a possible explanation but does not establish.
Editorial analysis
A structured set of objections, weighed in public.
Referee Report
Summary. The paper proposes a framework for uncertainty-aware multivariate time series imputation based on Monte Carlo dropout. For a given imputation model, the standard deviation across stochastic forward passes is used as an uncertainty estimate, thresholds are calibrated on synthetically masked validation values, and only missing values with uncertainty below a threshold are imputed. Experiments on MIMIC-IV, eICU, and HiRID with two architectures and five synthetic missingness mechanisms show a monotone relationship between uncertainty and imputation error, and selected downstream mortality-prediction experiments suggest that selective imputation can improve AUPRC.
Significance. If the claims are supported, the framework would be practically valuable because it applies to a broad class of deep imputation models without altering the architecture and does not fit the uncertainty measure to the downstream outcome, so the core uncertainty-error correlation claim is not circular. The breadth of the empirical sweep—three EHR datasets, two model families, and five missingness mechanisms—is a strength. However, the downstream benefit is currently established only on validation data with thresholds selected on the same data, and the transfer of synthetic-mask thresholds to genuine missingness is assumed rather than tested; these gaps are central to the paper's stated practical contribution.
major comments (3)
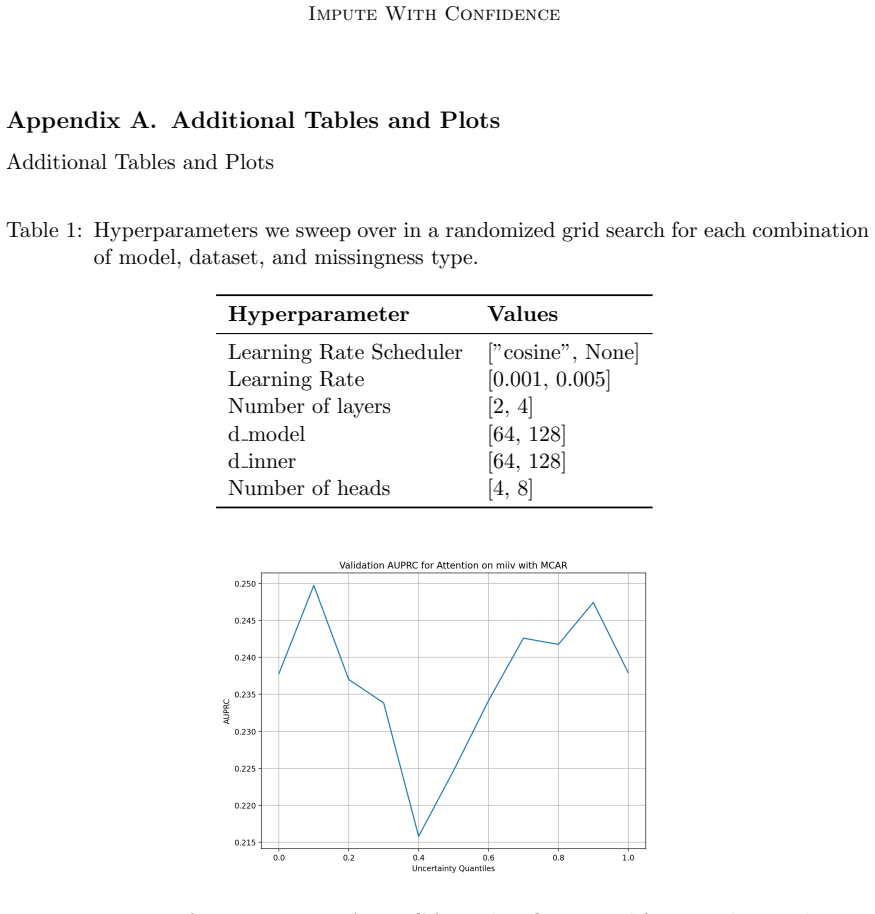
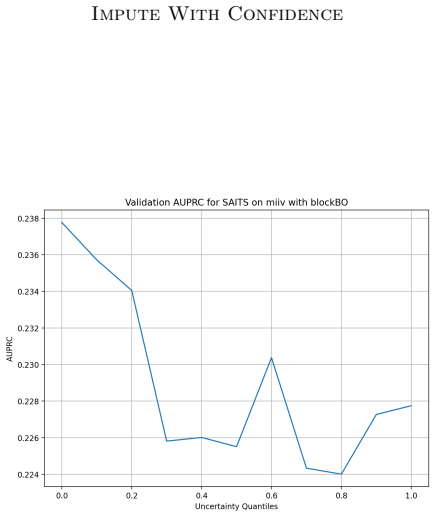
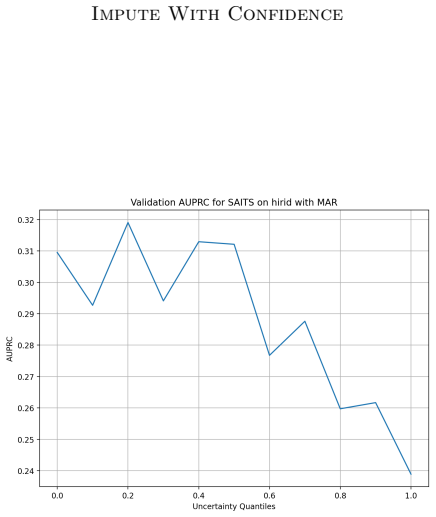
- [§5.3, Figures 3–4; §4 data split] The downstream claim that selective imputation improves mortality prediction is supported only by validation-set AUPRC, and the uncertainty threshold is selected on that same validation set. The manuscript explicitly reserves 50% of each dataset as test in §4, yet no test-set AUPRC is reported anywhere, and Figures 3 and 4 appear to be validation curves. With 11 thresholds, 2 models, 3 datasets, and 5 missingness types, the apparent gains at t60 (Figure 3) and t20 (Figure 4) may be artifacts of selection on the validation set. Please report test-set AUPRC for every threshold, and ideally choose thresholds using validation data and evaluate once on the held-out test set, with confidence intervals or multiple seeds.
- [§3.4 and §5.3] The calibration step computes thresholds t10–t100 as quantiles of the uncertainty distribution U gathered only from synthetically masked positions in the validation set, yet §5.3 applies selective imputation to Xobs samples with genuine missingness. No experiment compares uncertainty values or optimal thresholds between synthetic and genuine missing positions, so the paper assumes that thresholds calibrated on synthetic masks transfer to genuine missingness. This assumption is load-bearing for the selective-imputation results and should be tested, for example by plotting the uncertainty distribution on synthetic versus genuine missing positions for a held-out fold or by calibrating on genuine missingness when a small labeled set is available.
- [§5.2, Figures 1–2] The central uncertainty-error relationship is described qualitatively as 'very clear and consistent' but is not quantified. The paper reports no correlation coefficient, confidence interval, variance across random seeds, or statistical test, and the plotted MAE values are computed on the same validation set used to derive the thresholds. Since this relationship is the foundation for all subsequent selective-imputation experiments, please provide a numeric summary (e.g., Spearman or Pearson correlation between threshold and MAE per model/dataset/missingness condition, with uncertainty intervals) and report variability across independent training runs. Without this, the reader cannot assess the strength or generality of the claimed monotone trend.
minor comments (6)
- [§5.3] The text contains an unresolved cross-reference 'Appendix ??' when referring to the full set of AUPRC plots; please insert the correct appendix number.
- [Appendix A] Several figure captions are duplicated or contain typos, such as 'miiv' instead of 'MIMIC IV' (Figures 5–14) and 'hirid' lowercase (Figures 24–32); please standardize dataset names and captions.
- [§3.2] In the MAR definition, the claim that missingness 'depends solely on variables that remain observed' is weakened by the implementation note that genuinely missing values are filled with the mean before the logistic regression; please clarify whether this mean imputation introduces dependence on unobserved values and, if so, how the mechanism is still strictly MAR.
- [§3.4] The notation 't10, t20, ..., t100' is ambiguous: it is unclear whether these are quantile indices or actual uncertainty values at those quantiles. Since later text speaks of '60% most confident missing values', please define the threshold construction explicitly, including the mapping from quantile to threshold value.
- [§5.1 and Appendix B] The statement that the authors 'reproduce their benchmark comparison' is supported only by figures without numerical tables or reported errors; please add a table with MAE values and baseline comparisons so the reader can verify the claim.
- [Figures 3 and 4] The figures lack axis labels in the manuscript text and the '0.0' threshold (no imputation) is referenced but not clearly marked; please add labeled axes, legends, and error bars or confidence intervals.
Circularity Check
Downstream benefit is validation AUPRC with the threshold selected on that same validation set; no held-out test AUPRC breaks the loop, while the core uncertainty–error correlation is non-circular.
-
fitted input called prediction
[Section 5.3 (Downstream Task Impact); data split in Section 4; conclusion in Section 6]
"For each threshold, we selectively impute according to that threshold (note imputation for the classification task is performed on Xobs samples with no synthetic missing values) using the now pre-trained imputation model, then train and test a Light Gradient-Boosting Machine (LGBM) Ke et al. (2017) mortality classifier. From there we obtain validation set AUPRC to measure model performance. In Figure 3 we can see a clear case of the downstream task performing better when imputation is only performed on the 60% most confident missing values."
The thresholds t10..t100 are fixed quantiles of validation-set uncertainty, but the 'clear case' (t60) is identified by inspecting the AUPRC curve computed on the same validation split, and no test-set AUPRC is reported despite the 50% test split defined in Section 4. The claimed downstream gain is therefore the validation-curve value used to select the threshold: it is a selected maximum, not an independent out-of-sample prediction. The evidence for selective-imputation benefit reduces to the selection criterion itself.
full rationale
The central uncertainty–error claim is not circular: the Monte Carlo dropout standard deviation is defined from forward-pass variance, not from imputation error, and the observed monotone MAE-versus-threshold relationship is an empirical correlation tested across datasets, models, and missingness types. There is no self-citation chain or imported uniqueness argument; the Gal and Ghahramani citation is an external, standard result. The partial circularity is confined to the downstream evaluation: thresholds are calibrated on validation uncertainty, the same validation set supplies the AUPRC used to identify a peak, and the conclusion that selective imputation 'in certain cases' improves downstream performance is defended with that same validation AUPRC rather than a held-out test result. This is a self-fitting loop in the downstream claim, but it does not infect the independently meaningful uncertainty–error correlation, so the score is moderate rather than high.
Assumptions & free parameters
free parameters (5)
- patient filtering thresholds =
LOS >= 30 hours, no death in first 30 hours, >= 4 measurements, no >12h contiguous missingness per variable, age >=…
- uncertainty threshold quantile =
varies by model/dataset/missingness type, e.g., t60 for eICU blockBO and t20 for HiRID MCAR
- Monte Carlo forward pass count F =
16
- logistic regression intercept for MAR and MNAR missingness generation =
chosen to achieve 30% missingness
- imputation model hyperparameters =
learning rate in {0.001, 0.005}, layers in {2, 4}, d_model in {64, 128}, d_inner in {64, 128}, heads in {4, 8}…
assumptions (4)
- domain assumption Monte Carlo dropout approximates Bayesian inference in a deep Gaussian process, so sample standard deviation is a predictive uncertainty measure (Gal and Ghahramani, 2016).
- domain assumption Uncertainty values and thresholds computed on synthetically masked positions are representative of genuine missing values at inference.
- domain assumption Synthetic missingness patterns (MCAR, MAR, MNAR, BO, blockBO) represent real ICU missingness well enough to train and calibrate models that transfer.
- domain assumption The six most observed dynamic variables are sufficient for the imputation and mortality prediction tasks.
Cite this review
Pith. "Pith review of Impute With Confidence: A Framework for Uncertainty Aware Multivariate Time Series Imputation." pith.science (2026). https://pith.science/paper/ZMRDIDFV
@misc{pith2026250709353,
  author       = {Pith},
  title        = {Pith review of: Impute With Confidence: A Framework for Uncertainty Aware Multivariate Time Series Imputation},
  year         = {2026},
  howpublished = {\url{https://pith.science/paper/ZMRDIDFV}},
  note         = {Machine review of arXiv:2507.09353}
}
read the original abstract
Time series data with missing values is common across many domains. Healthcare presents special challenges due to prolonged periods of sensor disconnection. In such cases, having a confidence measure for imputed values is critical. Most existing methods either overlook model uncertainty or lack mechanisms to estimate it. To address this gap, we introduce a general framework that quantifies and leverages uncertainty for selective imputation. By focusing on values the model is most confident in, highly unreliable imputations are avoided. Our experiments on multiple EHR datasets, covering diverse types of missingness, demonstrate that selectively imputing less-uncertain values not only reduces imputation errors but also improves downstream tasks. Specifically, we show performance gains in a 24-hour mortality prediction task, underscoring the practical benefit of incorporating uncertainty into time series imputation.
Figures


Figures from the paper (32 more)







Reference graph
Works this paper leans on
-
[1]
Classification uncertainty of multiple imputed data
Tuomo Alasalmi, Heli Koskimäki, Jaakko Suutala, and Juha Röning. Classification uncertainty of multiple imputed data. In 2015 IEEE Symposium Series on Computational Intelligence, pages 151--158, 2015. doi:10.1109/SSCI.2015.32
-
[2]
BRITS: bidirectional recurrent imputation for time series
Wei Cao, Dong Wang, Jian Li, Hao Zhou, Lei Li, and Yitan Li. BRITS: bidirectional recurrent imputation for time series. CoRR, abs/1805.10572, 2018. URL http://arxiv.org/abs/1805.10572
arXiv 2018
-
[3]
Zhengping Che, Sanjay Purushotham, Kyunghyun Cho, David A. Sontag, and Yan Liu. Recurrent neural networks for multivariate time series with missing values. CoRR, abs/1606.01865, 2016. URL http://arxiv.org/abs/1606.01865
arXiv 2016
-
[4]
Saits: Self-attention-based imputation for time series
Wenjie Du, David Côté, and Yan Liu. Saits: Self-attention-based imputation for time series. Expert Systems with Applications, 219: 0 119619, June 2023. ISSN 0957-4174. doi:10.1016/j.eswa.2023.119619. URL http://dx.doi.org/10.1016/j.eswa.2023.119619
-
[5]
A survey on missing data in machine learning
Tlamelo Emmanuel, Thabiso Maupong, Dimane Mpoeleng, Thabo Semong, Banyatsang Mphago, and Oteng Tabona. A survey on missing data in machine learning. Journal of Big Data, 8 0 (1): 0 140, 2021. ISSN 2196-1115. doi:10.1186/s40537-021-00516-9. URL https://doi.org/10.1186/s40537-021-00516-9
-
[6]
Hirid, a high time-resolution icu dataset (version 1.1.1)
Matthias Faltys, Michael Zimmermann, Xiaoran Lyu, Martin Hüser, Stewart Hyland, Gunnar Rätsch, and Tobias Merz. Hirid, a high time-resolution icu dataset (version 1.1.1). PhysioNet, 2021. doi:10.13026/nkwc-js72. URL https://doi.org/10.13026/nkwc-js72
-
[7]
GP-VAE: Deep Probabilistic Time Series Imputation
Vincent Fortuin, Dmitry Baranchuk, Gunnar Rätsch, and Stephan Mandt. Gp-vae: Deep probabilistic time series imputation, 2020. URL https://arxiv.org/abs/1907.04155
work page Pith review arXiv 2020
-
[8]
Dropout as a bayesian approximation: Representing model uncertainty in deep learning, 2016
Yarin Gal and Zoubin Ghahramani. Dropout as a bayesian approximation: Representing model uncertainty in deep learning, 2016. URL https://arxiv.org/abs/1506.02142
arXiv 2016
Show all 19 references
-
[9]
Hyperimpute: Generalized iterative imputation with automatic model selection, 2022
Daniel Jarrett, Bogdan Cebere, Tennison Liu, Alicia Curth, and Mihaela van der Schaar. Hyperimpute: Generalized iterative imputation with automatic model selection, 2022. URL https://arxiv.org/abs/2206.07769
2022 arXiv
-
[10]
Alistair E. W. Johnson, Lucas Bulgarelli, Lu Shen, Alvin Gayles, Ayad Shammout, Steven Horng, Tom J. Pollard, Sicheng Hao, Benjamin Moody, Brian Gow, Li wei H. Lehman, Leo A. Celi, and Roger G. Mark. Mimic-iv, a freely accessible electronic health record dataset. Scientific Da...
2023 doi
-
[11]
Lightgbm: A highly efficient gradient boosting decision tree
Guolin Ke, Qi Meng, Thomas Finley, Taifeng Wang, Wei Chen, Weidong Ma, Qiwei Ye, and Tie-Yan Liu. Lightgbm: A highly efficient gradient boosting decision tree. In I. Guyon, U. Von Luxburg, S. Bengio, H. Wallach, R. Fergus, S. Vishwanathan, and R. Garnett, editors, Advances in ...
2017
-
[12]
Little and Donald B
Roderick J. Little and Donald B. Rubin. Statistical Analysis with Missing Data, volume 793. Wiley, Hoboken, 2019
2019
-
[13]
CDSA: cross-dimensional self-attention for multivariate, geo-tagged time series imputation
Jiawei Ma, Zheng Shou, Alireza Zareian, Hassan Mansour, Anthony Vetro, and Shih - Fu Chang. CDSA: cross-dimensional self-attention for multivariate, geo-tagged time series imputation. CoRR, abs/1905.09904, 2019. URL http://arxiv.org/abs/1905.09904
1905 arXiv
-
[14]
Uncertainty-aware variational-recurrent imputation network for clinical time series
Ahmad Wisnu Mulyadi, Eunji Jun, and Heung-Il Suk. Uncertainty-aware variational-recurrent imputation network for clinical time series. IEEE Transactions on Cybernetics, 52 0 (9): 0 9684--9694, 2022. doi:10.1109/TCYB.2021.3053599
2022
-
[15]
Celi, Omar Badawi, and Roger Mark
Tom Pollard, Alistair Johnson, Jesse Raffa, Leo A. Celi, Omar Badawi, and Roger Mark. eicu collaborative research database (version 2.0). PhysioNet, 2019. doi:10.13026/C2WM1R. URL https://doi.org/10.13026/C2WM1R
2019 doi
-
[16]
CSDI: conditional score-based diffusion models for probabilistic time series imputation
Yusuke Tashiro, Jiaming Song, Yang Song, and Stefano Ermon. CSDI: conditional score-based diffusion models for probabilistic time series imputation. CoRR, abs/2107.03502, 2021. URL https://arxiv.org/abs/2107.03502
2021 arXiv
-
[17]
mice: Multivariate imputation by chained equations in r
Stef van Buuren and Karin Groothuis-Oudshoorn. mice: Multivariate imputation by chained equations in r. Journal of Statistical Software, 45 0 (3): 0 1–67, 2011. doi:10.18637/jss.v045.i03. URL https://www.jstatsoft.org/index.php/jss/article/view/v045i03
2011 doi
-
[18]
Closing gaps: An imputation analysis of ICU vital signs, 2024
Robin van de Water and Bert Arnrich. Closing gaps: An imputation analysis of ICU vital signs, 2024. URL https://openreview.net/forum?id=c5jhcExiM0
2024
-
[19]
Yet another icu benchmark: A flexible multi-center framework for clinical ml, 2024
Robin van de Water, Hendrik Schmidt, Paul Elbers, Patrick Thoral, Bert Arnrich, and Patrick Rockenschaub. Yet another icu benchmark: A flexible multi-center framework for clinical ml, 2024. URL https://arxiv.org/abs/2306.05109
2024 arXiv
Reviewed August 6, 2026 · model on record in the stance chip above.
Discussion (0). Continue with ORCID to comment.