REVIEW 4 major objections 5 minor 14 references
Enabling Simulation-Based Optimization Through Machine Learning: A Case Study on Antenna Design
T0 review · 4 major / 5 minor · reviewed 2026-08-14 · deepseek-v4-flash
Pith's one-line read Trained on a few hundred simulator runs, an ML emulator finds a better antenna configuration almost instantly.
desk verdict Solid surrogate-based optimization case study, but the headline result lacks a simulator re-check at the emulator-selected optimum. read the letter →
The pith
A machine-rendered reading of the paper's core claim, the machinery that carries it, and where it could break.
The reading
What carries the argument
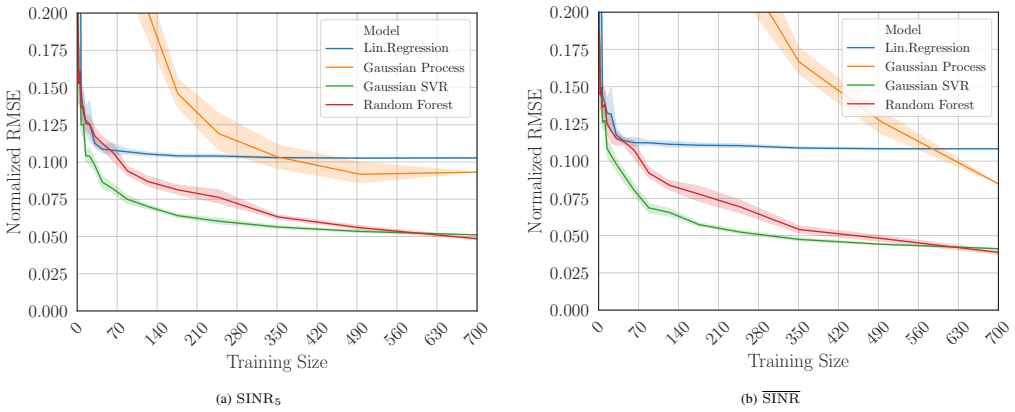
The load-bearing object is the emulator: a regression function $\hat{f}$ trained on (input, output) pairs drawn from the simulator, able to return network metrics in microseconds. The paper evaluates four candidate families — linear regression, Gaussian process regression, support-vector regression with a Gaussian kernel, and random forests — and measures fit by normalized root-mean-square error (nRMSE) on a fixed 300-sample test set. The optimizer then maximizes mean SINR subject to $\mathrm{SINR}_5>6$ dB over $\hat{f}$, using a gradient-free global search because the inputs (antenna counts and spacings) are discrete or mixed and the surrogate need not be differentiable. The nRMSE is the quality gate: once it falls below a chosen threshold (for example, 6%), the simulator is retired and all subsequent objective evaluations, including new objective functions, are done on the emulator.
What would settle it
Re-run the simulator at the emulator-selected configuration ($64\times 1$, $0.734\lambda$ spacing) and compare its SINR and $\mathrm{SINR}_5$ with the emulator's predictions; if the simulated values miss by more than the held-out nRMSE, or if $\mathrm{SINR}_5$ falls below the 6 dB constraint, the reported Opt. Emulator gain is an artifact of extrapolation. A second check is to compare the emulator optimum against a dense grid or true global search over the four parameters, rather than against only the best of 1,000 random samples.
Extended reading notes
Core claim
The central claim is that the input-output map of a complex simulator can be replaced by a learned continuous surrogate that is accurate enough to support global numerical optimization. Using Gaussian processes, support vector regression, random forests, and linear regression on data from a standard-compliant urban microcell mmWave simulator, the paper shows that normalized root-mean-square errors of about 3.2% for SINR and 5.7% for $\mathrm{SINR}_5$ can be reached from a few hundred training samples. With the objective 'maximize SINR subject to $\mathrm{SINR}_5>6$ dB,' the emulator-based optimizer selects a $64\times 1$ uniform linear array with vertical spacing $0.734\lambda$; the best of 1,000 random simulator samples is a $64\times 1$ array with $0.825\lambda$ spacing. Both beat the $8\times 8$ $\lambda/2$ baseline by roughly 3 dB in SINR and by about 2.5 dB in $\mathrm{SINR}_5$, and the emulator route achieves this with 12$\times$ fewer evaluations than the brute-force search. The authors' stated upshot is that the bottleneck is no longer the optimizer but the one-time creation of a modest training dataset.
Load-bearing premise
The load-bearing premise is that the emulator's accuracy on random held-out samples (about 3–6% normalized error) extends to the particular configuration the optimizer selects; the paper does not run the simulator at that exact point to confirm the predicted gain.
Editorial extensions
If this is right
- The same emulator can be reused to optimize any other metric or constraint over the same four antenna parameters without further simulation.
- In settings where simulator runs dominate the cost, the framework's total cost is the one-time dataset creation plus negligible training and optimization, so the reported speedup grows with simulator cost.
- If a 6% error target is enough, the learning curves indicate the dataset can be cut to roughly 150 samples for SINR or 300 for $\mathrm{SINR}_5$, making the overhead smaller still.
- The method does not require a differentiable or convex simulator, so it applies to black-box, discrete, or noisy simulation outputs beyond antenna design.
Reading between the lines
- Because the emulator is instant, the same dataset could support full Pareto-front exploration of $\mathrm{SINR}$ versus $\mathrm{SINR}_5$, a multi-objective view the paper does not draw.
- The paper's stopping rule suggests an adaptive data-acquisition scheme: keep simulating until a target error is met; a direct test would be whether adaptive sampling reaches the same optimum with fewer than the 1,000 samples used here.
- The claimed global optimum is only as global as the surrogate; an acquisition-function step that re-simulates at the emulator's chosen point would turn the method into a safe optimizer and would test the extrapolation assumption explicitly.
- For simulators costly enough that 1,000 runs are infeasible, the relevant question is how many samples are needed before the emulator's recommended configuration stops moving; the paper's learning curves suggest this stability threshold can be measured without a brute-force search.
Signed reviews
Editorial analysis
A structured set of objections, weighed in public.
Referee Report
Summary. The paper proposes a machine-learning-based emulation framework for simulation-based optimization. Using a custom 5G mmWave cellular simulator as a testbed, the authors train linear regression, Gaussian process regression, random forests, and support vector regressors on small datasets of antenna parameters (vertical/horizontal spacing and array dimensions) to predict network-level SINR metrics. They report emulation accuracy in terms of normalized RMSE learning curves, then perform a constrained optimization (maximize mean SINR subject to a fifth-percentile SINR threshold) on the trained emulator. The central claims are that the emulator achieves low nRMSE with only a few hundred training samples, that the optimized configuration yields about 3 dB SINR improvement over an 8x8 baseline, and that the framework gives a 12x speedup over brute-force simulator evaluations.
Significance. If the central claims hold, the paper demonstrates a practically useful workflow for reducing the computational cost of antenna-array optimization in network simulation, with the attractive property that a single trained emulator can be reused for different optimization goals. The strength of the paper is its honest presentation of learning curves with confidence intervals and its use of a standard normalized RMSE metric. However, the work builds on well-established surrogate-modeling and Bayesian-optimization ideas, and its claimed novelty is mainly the specific application case. The main empirical claim, that the emulator-selected configuration genuinely outperforms the baseline in the simulator, is currently not fully supported because the simulator is not explicitly re-run at the selected configuration.
major comments (4)
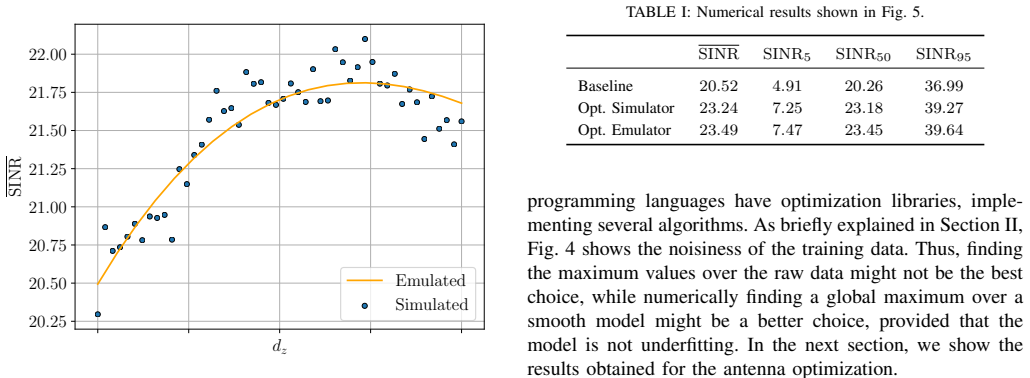
- [Section III, Table I and Fig. 5] The paper does not state whether the 'Opt. Emulator' row in Table I and the green bar in Fig. 5 were obtained by running the simulator at the selected configuration (nz=64, ny=1, dz=0.734 lambda) or by evaluating the emulator's own predictions at that configuration. The phrase 'global optimum obtained using our framework' is ambiguous. This matters because the emulator's held-out nRMSE of 3-6% was measured on random samples, whereas an optimizer actively selects points where the emulator predicts high SINR, so the approximation error at the selected point can be larger. The constraint SINR5 > 6 dB could also be violated when checked against the simulator. Please add an explicit simulator evaluation at the emulator-selected configuration and report both the emulator prediction and the simulator value for all metrics in Table I.
- [Section III, Table I and Abstract] The 'Opt. Simulator' configuration is described as the optimum obtained over a dataset of 1,000 randomly sampled points, not as a certified global optimum. The abstract and Section III nevertheless use the term 'global optimum' for the emulator-based result. Since neither configuration is proven globally optimal, the language overstates the finding. Please either verify optimality through exhaustive enumeration or a rigorous global-optimization method, or rephrase the claims as 'best configuration found by the framework' and 'best among the 1,000 random simulator samples.'
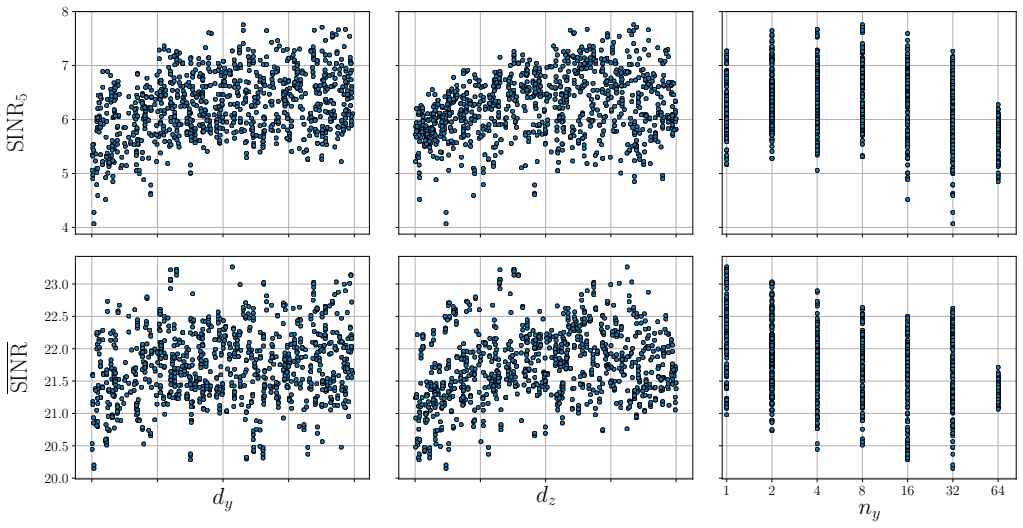
- [Section II-A and Section III] The paper states in Section II-A that the total number of antenna elements is fixed to N=64 and that nz=N/ny, so nz is deterministically related to ny. Yet Section III describes '1,000 randomly sampled points in the four-dimensional space described in Section II.' With the deterministic relation, the effective parameter space is three-dimensional (dz, dy, and one of nz or ny). Please correct the dimension count and adjust the 'vast parameter space' motivation accordingly, or explain why the four parameters are still treated as independently sampled.
- [Section II-C] The optimization step is not reproducible because no specific algorithm is named. The text mentions that 'most standard numerical optimization techniques can be equally used' and refers to genetic algorithms or simulated annealing, but it does not state which method was actually applied, how the discrete variables (nz, ny) were handled, which implementation was used, or what hyperparameters were chosen. Since optimization on the emulator is a central contribution, please provide these details so that the 12x speedup and the reported optimum can be independently reproduced.
minor comments (5)
- [Eq. (2)] The symbol N is used both for the total number of antenna elements (Section II-A) and for the number of samples in the test set in Eq. (2). This is confusing; please use a different symbol, e.g., N_test, for the number of test samples.
- [Abstract] The abstract says 'extrapolating a continuous model,' but the emulator is trained on samples and predicts inside the sampled input region; the more accurate term is 'interpolating' or 'approximating.' This wording overstates what the framework does.
- [Fig. 3] The figure shows mean and 95% confidence intervals over multiple runs, but the text does not specify how many runs were performed or whether the training/test splits were random and independent. Please state the exact experimental protocol for the learning curves so that the confidence intervals are meaningful.
- [Related Work] The related work does not cite the established surrogate-based optimization and Bayesian optimization literature, where emulator-assisted optimization of expensive simulators is a well-known approach. Please add references to that literature and discuss how the proposed framework differs from or extends it.
- [Table I] The column headers in Table I appear as 'SINR SINR 5 SINR50 SINR95' and are inconsistent with the notation SINR5 used in the text. Please use consistent subscripts and formatting for all metrics.
Circularity Check
The reported Opt. Emulator gain is the fitted emulator's own prediction at its selected point, not a simulator-validated result.
-
fitted input called prediction
[Section III (Optimization Results), Table I and Fig. 5 caption]
"Comparison among the network performance obtained with the baseline configuration (blue bar), with the optimal configuration identified using the simulator samples (orange bar) and using the emulator (green bar). ... The other two configurations represent the optimum obtained over the collected dataset (Opt. Simulator, made of 1,000 randomly sampled points in the four-dimensional space described in Section II) and the global optimum obtained using our framework (Opt. Emulator). They both identified a 64×1 configuration (vertical ULA), but respectively with 0.825λ and 0.734λ spacing."
The Opt. Emulator row in Table I (SINR 23.49 dB, SINR5 7.47 dB) is presented as the network performance of the configuration found by the framework, but the paper never reports a simulator run at that configuration. The Fig. 5 caption states that this performance was obtained 'using the emulator,' i.e., it is the fitted emulator's own regression output evaluated at the point selected by maximizing that same fitted surface. By construction, the optimizer returns a point that maximizes the emulator's predictions, so reporting the emulator's value at that point as an achieved '∼3 dB improvement' over a simulator-measured baseline compares a measured baseline against the fit's self-evaluation at its own argmax.
full rationale
The paper's emulator-accuracy analysis is externally grounded: nRMSE is computed on a held-out test set of 300 simulator samples (Section II-B, Fig. 3), so the claim that the emulator approximates the simulator on random inputs is not circular. The self-citations to prior antenna-pattern and simulator work are used as modeling inputs, not as a substitute for validation. However, the headline optimization result is circular in the sense of a fitted prediction being labeled as achieved performance: the Opt. Emulator configuration is found by maximizing the emulator, and the reported performance values appear to be the emulator's own predictions at that point, with no simulator re-evaluation described. The '∼3 dB improvement' is therefore the fitted model's value at its own maximizer, not an independently verified outcome. This is a partial circularity: the method may be sound, but the specific claim that the emulator-selected optimum genuinely outperforms the baseline is currently supported only by the emulator's self-prediction. Score 6 reflects one central prediction that reduces by construction to the fit, while the rest of the framework is independently benchmarked.
Assumptions & free parameters
free parameters (3)
- ML model hyperparameters (GPR kernel, SVR C and gamma, random forest size, etc.) =
not reported
- Training dataset size =
varied 70 to 700, with 1,000 for final optimization
- nRMSE target threshold =
6%
assumptions (4)
- domain assumption Simulator outputs are sufficiently noiseless and smooth to be learned by regression from 150 to 700 samples.
- domain assumption Random uniform sampling of the parameter space provides representative coverage for finding a global optimum.
- domain assumption The regression models generalize at the optimizer-selected location, not just on random held-out samples.
- domain assumption The 3GPP UMi channel model and the element-pattern/array-factor antenna model are accurate enough for 5G antenna design evaluation.
Cite this review
Pith. "Pith review of Enabling Simulation-Based Optimization Through Machine Learning: A Case Study on Antenna Design." pith.science (2026). https://pith.science/paper/ZQY3YO56
@misc{pith2026190811225,
  author       = {Pith},
  title        = {Pith review of: Enabling Simulation-Based Optimization Through Machine Learning: A Case Study on Antenna Design},
  year         = {2026},
  howpublished = {\url{https://pith.science/paper/ZQY3YO56}},
  note         = {Machine review of arXiv:1908.11225}
}
read the original abstract
Complex phenomena are generally modeled with sophisticated simulators that, depending on their accuracy, can be very demanding in terms of computational resources and simulation time. Their time-consuming nature, together with a typically vast parameter space to be explored, make simulation-based optimization often infeasible. In this work, we present a method that enables the optimization of complex systems through Machine Learning (ML) techniques. We show how well-known learning algorithms are able to reliably emulate a complex simulator with a modest dataset obtained from it. The trained emulator is then able to yield values close to the simulated ones in virtually no time. Therefore, it is possible to perform a global numerical optimization over the vast multi-dimensional parameter space, in a fraction of the time that would be required by a simple brute-force search. As a testbed for the proposed methodology, we used a network simulator for next-generation mmWave cellular systems. After simulating several antenna configurations and collecting the resulting network-level statistics, we feed it into our framework. Results show that, even with few data points, extrapolating a continuous model makes it possible to estimate the global optimum configuration almost instantaneously. The very same tool can then be used to achieve any further optimization goal on the same input parameters in negligible time.
Figures

Figures from the paper (2 more)

Reference graph
Works this paper leans on
-
[1]
Millimeter-Wave Cellular Wireless Networks: Potentials and Challenges,
S. Rangan, T. S. Rappaport, and E. Erkip, “Millimeter-Wave Cellular Wireless Networks: Potentials and Challenges,” Proceedings of the IEEE, vol. 102, no. 3, pp. 366–385, March 2014
work page 2014
-
[2]
V . Rabinovich and N. Alexandrov, Antenna Arrays and Automotive Applications. Springer-Verlag, New York, NY , USA, 2013
work page 2013
-
[3]
Study of Realistic Antenna Patterns in 5G mmWave Cellular Scenarios,
M. Rebato, L. Resteghini, C. Mazzucco, and M. Zorzi, “Study of Realistic Antenna Patterns in 5G mmWave Cellular Scenarios,” in IEEE ICC Communications QoS, Reliability, and Modeling Symposium , Kansas City, USA, May 2018
work page 2018
-
[4]
Deepmimo: A generic deep learning dataset for mil- limeter wave and massive MIMO applications,
A. Alkhateeb, “Deepmimo: A generic deep learning dataset for mil- limeter wave and massive MIMO applications,” in Proc. of Information Theory and Applications Workshop (ITA) , San Diego, CA, Feb 2019, pp. 1–8
work page 2019
-
[5]
Enabling FDD Massive MIMO through Deep Learning-based Channel Prediction,
M. Arnold, S. D ¨orner, S. Cammerer, S. Yan, J. Hoydis, and S. ten Brink, “Enabling FDD Massive MIMO through Deep Learning-based Channel Prediction,” Tech. Rep., Jan 2019, extended version of the conference paper submitted to SPAWC2019. [Online]. Available: https://arxiv.org/pdf/1901.03664.pdf
arXiv 2019
-
[6]
A Very Brief Introduction to Machine Learning With Applications to Communication Systems,
O. Simeone, “A Very Brief Introduction to Machine Learning With Applications to Communication Systems,” IEEE Transactions on Cog- nitive Communications and Networking , vol. 4, no. 4, pp. 648–664, Dec 2018
work page 2018
-
[7]
An Introduction to Deep Learning for the Physical Layer,
T. J. O’Shea and J. Hoydis, “An Introduction to Deep Learning for the Physical Layer,” IEEE Transactions on Cognitive Communications and Networking, vol. 3, no. 4, pp. 563–575, Dec 2017
work page 2017
-
[8]
M. Zorzi, A. Zanella, A. Testolin, M. De Filippo De Grazia, and M. Zorzi, “Cognition-based networks: A new perspective on network optimization using learning and distributed intelligence,” IEEE Access, vol. 3, pp. 1512–1530, 2015
work page 2015
Show all 14 references
-
[9]
A machine learning approach to QoE-based video admission control and resource allocation in wireless systems,
A. Testolin, M. Zanforlin, M. De Filippo De Grazia, D. Munaretto, A. Zanella, M. Zorzi, and M. Zorzi, “A machine learning approach to QoE-based video admission control and resource allocation in wireless systems,” in 13th Annual Mediterranean Ad Hoc Networking Workshop (MED-HO...
2014
-
[10]
Learning to Optimize: Training Deep Neural Networks for Interference Management,
H. Sun, X. Chen, Q. Shi, M. Hong, X. Fu, and N. D. Sidiropoulos, “Learning to Optimize: Training Deep Neural Networks for Interference Management,” IEEE Transactions on Signal Processing, vol. 66, no. 20, pp. 5438–5453, Oct 2018
2018
-
[11]
Understanding Noise and Interference Regimes in 5G Millimeter- Wave Cellular Networks,
M. Rebato, M. Mezzavilla, S. Rangan, F. Boccardi, and M. Zorzi, “Understanding Noise and Interference Regimes in 5G Millimeter- Wave Cellular Networks,” in 22th European Wireless Conference, May 2016
2016
-
[12]
Study on channel model for frequencies from 0.5 to 100 GHz,
3GPP, “Study on channel model for frequencies from 0.5 to 100 GHz,” 3rd Generation Partnership Project (3GPP), Technical Report (TR) 38.901, 06 2018, version 15.0.0
2018
-
[13]
Study on scenarios and requirements for next generation access technologies,
——, “Study on scenarios and requirements for next generation access technologies,” 3rd Generation Partnership Project (3GPP), Technical Report (TR) 38.913, 07 2018, version 15.0.0
2018
-
[14]
C. M. Bishop, Pattern Recognition and Machine Learning (Information Science and Statistics) . Berlin, Heidelberg: Springer-Verlag, 2006
2006
Reviewed August 14, 2026 · model on record in the stance chip above.
Discussion (0). Continue with ORCID to comment.