REVIEW 5 major objections 6 minor 52 references
A faint, nearly undetectable coronal mass ejection—not the brighter candidate eruptions—drove the intense geomagnetic storm of March 23–24, 2023.
Reviewed by Pith at T0; open to challenge. T0 means a machine referee read the full paper against a public rubric. the ladder, T0–T4 →
A faint stealth CME caused the intense March 2023 geomagnetic storm; radial spacecraft data show it expanded, rotated, and carried southward field with a density-enhanced tail.
T0 review reviewed 2026-08-04 challenge →
load-bearing objection Useful stealth-CME storm case with rare three-spacecraft sampling, but the radial-evolution numbers are undermined by internal timing and interval inconsistencies. the 5 major comments →
An intense geomagnetic storm originated from stealth Coronal Mass Ejection: remote and in situ observations by near radially aligned spacecraft
The pith
A machine-rendered reading of the paper's core claim, the machinery that carries it, and where it could break.
The reading
Core claim
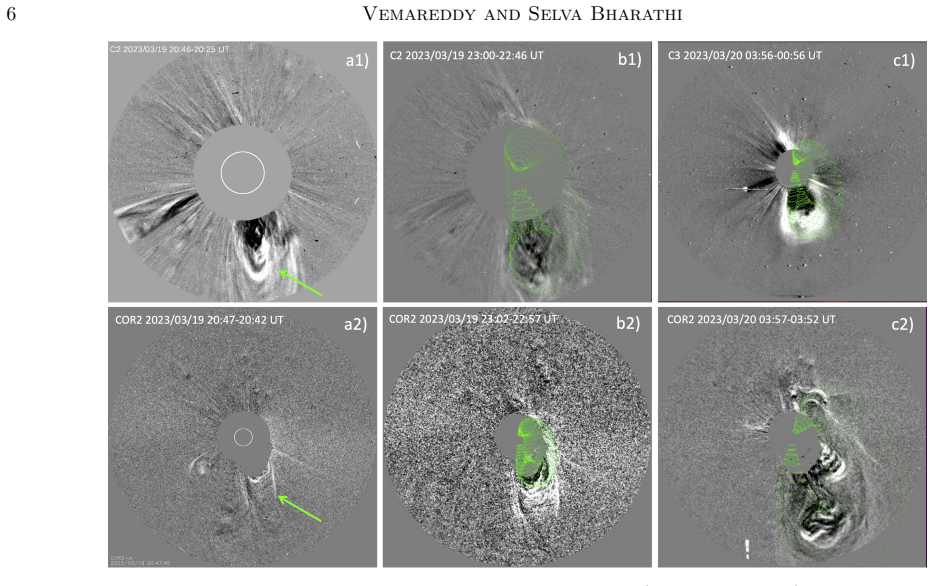
The discovery is that the intense geomagnetic storm of March 23–24, 2023, was caused by a weak stealth CME that erupted from a longitudinal filament channel near disk center, and that this ICME was observed by three radially-aligned spacecraft, revealing a magnetic cloud that expanded from 0.08 AU to 0.18 AU, whose average magnetic field fell as R_H^{-1.97} (SolO–STA) and R_H^{-1.53} (SolO–WIND), and whose axis rotated from –69 degrees to –25 degrees to –34 degrees in inclination. The storm’s main phase peaked at SYM-H = –169 nT, followed by a nearly equal second peak (–170 nT) driven by enhanced density in the cloud’s tail. The paper argues that the southward B_z plus density enhancement to
What carries the argument
The central object is the magnetic cloud (MC) flux rope of the ICME, identified by low proton beta, low temperature, smooth field rotation, and right-handed helicity at all three spacecraft. The three-spacecraft radial alignment (SolO at 0.5 AU, STEREO-A at 0.966 AU, WIND at L1) is the mechanism that lets the authors measure radial evolution in size, field strength, expansion speed, and axis orientation from the same structure. Coronal observations of the source filament channel and the GCS flux-rope fit anchor the identification.
Load-bearing premise
The three spacecraft all encountered the same coherent magnetic cloud, so that differences among their measurements can be interpreted as the radial evolution of a single structure; if they sampled distinct parts of an inhomogeneous ejecta, the expansion, rotation, and decay conclusions would not follow.
What would settle it
Compare the ionic charge-state composition (e.g., Fe charge states or He/O abundance ratios) of the magnetic cloud intervals at SolO, STEREO-A, and WIND; if they differ beyond measurement error, the three spacecraft did not sample the same plasma structure, and the inferred radial evolution is not valid.
If this is right
- Weak, stealth CMEs with southward B_z can produce G4-class geomagnetic storms, so forecasting must account for eruptions lacking flare signatures.
- The magnetic cloud expanded from 0.08 AU at SolO to 0.18 AU at STA, with expansion speed falling from 111 km/s to roughly half at STA and WIND.
- Average magnetic field strength declined with heliocentric distance as R^{-1.97} (SolO–STA) and R^{-1.53} (SolO–WIND); peak field declined as R^{-2.1} and R^{-1.7}.
- The 21-hour delay between STEREO-A and WIND ICME arrivals matches the expected co-rotation time for their 12-degree longitudinal separation.
- A density enhancement in the MC's trailing part produced the storm's second SYM-H peak, indicating that density, not only B_z, matters for geoeffectiveness.
Where Pith is reading between the lines
- If confirmed, the paper's method can be extended to other multi-spacecraft radial alignments (e.g., Parker Solar Probe and BepiColombo) to test whether stealth CME flux ropes maintain coherence across the inner heliosphere or fragment.
- The B-field decay steeper than R^{-1} suggests either flux-rope expansion, reconnection erosion, or a non-axial sampling effect; comparing with MHD simulations of flux-rope propagation could separate these.
- The density enhancement in the MC tail could be a compression signature from the trailing high-speed solar wind; if so, solar wind monitors might use pre-ICME stream structure to anticipate double-peaked storms.
- The paper's identification relies on the absence of other halo CME sources; a decisive test would be comparing the magnetic cloud's plasma composition at all three spacecraft to confirm a common origin.
Editorial analysis
A structured set of objections, weighed in public.
Referee Report
Summary. The paper attributes the intense geomagnetic storm of 23–24 March 2023 (SYM-H ≈ −169/−170 nT; Dst ≈ −163 nT) to a faint, 'stealth' CME observed on 19 March 2023, associated with the eruption of a trans-equatorial longitudinal filament channel near disk center. The analysis combines SDO/STEREO/SOHO EUV and coronagraph data, STEREO-A heliospheric imaging, and in situ magnetic-field and plasma measurements at SolO (0.5 AU), STEREO-A (0.966 AU), and WIND (L1). From these data the paper derives ICME expansion, a magnetic-field decay with heliocentric distance (B_peak ∝ R_H^−2.1 and R_H^−1.7; B_av ∝ R_H^−1.97 and R_H^−1.53), flux-rope axis rotation (from −69° to −25°/−34°), and a two-peak storm morphology attributed to southward Bz followed by a trailing density enhancement. The storm-driving interpretation is checked against three empirical Dst/SYM-H models.
Significance. If the same-ICME interpretation is correct, the event is a valuable demonstration that stealth CMEs can be geoeffective and that near-radial multi-spacecraft alignments can constrain ICME evolution. The paper has clear strengths: the multi-instrument source-region analysis, the J-map heliospheric tracking, the use of three nearly aligned spacecraft, and the explicit comparison with three empirical Dst models. However, the headline radial-evolution results rest on a same-structure premise that is asserted rather than validated, and several quantitative inconsistencies (STA–WIND arrival delay, WIND MC interval, expansion speed) currently prevent the paper from delivering its central claim at the advertised confidence. The event itself is worth reporting, but the quantitative conclusions need substantial tightening.
major comments (5)
- [§5, Table 1, Fig. 8] The text states that the ICME meets STA at 22/21:20 UT and WIND at 23/07:30 UT and that 'A time difference of 21 hours is clearly evident.' The listed times differ by 10 h 10 min. The 21 h value is repeated in the abstract and is used to support the co-rotation estimate (14.5°/day × 12° ≈ 20 h). If the actual delay is ~10 h, the co-rotation argument and the arrival-time consistency story need to be revised. Please correct the numbers and recompute or remove the solar-rotation attribution.
- [§2, Table 1, Fig. 1 caption] The WIND MC interval is not uniquely defined: Table 1 and §2 give 23/18:00–24/07:30 UT, while the Fig. 1 caption says 23/18:00–24/17:30 UT. The WIND expansion speed is quoted as 25 km/s in §2 but as 40 km/s in Table 1 and 41.0 km/s in §5. Since the MC interval determines mean B, radial size, and expansion speed, these inconsistencies must be resolved before the WIND-based power-law results can be assessed.
- [§5, power-law fits] The exponents B_peak ∝ R_H^−2.1 (SolO–STA) and R_H^−1.7 (SolO–WIND), and B_av ∝ R_H^−1.97 and R_H^−1.53, are each based on two measurements only, with no error bars and no propagation of the hand-selected MC boundary choices. Given the uncertain WIND interval noted above, the differences between exponents may reflect interval selection rather than physical decay. Please provide uncertainties and a sensitivity test to boundary choices, and explicitly state the two-point limitation, or downgrade these scalings to qualitative.
- [§5, same-ICME premise] The paper states (Sec. 5) that comparable component variations indicate 'the same ICME structure' passed the three spacecraft. However, the MC type is ESW at SolO/STA but SWN at WIND, the Bz behavior is opposite at STA versus WIND, and the MVA axis orientations differ by tens of degrees. These differences could arise from different impact parameters or from sampling separate/inhomogeneous ejecta. Since the radial-size growth, expansion-speed decrease, B decay, and axis rotation are all interpreted as evolution of a single flux rope, the same-structure assumption is load-bearing. The paper should validate it explicitly (e.g., MVA eigenvector ratios, cross-correlation of field components, or a heliospheric propagation comparison) or reframe the multi-spacecraft comparison as sampling different regions of a structured ICME rather than as radial evolution of one coherent MC.
- [§3, §6] The causal linkage between the 19 March stealth CME and the storm driver is inferred from timing and morphological consistency, with no low-coronal eruption clearly observed and the authors explicitly 'speculate' about the reconnection process in Sec. 3. This is acceptable for a stealth-CME case study, but the wording in the abstract ('identified as the cause') is stronger than the evidence supports. A quantitative comparison of the in situ flux-rope orientation/helicity with the filament-channel orientation would materially strengthen the connection; otherwise the causal language should be tempered.
minor comments (6)
- [Abstract] The abstract uses 'SYM-H' with an odd rendering ('SY M− H') and mixes Dst (−163 nT) with SYM-H (−169/−170 nT) without defining the relation. Please state that Dst and SYM-H are used as complementary indices.
- [Fig. 1 caption] The caption describes 'purple dashed vertical line' for ICME arrival and 'blue vertical lines' for MC interval, while the corresponding text in Sec. 2 says the MC interval is 23/18:00 to 24/07:30; the caption's end time of 24/17:30 appears to be a typo. Check all such visual references.
- [§5] The approximation of RTN to GSE components (Bx → −BR, By → −BT, Bz → BN) is potentially confusing and can affect derived angles. Please state the coordinate transformation more rigorously or use the native RTN angles where appropriate.
- [§3] The GCS fit parameters (latitude −37°, tilt −80°, height 7.5 R⊙) are presented without uncertainties or a description of how unique the fit is. Since the stealth CME is faint, a short note on fit sensitivity would be useful.
- [References] The references for Bothmer & Schwenn 1998a and 1998b are identical; please verify the distinct bibliographic entries. Also fix the 'CDA W CME catalog' typo in Sec. 3.
- [§5] The definition of Vexp is given as Vleading − vtrailing, but the text then says a linear fit to velocity is used and the slope is taken as Vexp. Please clarify which method is used; the factor of 2 between these definitions matters for the expansion-speed comparison.
Circularity Check
No significant circularity: the paper's conclusions are observational fits and consistency checks, not outputs of fitted inputs; self-citations are not load-bearing.
full rationale
Walking the derivation chain, the solar-source identification (Sec. 3) rests on EUV/coronagraph signatures, GCS fitting, and an independent external study (Teng et al. 2024); heliospheric kinematics (Sec. 4) come from J-map height-time fits to white-light observations; in situ ICME characterization (Secs. 2 and 5) uses standard MVA and linear fits to measured plasma/magnetic-field time series; the radial scaling laws (B_peak ∝ R_H^-2.1 and B_av ∝ R_H^-1.97 / R_H^-1.53) are two-point power-law descriptions of measured peak/mean magnetic fields rather than predictions forced by fitted constants; and the storm-driver attribution (Sec. 6, Fig. 10) is benchmarked against published empirical Dst models (Burton, O'Brien-McPherron, Wang), not fit to the event. The self-citations (e.g., Vemareddy et al. 2012, 2017, 2022; Vemareddy 2024) appear only as background or a minor empirical remark and do not carry the central claim. The premise that SolO, STA, and WIND encountered the same ICME is an inference from comparable field-component variability; even if that premise is fragile, it is a validity/robustness risk, not a circular reduction. The paper's internal inconsistencies—such as the quoted '21-hour' STA-WIND delay versus the listed times implying ~10 h, and the differing WIND MC intervals in Table 1 versus Figure 1—are arithmetic or consistency errors, not demonstrations that a conclusion is equivalent to its input. No circular step is established.
Axiom & Free-Parameter Ledger
free parameters (3)
- MC interval boundaries =
SolO 21/13:30-19:30 UT, STA 23/02:30-17:00 UT, WIND 23/18:00-24/07:30 UT
- GCS model parameters =
lat -37 deg, tilt -80 deg, height 7.5 R_sun at 23:00 UT on Mar 19
- Magnetic field decay exponents =
-1.97 (SolO-STA), -1.53 (SolO-WIND)
axioms (4)
- domain assumption MVA eigenvector for intermediate variance gives MC axis orientation.
- domain assumption The same ICME flux rope is encountered at SolO, STA and WIND.
- domain assumption Empirical Dst models (Burton, O'Brien/McPherron, Wang) are valid predictors of SYM-H from solar wind parameters.
- domain assumption Solar wind drag accelerates slow CMEs.
Cite this review
Pith. "Pith review of An intense geomagnetic storm originated from stealth Coronal Mass Ejection: remote and $in situ$ observations by near radially aligned spacecraft." pith.science (2026). https://pith.science/paper/ZZROW7VN
@misc{pith2026250910090,
  author       = {Pith},
  title        = {Pith review of: An intense geomagnetic storm originated from stealth Coronal Mass Ejection: remote and $in situ$ observations by near radially aligned spacecraft},
  year         = {2026},
  howpublished = {\url{https://pith.science/paper/ZZROW7VN}},
  note         = {Machine review of arXiv:2509.10090}
}
read the original abstract
We investigate the solar origin and heliospheric evolution of an intense geomagnetic storm that occurred on March 23-24, 2023. Despite multiple candidate CMEs observed between March 19-21, a weak CME detected on March 19 at 18:00 UT was identified as the cause, originating from the eruption of a longitudinal-filament channel near center of the sun. The channel underwent a smooth transition to eruption phase without detectable low coronal signatures. Wide-angle heliospheric imaging revealed asymmetric expansion and acceleration by solar wind drag, achieving an average CME velocity of $\approx$640 km/s. The radial evolution of the interplanetary coronal mass ejection (ICME) was analyzed by three spacecraft in close radial alignment. Arrival times and propagation speeds were consistent across spacecraft, with a 21 hour delay between STEREO-A and WIND attributed to solar rotation and longitudinal separation. The ICME exhibits magnetic cloud (MC) signatures characterized by right-handed helicity, enhanced density at all three spacecraft. The MC underwent expansion (radial-size increases from 0.08AU at SolO to 0.18AU at STEREO-A), decrease in magnetic field strength with distance; $B_{av}\propto R_H^{-1.97}$ (SolO-STA) and $B_{av}\propto R_H^{-1.53}$ (SolO-WIND). The MC axis is inclined with the ecliptic at $-69^o$ at SolO, $-25^o$ at STA and $-34^o$ at WIND, indicating rotation during heliospheric transit. Importantly, the storm's main phase leads to a peak intensity ($SYM-H=-169$nT) occurring at 24/02:40UT followed by a second peak ($SYM-H=-170$nT) at 24/05:20UT due to density enhancement towards MC's tail. The study emphasizes the significant geoeffectiveness of weak, stealth CMEs with southward Bz and density enhancements.
Figures




Reference graph
Works this paper leans on
-
[1]
2017, ApJ, 840, 103
Alzate, N., & Morgan, H. 2017, ApJ, 840, 103
2017
-
[2]
Roldugin, A. V. 2024, Bulletin of the Russian Academy of Sciences, Physics, 88, 359, doi: 10.1134/S1062873823705524
-
[3]
K., Chakrabarty, D., Janardhan, P., et al
Bisoi, S. K., Chakrabarty, D., Janardhan, P., et al. 2016, Journal of Geophysical Research (Space Physics), 121, 3882, doi: 10.1002/2015JA022185
-
[5]
1998b, Annales Geophysicae, 16, 1, doi: 10.1007/s00585-997-0001-x
Bothmer, V., & Schwenn, R. 1998b, Annales Geophysicae, 16, 1, doi: 10.1007/s00585-997-0001-x
-
[6]
Brueckner, G. E., Howard, R. A., Koomen, M. J., & et al. 1995, SoPh, 162, 357, doi: 10.1007/BF00733434
-
[7]
Burton, R. K., McPherron, R. L., & Russell, C. T. 1975, J. Geophys. Res., 80, 4204, doi: 10.1029/JA080i031p04204
-
[8]
Canfield, R. C., Hudson, H. S., & McKenzie, D. E. 1999, Geophys. Res. Lett., 26, 627, doi: 10.1029/1999GL900105
-
[9]
Cargill, P. J. 2004, SoPh, 221, 135, doi: 10.1023/B:SOLA.0000033366.10725.a2
arXiv 2004
-
[10]
Cheng, X., Zhang, J., Ding, M. D., et al. 2013, ApJL, 769, L25, doi: 10.1088/2041-8205/769/2/L25
-
[11]
Davies, E. E., Forsyth, R. J., Good, S. W., & Kilpua, E. K. J. 2020, SoPh, 295, 157, doi: 10.1007/s11207-020-01714-z
-
[12]
Davies, E. E., M¨ ostl, C., Owens, M. J., et al. 2021, A&A, 656, A2, doi: 10.1051/0004-6361/202040113
-
[13]
Fenrich, F. R., & Luhmann, J. G. 1998, Geophys. Res. Lett., 25, 2999, doi: 10.1029/98GL51180
-
[14]
Galvin, A. B., Kistler, L. M., Popecki, M. A., et al. 2008, SSRv, 136, 437, doi: 10.1007/s11214-007-9296-x
-
[15]
1983, in NASA Conference Publication, Vol
Goldstein, H. 1983, in NASA Conference Publication, Vol. 228, NASA Conference Publication, ed. M. Neugebauer, 0.731
1983
-
[16]
1994, Journal of Geophysical Research: Space Physics, 99, 5771, doi: 10.1029/93JA02867
Gonzalez, Joselyn, J.-A., Kamide, Y., et al. 1994, Journal of Geophysical Research: Space Physics, 99, 5771, doi: 10.1029/93JA02867
-
[17]
D., Tsurutani, B
Gonzalez, W. D., Tsurutani, B. T., & Cl´ ua de Gonzalez, A. L. 1999, Space Science Reviews, 88, 529
1999
-
[18]
2011, in Astronomical Society of India Conference Series, Vol
Gopalswamy, N. 2011, in Astronomical Society of India Conference Series, Vol. 2, Astronomical Society of India Conference Series, 241–258
2011
-
[19]
2003, ApJ, 586, 562, doi: 10.1086/367614
Gopalswamy, N., Shimojo, M., Lu, W., et al. 2003, ApJ, 586, 562, doi: 10.1086/367614
-
[20]
2022, Journal of Geophysical Research (Space Physics), 127, e30404, doi: 10.1029/2022JA030404
Gopalswamy, N., Yashiro, S., Akiyama, S., et al. 2022, Journal of Geophysical Research (Space Physics), 127, e30404, doi: 10.1029/2022JA030404
-
[21]
Gopalswamy, N., Yashiro, S., Krucker, S., & Howard, R. A. 2005, in IAU Symposium, Vol. 226, Coronal and Stellar Mass Ejections, ed. K. Dere, J. Wang, & Y. Yan, 367–373, doi: 10.1017/S1743921305000876
-
[22]
Gosling, J. T., McComas, D. J., Phillips, J. L., & Bame, S. J. 1991, J. Geophys. Res., 96, 7831, doi: 10.1029/91JA00316
-
[23]
S., O’Brien, H., Carrasco Blazquez, I., et al
Horbury, T. S., O’Brien, H., Carrasco Blazquez, I., et al. 2020, A&A, 642, A9, doi: 10.1051/0004-6361/201937257
-
[24]
Koomen, M. J. 1982, ApJL, 263, L101, doi: 10.1086/183932
doi:10.1086/183932 1982
-
[25]
Kaiser, M. L., Kucera, T. A., Davila, J. M., et al. 2008, SSRv, 136, 5, doi: 10.1007/s11214-007-9277-0
-
[26]
Lemen, J. R., Title, A. M., Akin, D. J., & et al. 2012, SoPh, 275, 17, doi: 10.1007/s11207-011-9776-8
-
[27]
Lepping, R. P., Ac˜ una, M. H., Burlaga, L. F., et al. 1995, SSRv, 71, 207, doi: 10.1007/BF00751330
-
[28]
Lugaz, N., Salman, T. M., Zhuang, B., et al. 2022, ApJ, 929, 149, doi: 10.3847/1538-4357/ac602f
-
[29]
Luhmann, J. G., Curtis, D. W., Schroeder, P., et al. 2008, SSRv, 136, 117, doi: 10.1007/s11214-007-9170-x M¨ ostl, C., Weiss, A. J., Reiss, M. A., et al. 2022, ApJL, 924, L6, doi: 10.3847/2041-8213/ac42d0
-
[30]
Mulligan, T., Russell, C. T., & Luhmann, J. G. 1998, Geophys. Res. Lett., 25, 2959, doi: 10.1029/98GL01302
-
[31]
Nitta, N. V., & Mulligan, T. 2017, SoPh, 292, 125, doi: 10.1007/s11207-017-1147-7 16 Vemareddy and Selva Bharathi
-
[32]
Nitta, N. V., Mulligan, T., Kilpua, E. K. J., et al. 2021, SSRv, 217, 82, doi: 10.1007/s11214-021-00857-0
-
[33]
Nykiel, G., Ferreira, A., G¨ unzkofer, F., et al. 2024, Journal of Geophysical Research (Space Physics), 129, e2023JA032145, doi: 10.1029/2023JA032145 O’Brien, T. P., & McPherron, R. L. 2000, J. Geophys. Res., 105, 7707, doi: 10.1029/1998JA000437
-
[34]
Ogilvie, K. W., Chornay, D. J., Fritzenreiter, R. J., et al. 1995, SSRv, 71, 55, doi: 10.1007/BF00751326 O’Kane, J., Green, L. M., Davies, E. E., et al. 2021, A&A, 656, L6, doi: 10.1051/0004-6361/202140622
-
[35]
Oughton, E. J., Skelton, A., Horne, R. B., Thomson, A. W. P., & Gaunt, C. T. 2017, Space Weather, 15, 65, doi: 10.1002/2016SW001491
-
[36]
Pesnell, W. D., Thompson, B. J., & Chamberlin, P. C. 2012, SoPh, 275, 3, doi: 10.1007/s11207-011-9841-3
-
[37]
A., Panasenco, O., & Martin, S
Pevtsov, A. A., Panasenco, O., & Martin, S. F. 2012, Solar Flare Magnetic Fields and Plasmas, 185
2012
-
[38]
Richardson, I. G., & Cane, H. V. 2010, SoPh, 264, 189, doi: 10.1007/s11207-010-9568-6
-
[39]
2009, ApJ, 701, 283, doi: 10.1088/0004-637X/701/1/283
Robbrecht, E., Patsourakos, S., & Vourlidas, A. 2009, ApJ, 701, 283, doi: 10.1088/0004-637X/701/1/283
-
[40]
Sonnerup, B. U. O., & Cahill, Jr., L. J. 1967, J. Geophys. Res., 72, 171, doi: 10.1029/JZ072i001p00171
-
[41]
2024, Nature Communications, 15, 9198, doi: 10.1038/s41467-024-53538-1
Teng, W., Su, Y., Ji, H., & Zhang, Q. 2024, Nature Communications, 15, 9198, doi: 10.1038/s41467-024-53538-1
-
[42]
Thernisien, A., Vourlidas, A., & Howard, R. A. 2009, SoPh, 256, 111, doi: 10.1007/s11207-009-9346-5
-
[43]
Doddamani, V. H. 2019, ApJ, 874, 182, doi: 10.3847/1538-4357/ab0a06
-
[44]
2024, ApJ, 961, 199
Vemareddy, P. 2024, ApJ, 961, 199
2024
-
[45]
2022, ApJ, 927, 108, doi: 10.3847/1538-4357/ac4dfe
Vemareddy, P., D´ emoulin, P., Sasikumar Raja, K., et al. 2022, ApJ, 927, 108, doi: 10.3847/1538-4357/ac4dfe
-
[46]
2017, ApJ, 850, 38, doi: 10.3847/1538-4357/aa9020
Vemareddy, P., Gopalswamy, N., & Ravindra, B. 2017, ApJ, 850, 38, doi: 10.3847/1538-4357/aa9020
-
[47]
Vemareddy, P., & Ibrahim, M. S. 2024, MNRAS, 527, 1774
2024
-
[48]
Vemareddy, P., Maurya, R. A., & Ambastha, A. 2012, SoPh, 277, 337, doi: 10.1007/s11207-011-9903-6
-
[49]
2014, ApJ, 797, 80, doi: 10.1088/0004-637X/797/2/80
Vemareddy, P., & Zhang, J. 2014, ApJ, 797, 80, doi: 10.1088/0004-637X/797/2/80
-
[50]
Wang, C. B., Chao, J. K., & Lin, C. H. 2003, Journal of Geophysical Research (Space Physics), 108, 1341, doi: 10.1029/2003JA009851
-
[51]
Webb, D. F., & Hundhausen, A. J. 1987, SoPh, 108, 383, doi: 10.1007/BF00214170
-
[52]
Yashiro, S., Gopalswamy, N., Michalek, G., St. Cyr, O. C., & et al. 2004, Journal of Geophysical Research (Space Physics), 109, 7105, doi: 10.1029/2003JA010282
-
[53]
Zhang, J., Richardson, I. G., Webb, D. F., et al. 2007, Journal of Geophysical Research (Space Physics), 112, A10102, doi: 10.1029/2007JA012321
This paper was first reviewed by deepseek-v4-flash on August 4, 2026.
discussion (0)
Sign in with ORCID, Apple, or X to comment. Anyone can read and Pith papers without signing in.