REVIEW 4 major objections 5 minor 1 cited by
The paper claims that forecasting on bursty, intermittent network telemetry becomes viable when the series is first decomposed into inter-burst gaps and burst intensities, each modeled by its own quantile-tokenized autoregressive transforme
Reviewed by Pith at T0; open to challenge. T0 means a machine referee read the full paper against a public rubric. the ladder, T0–T4 →
2026-08-04 08:06 UTC pith:FWJH2IM3
load-bearing objection NetBurst has a sensible event-centric architecture and large reported gains on production telemetry, but the headline MASE is event-only and the activity threshold is unspecified. the 4 major comments →
NetBurst: Event-Centric Forecasting of Bursty, Intermittent Time Series
The pith
A machine-rendered reading of the paper's core claim, the machinery that carries it, and where it could break.
Core claim
The central discovery is that the failure of sequence forecasters on bursty telemetry is not due to a lack of model capacity but to a mismatch of representation: uniform binning and continuous-value regression waste resolution on idle and mid-range values while erasing the rare extremes that dominate error. NETBURST replaces the raw series with two token streams—inter-burst gaps (when bursts start) and burst intensities (how large they are)—using quantile codebooks that allocate equal probability mass per bin, and models each stream with its own autoregressive transformer. The eventization step is what makes the difference: it collapses long idle stretches into single gap tokens, so the mode
What carries the argument
The central object is the event-centric decomposition of a time series into two streams: inter-burst gaps (IBG), the waiting times between bursts, and burst intensities (BI), the total activity within each burst. A fixed threshold defines bursts; consecutive windows above it form a burst, and everything else collapses into one gap. Each stream is discretized with a quantile codebook—bins of equal probability mass fitted on training data—so heavy tails keep high resolution, then modeled by two independent autoregressive transformer heads. Reconstruction accumulates predicted gaps into burst start times and places each predicted intensity at that window, yielding a byte-count series that prese
Load-bearing premise
The pipeline's eventization relies on a fixed activity threshold T_act to decide what counts as a burst; the paper does not report the threshold used for the headline service-level results, and if no single threshold cleanly separates bursts from ebbs across entities and datasets—or if the threshold is chosen with knowledge of the test behavior—then the IBG/BI streams misrepresent the series and the reported gains do not generalize.
What would settle it
Recompute the headline comparisons using the standard definition of MASE over all time steps, including idle intervals, rather than only on burst events, and using thresholds chosen solely from training data. If the 13-605x margins shrink to a small factor, or if on a held-out service trace with a fixed threshold the advantage over a strong transformer baseline disappears, the central claim is not supported.
If this is right
- If NETBURST is correct, operators can obtain usable forecasts for service, IP, and subnet telemetry where current open-source foundation forecasters produce errors one to three orders of magnitude larger.
- The oracle analysis implies a concrete improvement path: invest in better timing models for sparse service-level data, and in better magnitude models for denser IP/subnet aggregates.
- The quantile-tokenization ablation indicates that even without the full event decomposition, switching from uniform bins to quantile bins would substantially improve existing token-based forecasters on heavy-tailed series.
- The transferability results suggest that one pretrained event-centric model can serve multiple spatial granularities, with only threshold-based adaptation, reducing the cost of per-granularity training.
- Because the decomposition preserves burst distribution, NETBURST's forecasts can support downstream tasks that depend on extremes, such as anomaly detection and capacity planning, without underestimating tail events.
Where Pith is reading between the lines
- A natural next test is applying the same eventization to other heavy-tailed domains the paper lists (finance, reliability logs, epidemic counts), where the same failure modes should appear and the same decomposition should help—an extension the paper does not run.
- A plausible plug-in improvement for the wider field: any transformer forecaster that uses uniform binning could adopt quantile codebooks without changing its architecture; the paper's ablation shows this alone recovers a large share of the gain on IP/subnet data.
- The fixed-threshold limitation suggests an adaptive threshold—e.g., learned per entity or set by a change-point detector—is the most direct way to push the method further; the paper acknowledges this in its limitations.
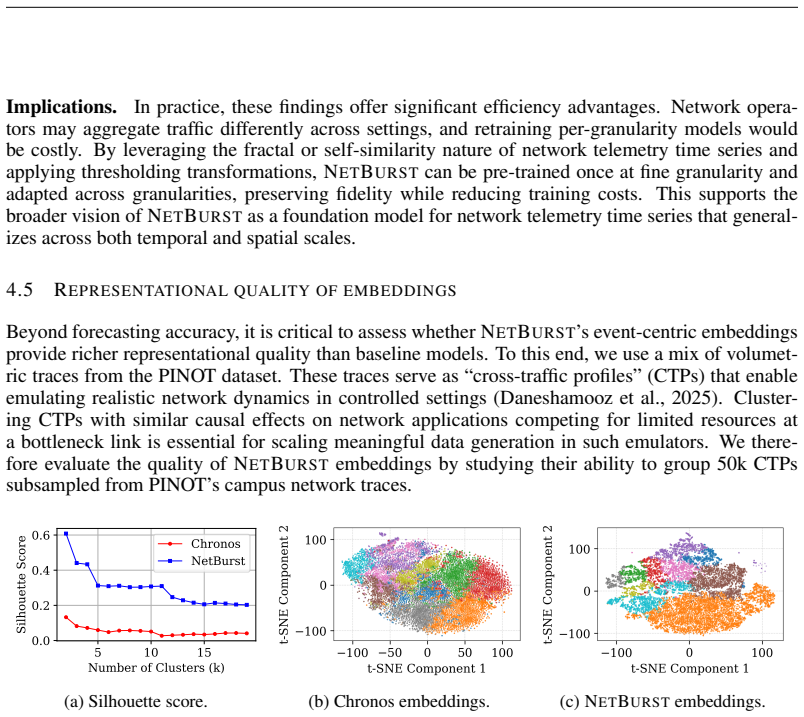
- The clustering results hint that the event-centric embeddings could serve as unsupervised features for traffic classification and anomaly detection; the paper evaluates only silhouette scores and t-SNE, so a direct measure of anomaly-detection accuracy would sharpen this claim.
Editorial analysis
A structured set of objections, weighed in public.
Referee Report
Summary. The paper proposes NetBurst, an event-centric forecasting pipeline for bursty, intermittent network telemetry. Raw byte-count series are converted into inter-burst gap (IBG) and burst intensity (BI) streams via an activity threshold, discretized with quantile codebooks, and modeled by two independent autoregressive transformers. Reconstructed forecasts are evaluated with MASE and Wasserstein distance, and the learned embeddings are assessed for clustering and cross-granularity transfer. The central claim is that NetBurst achieves 13–605x MASE reductions over strong baselines on service-level PINOT/MAWI data while preserving burstiness and matching baselines on mild benchmarks.
Significance. If fully supported, the event-centric decomposition would be a genuinely useful direction for forecasting sparse, heavy-tailed telemetry, where standard dense-sequence transformers are known to fail. The paper identifies a real problem and proposes a principled response: disentangling event timing from magnitude and allocating tokenizer resolution to the tails. I credit the authors for making code and preprocessed data available and for reporting detailed hyperparameters. However, the current evidence is substantially weakened by the event-only MASE definition, the unspecified activity threshold for the headline numbers, the absence of reported mild-benchmark results, and the partly circular Wasserstein-distance fidelity metric. These issues are fixable in revision, but they are load-bearing for the paper's main claims.
major comments (4)
- [§4.1, Table 4] The headline metric is 'MASE computed only on events', but the paper never formally defines an event mask or the scaling factor. Excluding idle/ebb periods removes exactly the intervals where zero-predicting baselines incur no error, so the 13–605x ratios are not comparable to standard all-point MASE values reported in prior work. Please report all-point MASE as well (or at least both variants) and give the precise event-window definition, including whether the scaling denominator is computed only on events or on the full series.
- [§3, §4.1, Table 4] The activity threshold T_act is never specified for the main results in Table 4. Section 4.1 states eventization is applied post-split and codebooks are fit on training data, but no T_act value is given for any dataset or granularity. Figure 3 justifies window sizes, not T_act, and Figure 7 sweeps thresholds only in the transfer experiment. Since the IBG/BI streams and all downstream metrics are defined by this threshold, the headline MASE and WD numbers are not reproducible unless the chosen T_act values and a sensitivity analysis (or a principled selection rule restricted to training data) are provided.
- [Abstract and §4] The abstract claims NetBurst 'matches baselines on mild-regime benchmarks' and compares against Chronos-2 and Toto, but Section 4 reports no results on Electricity, Taxi, ETT, Weather, or Exchange Rate, and no experiments with Chronos-2 or Toto appear anywhere in the paper. The evaluation only covers PINOT/MAWI telemetry with Chronos-T5, Lag-Llama, DeepAR, and N-BEATS. Either add the missing benchmark table and baseline comparisons, or revise the abstract so it does not claim results that are not presented.
- [§4.2, Table 5] The Wasserstein-distance fidelity claim is partly built into the output representation. Reconstruction maps quantile tokens to centroids of codebooks fitted on the training distribution, so the marginal distribution of reconstructed bursts can resemble the true marginal even if the forecast assigns the wrong magnitudes to the wrong times. To establish that WD reflects forecasting skill, report WD separately for event timing and event magnitudes, and include a control baseline that draws tokens from the training codebook frequencies without any autoregressive model. Without such a control, the low WD values in Table 5 do not support the claim that NetBurst preserves burstiness through predictive skill.
minor comments (5)
- [§3, Eq. (1)] The eventization formula should define τ0 and ρk and specify how bursts that straddle the end of the series are handled. Also clarify whether IBG_1 = τ1 is measured from the start of the series or from the first time step.
- [§2, Table 1] It should be stated explicitly whether the baseline MASE values in Table 1 use the same event-only definition as Section 4.1. Mixing metric definitions would make the 'collapse' comparison misleading.
- [§4.2] There are typographical issues: 'MA WI' instead of 'MAWI', and Figure 4 has an empty y-axis label 'MASE ( )'. Please correct these and ensure all axis labels are complete.
- [§4.4] The text contains typos such as 'service-lelel' and 'respectivley'. In addition, Figure 7's axes show '100200300400500 B' with no comma or unit separation; this should be cleaned up.
- [§4.2] No confidence intervals or variance measures are reported for MASE or WD across entities. Given the heavy-tailed nature of the data, bootstrapped intervals or at least median/quartile summaries would strengthen the comparisons.
Circularity Check
Partial circularity in the burstiness/WD fidelity claim due to training-fitted quantile codebooks; central MASE result is independent.
specific steps
-
fitted input called prediction
[Section 3 (Quantile Tokenization) and Section 4.2 (Table 5)]
"we construct global quantile codebooks Q IBG, Q BI such that each bin holds approximately equal mass on the training data. ... reconstruction replaces each token with its bin centroid QIBG, QBI. ... We address this by reporting in Table 5 the Wasserstein distance (WD), which evaluates distributional fidelity."
The codebook is fitted to the training quantiles, so every reconstructed IBG/BI value comes from centroids whose bin masses equal the training marginal mass by construction. Any token stream with roughly uniform bin usage reproduces the training marginal up to quantization, independent of timing or predictive skill, so the reported low WD ('preserves burstiness') is substantially an artifact of the output representation rather than a validated forecast property. The MASE results do not reduce to the codebook in this way, so the headline forecasting claim remains independent.
full rationale
The headline 13–605× MASE improvement is a pointwise event-window comparison that does not reduce to the codebook or to any self-citation. Self-citations (PINOT data, NetReplica CTPs, Willinger on self-similarity, ONTAS anonymization) are background/motivation and are not load-bearing in the derivation. The main circularity concern is localized to distributional fidelity: the quantile codebooks are fitted on training data and reconstruction is restricted to their centroids, so the Wasserstein-distance claim in Table 5 is partly guaranteed by the output representation, not by dual-autoregressor skill. Separately, Section 5's admitted limitation that 'Eventization relies on fixed thresholds' plus the absence of the T_act value for Table 4 makes the headline experiment under-specified, but a missing threshold is a reproducibility/correctness issue rather than a circularity. Overall the central forecasting contribution has independent content; the partial codebook anchoring affects only the secondary burstiness-fidelity claim, so a moderate score is appropriate.
Axiom & Free-Parameter Ledger
free parameters (3)
- Activity threshold T_act =
Not specified for main results; sweeps 0–400 bytes (Fig. 3) and 100–500 B (Fig. 7)
- Codebook size B =
4096 bins per stream
- Quantile bin boundaries/centroids =
Fit on training split for each dataset
axioms (3)
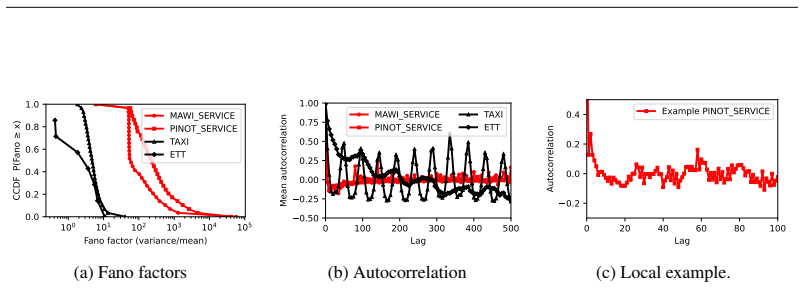
- domain assumption Network telemetry time series are bursty, intermittent, self-similar/heavy-tailed, with structure that repeats across granularities after thresholding.
- domain assumption A fixed activity threshold with consecutive-window bursts is a sufficient event definition for forecasting.
- ad hoc to paper Spike placement (allocating each predicted burst entirely to its starting window) is an acceptable reconstruction for evaluation.
read the original abstract
Network operators monitor their infrastructure by collecting telemetry data such as packet counts, byte rates, or flow volumes, yet answering the questions that effective operations demand -- forecasting future load, diagnosing and characterizing anomalies, and searching for and retrieving historical precedents -- requires more than raw measurements. Bridging this gap calls for learned representations: compact per-entity summaries that capture temporal dynamics from each entity's univariate time series. Time-series foundation models are the natural starting point, but they are designed for dense, periodic benchmark datasets -- the \emph{mild} statistical regime. However, network telemetry data inhabits the \emph{wild} regime: operationally relevant events are rare, separated by variable-length stretches of low or no activity (``ebbs''), with intermittent bursts of heavy-tailed extremes (``tides''). We present NetBurst, an event-centric pipeline that collapses ebbs, separates each time series into a stream of burst timings and a stream of burst magnitudes, and learns a single representation serving all three operational tasks. Compared to the strongest competitors among eight baselines -- including Amazon's Chronos-2 and Datadog's Toto -- and across nine production telemetry configurations, NetBurst reduces median forecasting error by $1.3$--$116\times$ on wild-regime data with a $1.0$--$7.5\times$ better match to the true burst distribution, and matches baselines on mild-regime benchmarks. For characterizing anomalies, NetBurst produces balanced, well-spread clusters that are $16\times$ more describable in operator-familiar terms under a novel interpretability score, and cluster-filtered search delivers $7.5\times$ faster end-to-end retrieval.
Figures


Forward citations
Cited by 1 Pith paper
-
Pramana: A Composable, Domain-Specific Backend for Empirical Networking Research
One intent-specification language can express all 255 networking data-generation intents mined from 66 papers, and a proof-of-concept backend already covers 34 percent—more than twice the best existing tool.
Reference graph
Works this paper leans on
-
[7]
Association for Computing Machinery. ISBN 9798400704901. doi: 10.1145/3637528.3671720. URLhttps://doi.org/10.1145/ 3637528.3671720. Shubham Misar. Nyc-taxi — time series — lstm. Kaggle Code,
-
[8]
Lag- llama: Towards foundation models for time series forecasting
14 Kashif Rasul, Arjun Ashok, Andrew Robert Williams, Arian Khorasani, George Adamopoulos, Rishika Bhagwatkar, Marin Biloˇs, Hena Ghonia, Nadhir Hassen, Anderson Schneider, et al. Lag- llama: Towards foundation models for time series forecasting. InR0-FoMo: Robustness of Few- shot and Zero-shot Learning in Large Foundation Models, 2023a. Kashif Rasul, Arj...
2023
-
[10]
Victor Verma, Stilian Stoev, and Yang Chen
DOI: https://doi.org/10.24432/C58C86. Victor Verma, Stilian Stoev, and Yang Chen. On the optimal prediction of extreme events in heavy- tailed time series with applications to solar flare forecasting,
-
[11]
URLhttps://arxiv. org/abs/2407.11887. Adam Wierman. An introduction to heavy tails for ml researchers. Keynote at NeurIPS 2023 Workshop on Heavy Tails in Machine Learning,
Pith/arXiv arXiv 2023
-
[1971]
Ontas: Flexible and scalable online network traffic anonymization system
Hyojoon Kim and Arpit Gupta. Ontas: Flexible and scalable online network traffic anonymization system. InProceedings of the 2019 Workshop on Network Meets AI & ML, NetAI’19, pp. 15–21, New York, NY , USA,
2019
-
[2005]
ISBN 0-7803-8786-4. doi: 10.1109/WSC.2004.1371310. Haoyi Zhou, Shanghang Zhang, Jieqi Peng, Shuai Zhang, Jianxin Li, Hui Xiong, and Wancai Zhang. Informer: Beyond efficient transformer for long sequence time-series forecasting. InProceedings of the AAAI conference on artificial intelligence, volume 35, pp. 11106–11115,
Pith/arXiv arXiv 2004
-
[2015]
Jaber Daneshamooz, Jessica Nguyen, William Chen, Sanjay Chandrasekaran, Satyandra Guthula, Ankit Gupta, Arpit Gupta, and Walter Willinger. Addressing the ml domain adaptation problem for networking: Realistic and controllable training data generation with netreplica.arXiv preprint arXiv:2507.13476,
-
[2016]
ISSN 0304-4149. doi: https://doi. org/10.1016/j.spa.2016.04.008. URLhttps://www.sciencedirect.com/science/ article/pii/S0304414916300308. In Memoriam: Evarist Gin ´e. Zizhuo Meng, Ke Wan, Yadong Huang, Zhidong Li, Yang Wang, and Feng Zhou. Interpretable transformer hawkes processes: Unveiling complex interactions in social networks. InProceed- ings of the...
-
[2019]
Association for Computing Machinery. ISBN 9781450368728. doi: 10.1145/3341216.3342208. URLhttps://doi.org/10.1145/3341216.3342208. Diederik P. Kingma and Jimmy Ba. Adam: A method for stochastic optimization. CoRR, abs/1412.6980,
-
[2020]
doi: https://doi.org/10.1016/j.ijforecast.2019.07.001
ISSN 0169-2070. doi: https://doi.org/10.1016/j.ijforecast.2019.07.001. URLhttps://www. sciencedirect.com/science/article/pii/S0169207019301888. Ketan Rajshekhar Shahapure and Charles Nicholas. Cluster quality analysis using silhouette score. In2020 IEEE 7th international conference on data science and advanced analytics (DSAA), pp. 747–748. IEEE,
-
[2024]
URL https://openreview.net/forum?id=gerNCVqqtR
ISSN 2835-8856. URL https://openreview.net/forum?id=gerNCVqqtR. Roman Beltiukov, Sanjay Chandrasekaran, Arpit Gupta, and Walter Willinger. Pinot: Programmable infrastructure for networking. InProceedings of the 2023 Applied Networking Research Work- shop, pp. 51–53,
2023
-
[2025]
Ali Hasan, Yuting Ng, Jose Blanchet, and Vahid Tarokh
URLhttps://www.osti.gov/ biblio/2571672. Ali Hasan, Yuting Ng, Jose Blanchet, and Vahid Tarokh. Representation learning for extremes. In NeurIPS 2023 Workshop Heavy Tails in Machine Learning,
arXiv 2023
This paper was first reviewed by deepseek-v4-flash on August 4, 2026.
discussion (0)
Sign in with ORCID, Apple, or X to comment. Anyone can read and Pith papers without signing in.