pith. sign in

arxiv: 2511.03564 · v2 · submitted 2025-11-05 · ⚛️ physics.app-ph · nucl-ex· nucl-th

ENDF/B-VIII.1: Updated Nuclear Reaction Data Library for Science and Applications

Pith reviewed 2026-05-18 01:11 UTC · model grok-4.3

classification ⚛️ physics.app-ph nucl-exnucl-th
keywords nuclear data libraryevaluated cross sectionsintegral experimentsresonance parametersreactor simulationshigh burnup performancethermal scattering kernelscovariance data
0
0 comments X

The pith

The ENDF/B-VIII.1 library updates nuclear reaction data for key isotopes and reduces biases in simulations of integral experiments for fluorine, copper, and stainless steel.

A machine-rendered reading of the paper's core claim, the machinery that carries it, and where it could break.

This paper presents an updated collection of evaluated nuclear reaction data intended for use in science and technology applications. It incorporates reevaluations for plutonium-239 and numerous other nuclides along with new thermal neutron scattering kernels and improved covariance information. These changes produce lower biases when the data are used to simulate many integral experiments, with clear gains for cases involving fluorine, copper, and stainless steel. The updates also correct earlier problems with high-burnup fuel performance by refining resonance-region data for uranium-238 and several plutonium isotopes, yielding results comparable to the prior reference library.

Core claim

The central claim is that reevaluating important nuclides and adopting updated cross sections and resonance parameters has reduced bias in simulations of many integral experiments, with particular progress for fluorine, copper, and stainless steel containing benchmarks. Improvements to the 238U and 239,240,241Pu files in the resonance region address previous data issues in high burnup applications, restoring performance similar to the reference ENDF/B-VII.1 library while adding new photonuclear, charged-particle, and atomic data plus numerous thermal scattering kernels.

What carries the argument

The ENDF/B-VIII.1 evaluated nuclear data library, which assembles updated resonance parameters, cross sections, and scattering kernels for dozens of nuclides and carries the revised uncertainty information.

If this is right

  • Simulations of reactor systems containing fluorine, copper, or stainless steel components gain accuracy and require smaller corrections for data bias.
  • High-burnup fuel performance predictions become reliable enough to support commercial power applications without the limitations seen in the prior release.
  • Dosimetry calculations improve through the inclusion of over sixty updated cross sections.
  • Uncertainty estimates for calculations become more consistent due to revised covariance standards and testing procedures.
  • New applications in photonuclear and charged-particle reactions become feasible with the added sublibraries.

Where Pith is reading between the lines

These are editorial extensions of the paper, not claims the author makes directly.

  • Design studies for advanced reactors could use the reduced biases to lower conservative margins in safety analyses for the highlighted materials.
  • The library's improved resonance data for actinides may extend naturally to burnup calculations in other fuel cycles not yet benchmarked.
  • Availability in both ENDF-6 and GNDS formats could speed integration into modern transport codes that prefer structured data objects.

Load-bearing premise

The reevaluated resonance parameters and cross sections accurately capture the true nuclear physics without introducing new systematic biases that would appear only in untested integral experiments.

What would settle it

A new integral experiment benchmark using a material or irradiation condition outside the current validation set that exhibits larger simulation bias than with the previous library version.

Figures

Figures reproduced from arXiv: 2511.03564 by A.A. Sonzogni, A.C. Dreyfuss, A.C. Kahler, A. Daskalakis, A.D. Carlson, A.E. Lovell, A.I. Hawari, A.J. Koning, A. Lauer-Coles, A. Mattera, A.M. Lewis, A. Ney, A. Qteish, A.R. Junghans, A. Trkov, B. Beck, B.K. Laramee, C.M. Mattoon, C.M. Percher, C.W. Chapman, C. Wemple, D.A. Brown, D. Bernard, D.D. DiJulio, D.E. Cullen, D.K. Parsons, D. Neudecker, D.P. Barry, D. Rochman, D. Roubtsov, D. Wiarda, E.V. Chimanski, G. Arbanas, G. Gert, G.J. Siemers, G.M. Hale, G. Muhrer, G. Noguere, G.P.A. Nobre, G. Potel, G. Schnabel, H.I. Kim, H.Y. Lee, I. Al-Qasir, I. Dur\'an, I.J. Thompson, I. Stetcu, J. Cotchen, J.D. Haverkamp, J.D. McDonnell, J. Holmes, J.I. M\'arquez Dami\'an, J.J. Ressler, J.L. Wormald, J. Malec, J.M. Brown, J.P.W. Crozier, J. Thompson, K.A. Wendt, K.H. Guber, K.J. Kelly, K. Kravvaris, K. Rami\'c, K.S. Kim, L. Leal, M.-A. Descalle, M.B. Chadwick, M. Cornock, M. Dunn, M. Hursin, M. Ko\v{s}t\'al, M. Rapp, M. Rising, M.R. Mumpower, M. Schulc, M.T. Pigni, M. Vorabbi, M.W. Herman, M. White, M.W. Paris, M. Zerkle, N.A. Gibson, N.A. Kleedtke, N.C. Fleming, N. Jisrawi, O. Cabellos, P. Brain, P. Dimitriou, P.K. Romano, P. Talou, R. Arcilla, R. Beyer, R. Capote, R. Coles, R. Ferrer, R.J. Casperson, R.Q. Wright, S.C. van der Marck, S. Quaglioni, T. Gaines, T.H. Trumbull, T. Kawano, V. Gillette, V.G. Pronyaev, W.E. Ormand, W. Haeck, W.J. Marshall, Y. Cheng, Y. Danon.

Figure 2
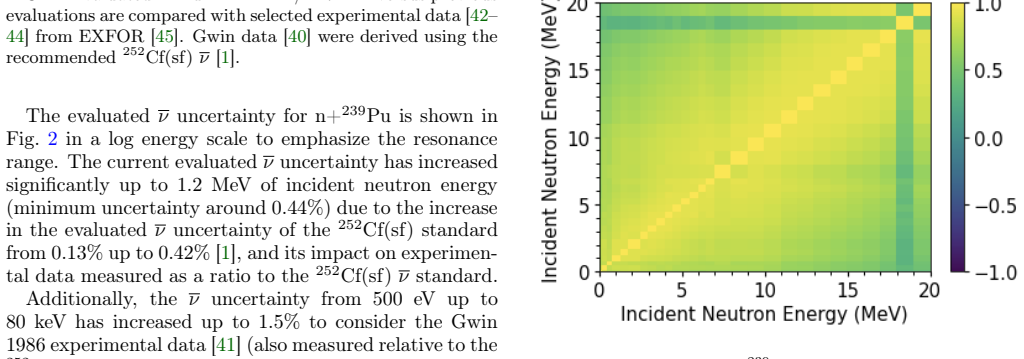
Figure 2. Figure 2: in a log energy scale to emphasize the resonance range. The current evaluated ν uncertainty has increased significantly up to 1.2 MeV of incident neutron energy (minimum uncertainty around 0.44%) due to the increase in the evaluated ν uncertainty of the 252Cf(sf) standard from 0.13% up to 0.42% [1], and its impact on experimen￾tal data measured as a ratio to the 252Cf(sf) ν standard. Additionally, the ν un… view at source ↗
Figure 3
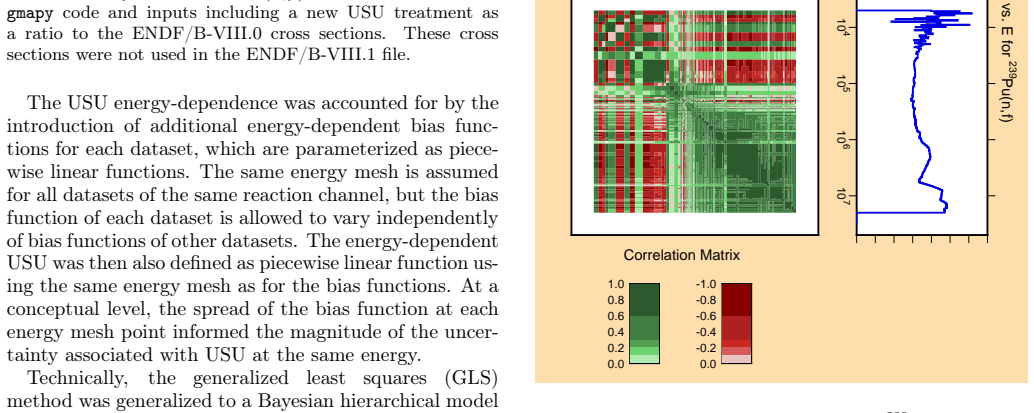
Figure 3. Figure 3: is strongly and positively correlated due to the full correlation stemming from the dominant 252Cf(sf) ν standard uncertainty. A reevaluation of the 252Cf(sf) ν standard is planned for ENDF/B-IX.0. The neutron-induced average prompt fission neutron multiplicity, ν, for n+239Pu in the fast neutron range (above 80 keV of incident neutron energy) was reevalu￾ated from scratch for ENDF/B-VIII.0 [38, 48]. Exper… view at source ↗
Figure 5
Figure 5. Figure 5: FIG. 5. Evaluated [PITH_FULL_IMAGE:figures/full_fig_p009_5.png] view at source ↗
Figure 4
Figure 4. Figure 4: FIG. 4. Selected experimental data from EXFOR [ [PITH_FULL_IMAGE:figures/full_fig_p009_4.png] view at source ↗
Figure 6
Figure 6. Figure 6: FIG. 6. Evaluated [PITH_FULL_IMAGE:figures/full_fig_p009_6.png] view at source ↗
Figure 7
Figure 7. Figure 7: FIG. 7. Selected experimental data from EXFOR [ [PITH_FULL_IMAGE:figures/full_fig_p010_7.png] view at source ↗
Figure 8
Figure 8. Figure 8: FIG. 8. Evaluated [PITH_FULL_IMAGE:figures/full_fig_p010_8.png] view at source ↗
Figure 9
Figure 9. Figure 9: FIG. 9. n+ [PITH_FULL_IMAGE:figures/full_fig_p011_9.png] view at source ↗
Figure 10
Figure 10. Figure 10: FIG. 10. MISTRAL benchmark reactivity temperature coef [PITH_FULL_IMAGE:figures/full_fig_p012_10.png] view at source ↗
Figure 11
Figure 11. Figure 11: FIG. 11 [PITH_FULL_IMAGE:figures/full_fig_p012_11.png] view at source ↗
Figure 13
Figure 13. Figure 13: FIG. 13. n+ [PITH_FULL_IMAGE:figures/full_fig_p013_13.png] view at source ↗
Figure 14
Figure 14. Figure 14: FIG. 14. The total cross section in the fast energy range for [PITH_FULL_IMAGE:figures/full_fig_p014_14.png] view at source ↗
Figure 15
Figure 15. Figure 15: FIG. 15. Evaluated [PITH_FULL_IMAGE:figures/full_fig_p014_15.png] view at source ↗
Figure 16
Figure 16. Figure 16: FIG. 16 [PITH_FULL_IMAGE:figures/full_fig_p014_16.png] view at source ↗
Figure 17
Figure 17. Figure 17: FIG. 17. Newly evaluated [PITH_FULL_IMAGE:figures/full_fig_p015_17.png] view at source ↗
Figure 18
Figure 18. Figure 18: FIG. 18. The ENDF/B-VIII.1 evaluated [PITH_FULL_IMAGE:figures/full_fig_p015_18.png] view at source ↗
Figure 21
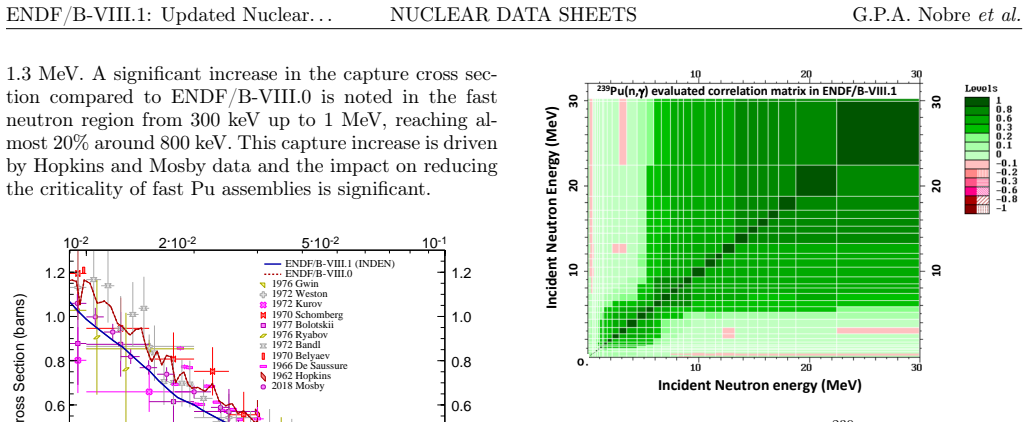
Figure 21. Figure 21: FIG. 21. ENDF/B-VIII.1 evaluated [PITH_FULL_IMAGE:figures/full_fig_p017_21.png] view at source ↗
Figure 22
Figure 22. Figure 22: FIG. 22. ENDF/B-VIII.1 evaluated [PITH_FULL_IMAGE:figures/full_fig_p017_22.png] view at source ↗
Figure 23
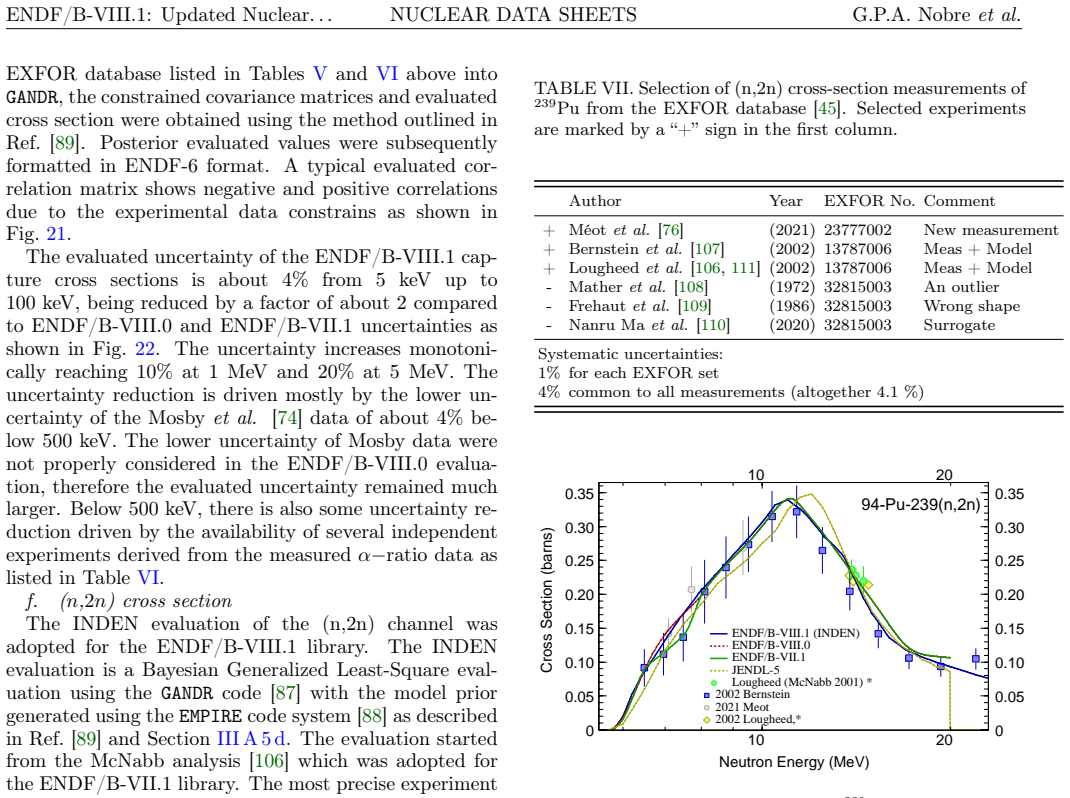
Figure 23. Figure 23: Note that both the original Lougheed data [111] (yellow rhombi) and the revised data by McNabb [106] (green circles) are plotted. The highest energy point of McNabb revised data was considered an outlier and its uncertainty was doubled. Below 9 MeV, there is an ex￾cellent agreement between the ENDF/B-VIII.0 and new ENDF/B-VIII.1 evaluation which will lead to almost the same calculated 239Pu(n,2n) reaction… view at source ↗
Figure 25
Figure 25. Figure 25: FIG. 25. ENDF/B-VIII.1 evaluated [PITH_FULL_IMAGE:figures/full_fig_p019_25.png] view at source ↗
Figure 24
Figure 24. Figure 24: FIG. 24. ENDF/B-VIII.1 evaluated [PITH_FULL_IMAGE:figures/full_fig_p019_24.png] view at source ↗
Figure 26
Figure 26. Figure 26: FIG. 26. The inelastic cross section in the fast energy range for [PITH_FULL_IMAGE:figures/full_fig_p019_26.png] view at source ↗
Figure 27
Figure 27. Figure 27: FIG. 27. The elastic cross section in the fast energy range for [PITH_FULL_IMAGE:figures/full_fig_p020_27.png] view at source ↗
Figure 28
Figure 28. Figure 28: FIG. 28. The angular distribution of [PITH_FULL_IMAGE:figures/full_fig_p020_28.png] view at source ↗
Figure 30
Figure 30. Figure 30: FIG. 30. Low lying nuclear levels of [PITH_FULL_IMAGE:figures/full_fig_p022_30.png] view at source ↗
Figure 31
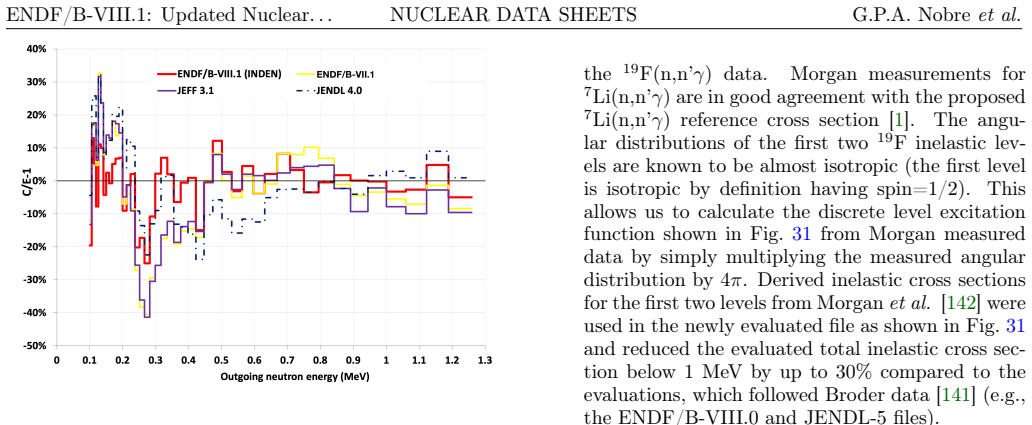
Figure 31. Figure 31: FIG. 31. Neutron induced inelastic scattering cross sections of [PITH_FULL_IMAGE:figures/full_fig_p022_31.png] view at source ↗
Figure 32
Figure 32. Figure 32: FIG. 32. LR0 reactor spectrum neutron leakage of FLINA [PITH_FULL_IMAGE:figures/full_fig_p023_32.png] view at source ↗
Figure 33
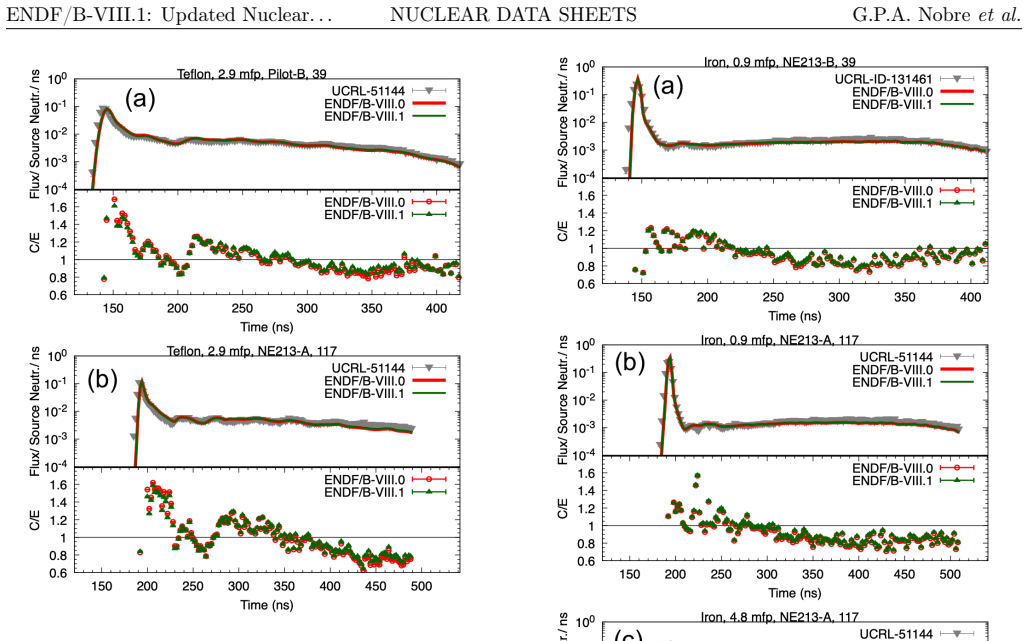
Figure 33. Figure 33: FIG. 33. Results from the Teflon [PITH_FULL_IMAGE:figures/full_fig_p024_33.png] view at source ↗
Figure 34
Figure 34. Figure 34: FIG. 34 [PITH_FULL_IMAGE:figures/full_fig_p025_34.png] view at source ↗
Figure 35
Figure 35. Figure 35: FIG. 35 [PITH_FULL_IMAGE:figures/full_fig_p025_35.png] view at source ↗
Figure 36
Figure 36. Figure 36: FIG. 36 [PITH_FULL_IMAGE:figures/full_fig_p026_36.png] view at source ↗
Figure 37
Figure 37. Figure 37: FIG. 37. Results for the HEU-MET-MIXED THERM [PITH_FULL_IMAGE:figures/full_fig_p026_37.png] view at source ↗
Figure 38
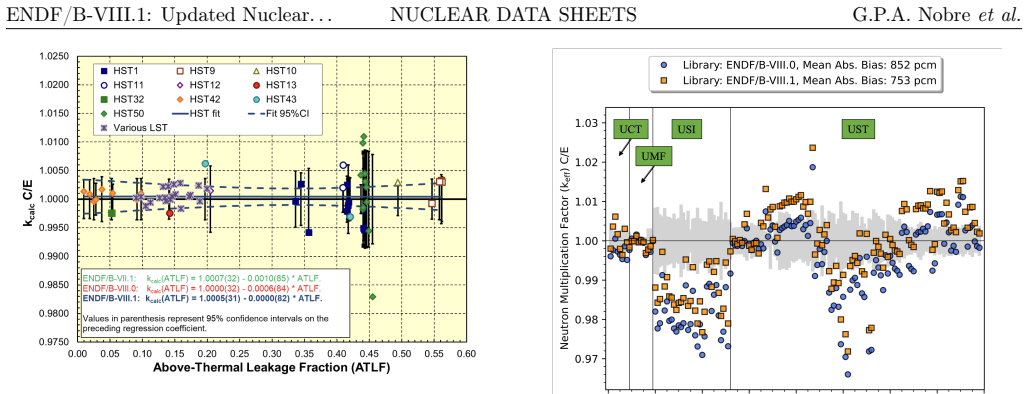
Figure 38. Figure 38: FIG. 38. Criticality differences to the experimental benchmark values C/E of selected stainless steel ICSBEP benchmarks. [PITH_FULL_IMAGE:figures/full_fig_p029_38.png] view at source ↗
Figure 40
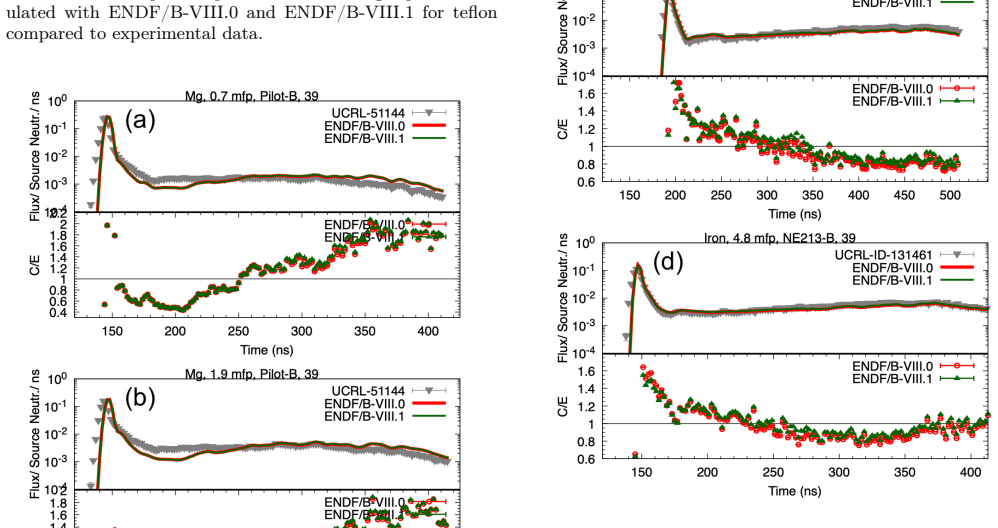
Figure 40. Figure 40: FIG. 40. Measured neutron leakage of the [PITH_FULL_IMAGE:figures/full_fig_p029_40.png] view at source ↗
Figure 41
Figure 41. Figure 41: FIG. 41 [PITH_FULL_IMAGE:figures/full_fig_p030_41.png] view at source ↗
Figure 42
Figure 42. Figure 42: FIG. 42. Quasi differential copper scattering data measured with 35 deg and 150 deg detectors by Blain [PITH_FULL_IMAGE:figures/full_fig_p031_42.png] view at source ↗
Figure 44
Figure 44. Figure 44: FIG. 44. n+ [PITH_FULL_IMAGE:figures/full_fig_p032_44.png] view at source ↗
Figure 45
Figure 45. Figure 45: FIG. 45. n+ [PITH_FULL_IMAGE:figures/full_fig_p032_45.png] view at source ↗
Figure 47
Figure 47. Figure 47: A perfectly flat trend was achieved for the ENDF/B-VIII.1 copper evaluation covering from very well-thermalized assemblies (HCT006/3 with FEPIT≈ 0) to epithermal assemblies with FEPIT≈ 40% (HCT005), clearly an improved performance for lattices and thermal benchmarks. All previous evaluations systematically underesti￾mated the criticality of epithermal assemblies, being ENDF/B-VIII.0 slightly better (showi… view at source ↗
Figure 48
Figure 48. Figure 48: FIG. 48. The plot of [PITH_FULL_IMAGE:figures/full_fig_p033_48.png] view at source ↗
Figure 50
Figure 50. Figure 50: FIG. 50. Measured neutron leakage of the [PITH_FULL_IMAGE:figures/full_fig_p034_50.png] view at source ↗
Figure 51
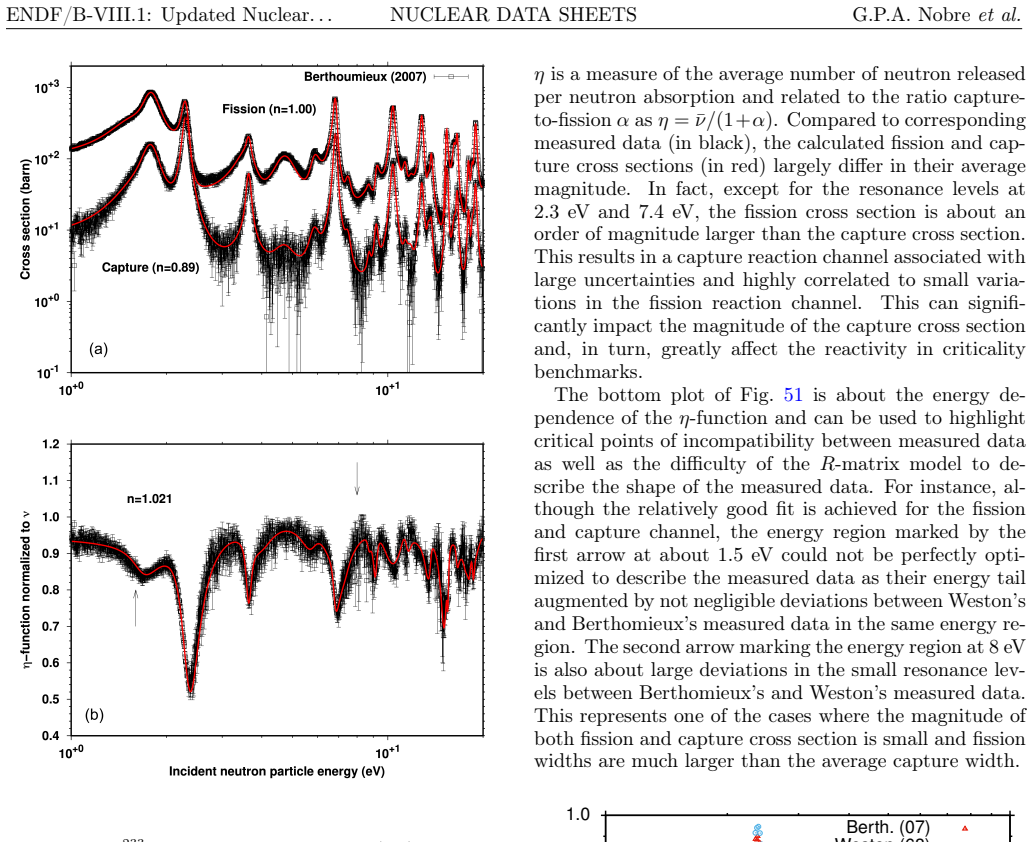
Figure 51. Figure 51: FIG. 51. n+ [PITH_FULL_IMAGE:figures/full_fig_p036_51.png] view at source ↗
Figure 52
Figure 52. Figure 52: FIG. 52. n+ [PITH_FULL_IMAGE:figures/full_fig_p036_52.png] view at source ↗
Figure 54
Figure 54. Figure 54: FIG. 54. Selected experimental data [ [PITH_FULL_IMAGE:figures/full_fig_p037_54.png] view at source ↗
Figure 55
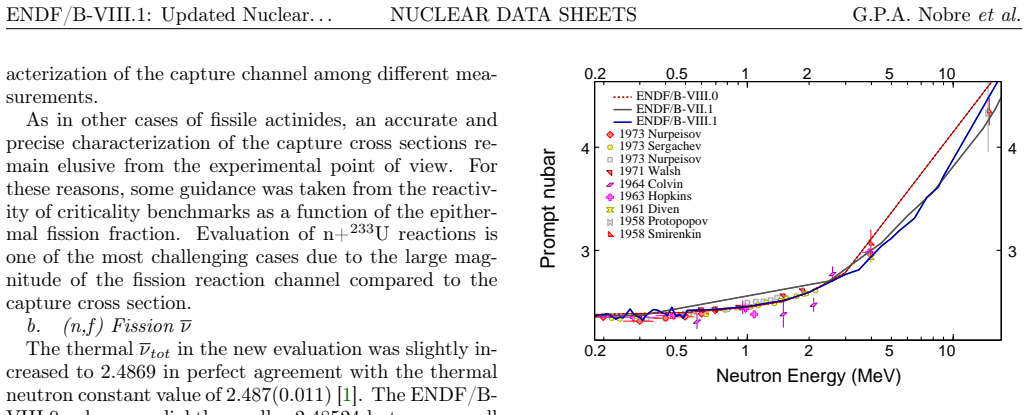
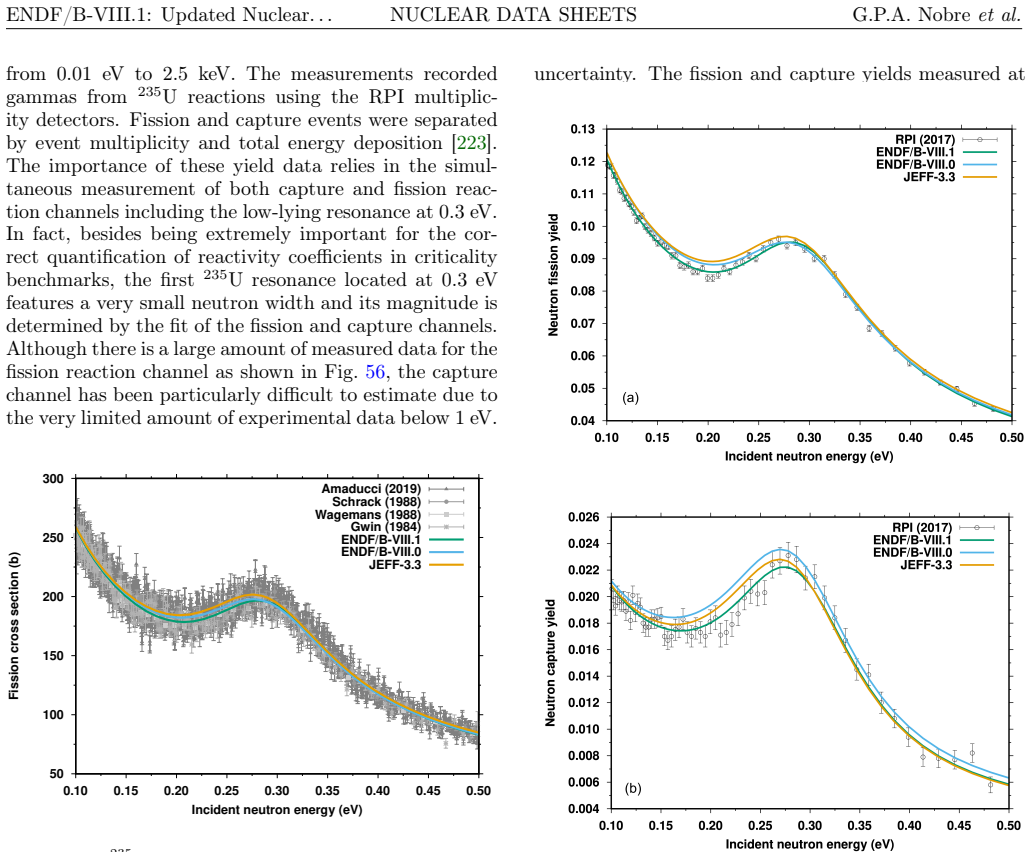
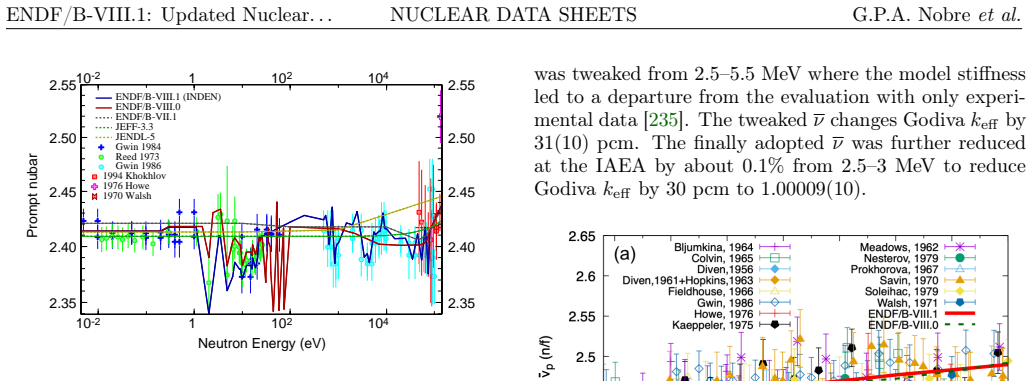
Figure 55. Figure 55: are distinctly larger up to 100 keV due to the in￾creased ν( 252Cf(sf)) standard uncertainties (0.42%). The use of Gwin nubar data [40] from 500 eV up to 100 keV led to a significant increase of the nubar uncertainty to values up to 1.4% in the new evaluation (from about 0.5% in ENDF/B-VIII.0 to roughly the uncertainty of Gwin’s experiment) as shown in [PITH_FULL_IMAGE:figures/full_fig_p037_55.png] view at source ↗
Figure 56
Figure 56. Figure 56: FIG. 56. n+ [PITH_FULL_IMAGE:figures/full_fig_p038_56.png] view at source ↗
Figure 59
Figure 59. Figure 59: FIG. 59. Evaluated [PITH_FULL_IMAGE:figures/full_fig_p040_59.png] view at source ↗
Figure 58
Figure 58. Figure 58: FIG. 58. Experimental data [ [PITH_FULL_IMAGE:figures/full_fig_p040_58.png] view at source ↗
Figure 61
Figure 61. Figure 61: FIG. 61. Reed [ [PITH_FULL_IMAGE:figures/full_fig_p041_61.png] view at source ↗
Figure 62
Figure 62. Figure 62: FIG. 62. Evaluated [PITH_FULL_IMAGE:figures/full_fig_p041_62.png] view at source ↗
Figure 63
Figure 63. Figure 63: FIG. 63. Experimental and evaluated [PITH_FULL_IMAGE:figures/full_fig_p041_63.png] view at source ↗
Figure 64
Figure 64. Figure 64: FIG. 64. Group averaged capture cross sections of the [PITH_FULL_IMAGE:figures/full_fig_p042_64.png] view at source ↗
Figure 65
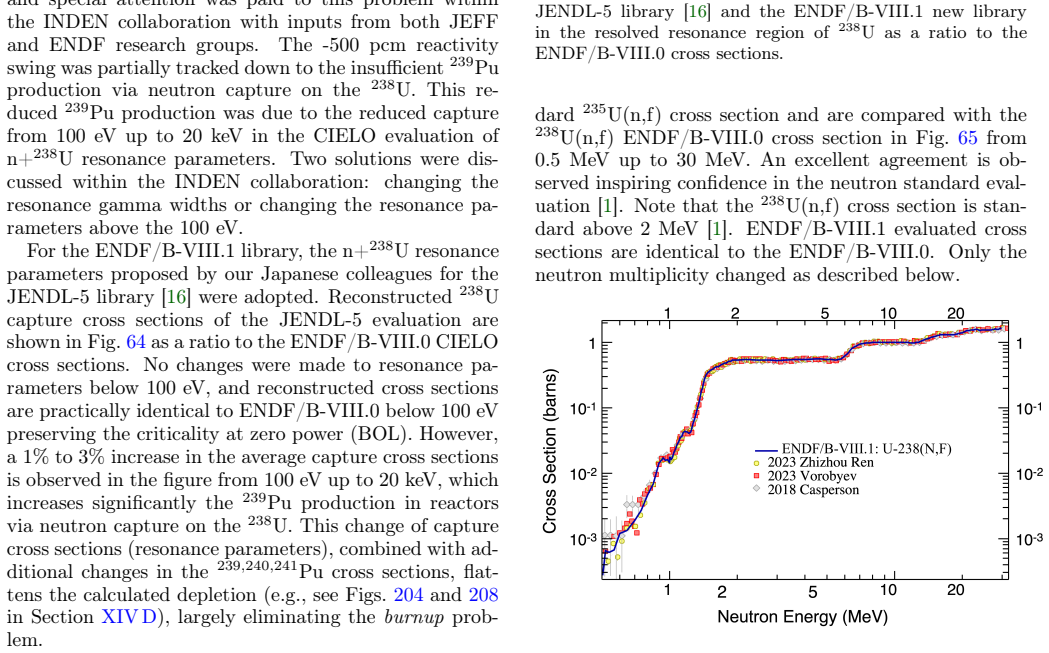
Figure 65. Figure 65: FIG. 65. New experimental data since 2018 [ [PITH_FULL_IMAGE:figures/full_fig_p042_65.png] view at source ↗
Figure 67
Figure 67. Figure 67: FIG. 67. Selected experimental data and evaluated [PITH_FULL_IMAGE:figures/full_fig_p043_67.png] view at source ↗
Figure 66
Figure 66. Figure 66: FIG. 66. Selected experimental data are compared to [PITH_FULL_IMAGE:figures/full_fig_p043_66.png] view at source ↗
Figure 69
Figure 69. Figure 69: FIG. 69. Comparison of the CONRAD results with experi [PITH_FULL_IMAGE:figures/full_fig_p044_69.png] view at source ↗
Figure 68
Figure 68. Figure 68: FIG. 68. CONRAD analysis of three [PITH_FULL_IMAGE:figures/full_fig_p044_68.png] view at source ↗
Figure 72
Figure 72. Figure 72: FIG. 72. Measurements of the [PITH_FULL_IMAGE:figures/full_fig_p046_72.png] view at source ↗
Figure 73
Figure 73. Figure 73: FIG. 73. Measurements of the [PITH_FULL_IMAGE:figures/full_fig_p046_73.png] view at source ↗
Figure 74
Figure 74. Figure 74: FIG. 74. Measurements of the [PITH_FULL_IMAGE:figures/full_fig_p047_74.png] view at source ↗
Figure 77
Figure 77. Figure 77: FIG. 77. GELINA transmission and capture yield data from [PITH_FULL_IMAGE:figures/full_fig_p048_77.png] view at source ↗
Figure 78
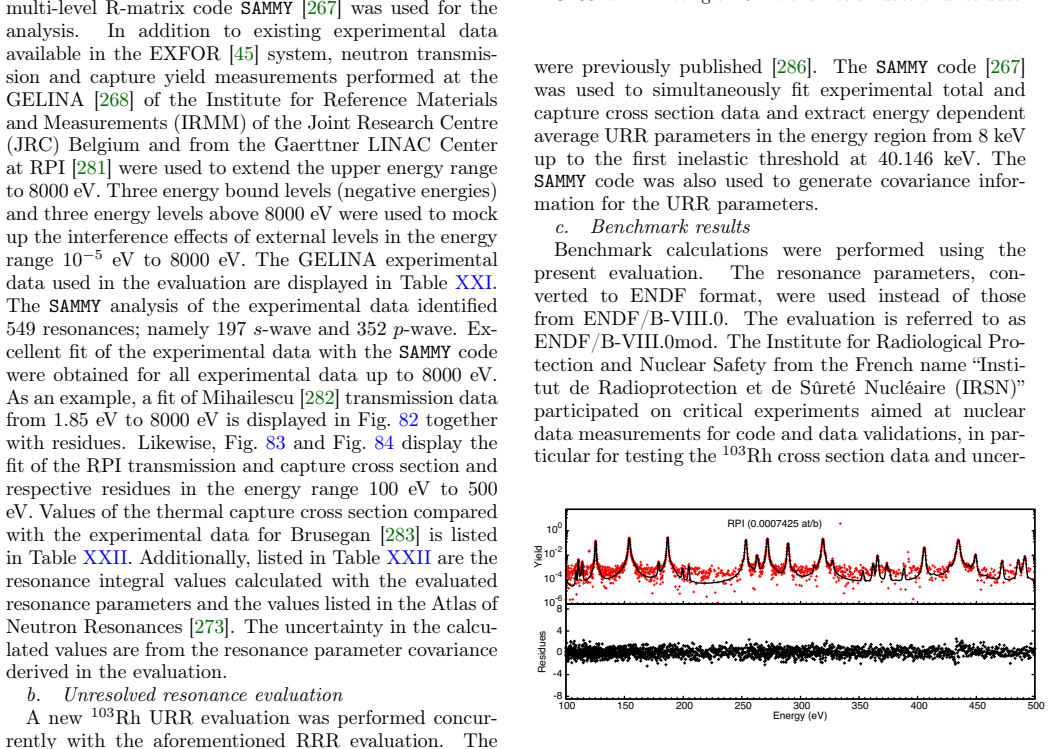
Figure 78. Figure 78: Moreover, the RM formalism used for the newly assembled ENDF file represents an improvement over the multi-level Breit-Wigner approximation. Selected experimental data measured at the ORELA facility [276, 277] were chosen to test the quality of the resonance parameters as plotted in Figs. 79–81 showing the overall good agreement between calculated and ex￾perimental (cross section and transmission) data. T… view at source ↗
Figure 79
Figure 79. Figure 79: FIG. 79. n+ [PITH_FULL_IMAGE:figures/full_fig_p050_79.png] view at source ↗
Figure 80
Figure 80. Figure 80: FIG. 80. n+ [PITH_FULL_IMAGE:figures/full_fig_p050_80.png] view at source ↗
Figure 82
Figure 82. Figure 82: FIG. 82 [PITH_FULL_IMAGE:figures/full_fig_p051_82.png] view at source ↗
Figure 83
Figure 83. Figure 83: FIG. 83 [PITH_FULL_IMAGE:figures/full_fig_p051_83.png] view at source ↗
Figure 84
Figure 84. Figure 84: FIG. 84 [PITH_FULL_IMAGE:figures/full_fig_p051_84.png] view at source ↗
Figure 85
Figure 85. Figure 85: FIG. 85. 80-group representation of [PITH_FULL_IMAGE:figures/full_fig_p053_85.png] view at source ↗
Figure 86
Figure 86. Figure 86: FIG. 86. Evaluated total cross sections compared with the [PITH_FULL_IMAGE:figures/full_fig_p055_86.png] view at source ↗
Figure 87
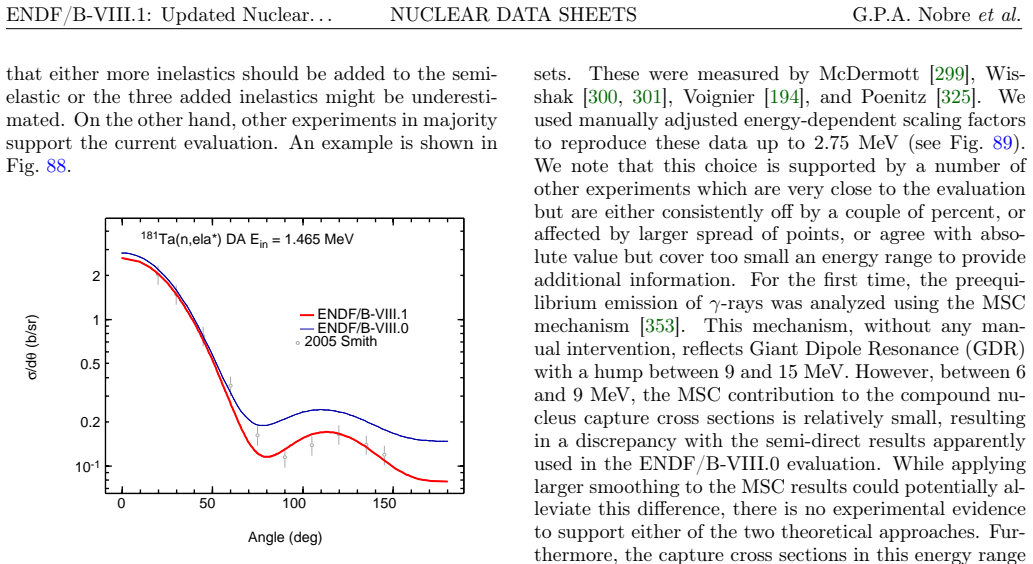
Figure 87. Figure 87: FIG. 87. An example of semi-elastic angular distribution. [PITH_FULL_IMAGE:figures/full_fig_p056_87.png] view at source ↗
Figure 89
Figure 89. Figure 89: FIG. 89. Selected set of experimental data compared with the [PITH_FULL_IMAGE:figures/full_fig_p056_89.png] view at source ↗
Figure 90
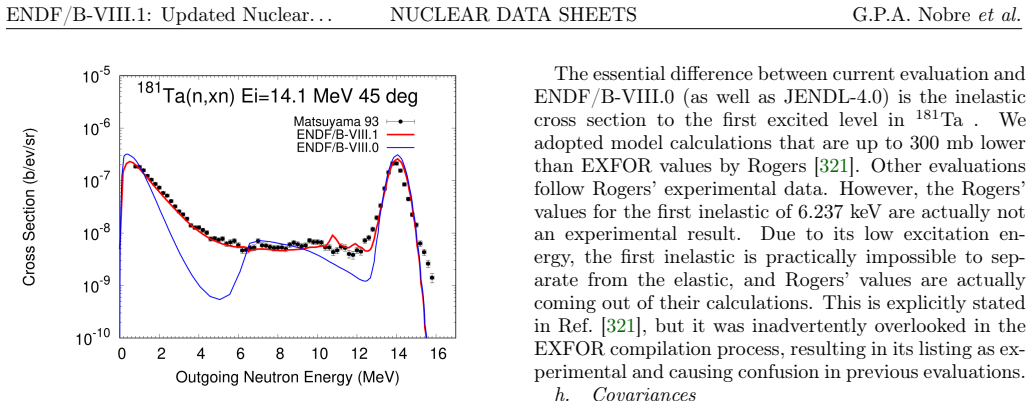
Figure 90. Figure 90: FIG. 90. Double-differential neutron emission spectrum com [PITH_FULL_IMAGE:figures/full_fig_p057_90.png] view at source ↗
Figure 91
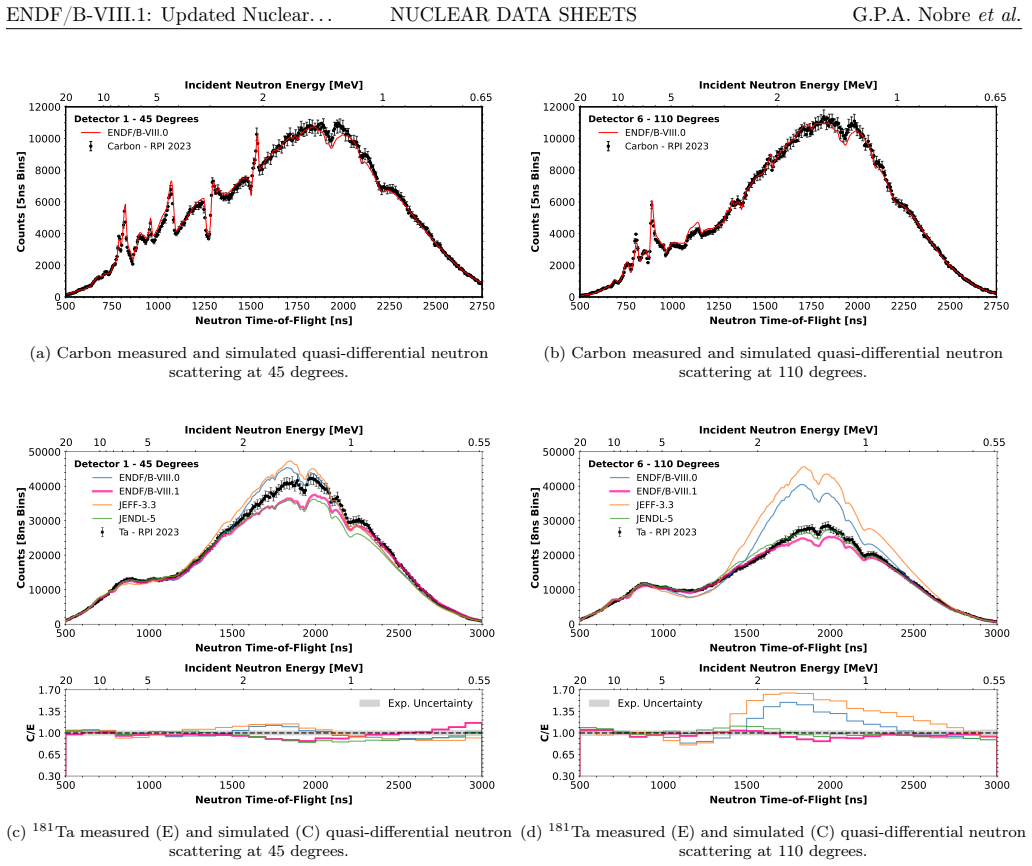
Figure 91. Figure 91: FIG. 91. Results from the tantalum quasi-differential neutron scattering experiment at RPI [ [PITH_FULL_IMAGE:figures/full_fig_p058_91.png] view at source ↗
Figure 92
Figure 92. Figure 92: FIG. 92. Evaluated cross sections for total, elastic, cap [PITH_FULL_IMAGE:figures/full_fig_p060_92.png] view at source ↗
Figure 93
Figure 93. Figure 93: FIG. 93. New capture cross section of [PITH_FULL_IMAGE:figures/full_fig_p061_93.png] view at source ↗
Figure 94
Figure 94. Figure 94: FIG. 94. New [PITH_FULL_IMAGE:figures/full_fig_p061_94.png] view at source ↗
Figure 95
Figure 95. Figure 95: FIG. 95. Comparison of simulation and experiment of high [PITH_FULL_IMAGE:figures/full_fig_p062_95.png] view at source ↗
Figure 96
Figure 96. Figure 96: FIG. 96. Cross section for the [PITH_FULL_IMAGE:figures/full_fig_p063_96.png] view at source ↗
Figure 97
Figure 97. Figure 97: FIG. 97. Cross section for the [PITH_FULL_IMAGE:figures/full_fig_p063_97.png] view at source ↗
Figure 98
Figure 98. Figure 98: FIG. 98. Cross section for the [PITH_FULL_IMAGE:figures/full_fig_p063_98.png] view at source ↗
Figure 100
Figure 100. Figure 100: FIG. 100. Cross section for the [PITH_FULL_IMAGE:figures/full_fig_p064_100.png] view at source ↗
Figure 101
Figure 101. Figure 101: FIG. 101. Comparison of the measured and experimental [PITH_FULL_IMAGE:figures/full_fig_p064_101.png] view at source ↗
Figure 102
Figure 102. Figure 102: FIG. 102. Comparison between the relative uncertainties [PITH_FULL_IMAGE:figures/full_fig_p065_102.png] view at source ↗
Figure 103
Figure 103. Figure 103: FIG. 103. (Color online) Selected IRDFF-II [ [PITH_FULL_IMAGE:figures/full_fig_p068_103.png] view at source ↗
Figure 104
Figure 104. Figure 104: FIG. 104. (Color online) Selected IRDFF-II [ [PITH_FULL_IMAGE:figures/full_fig_p069_104.png] view at source ↗
Figure 105
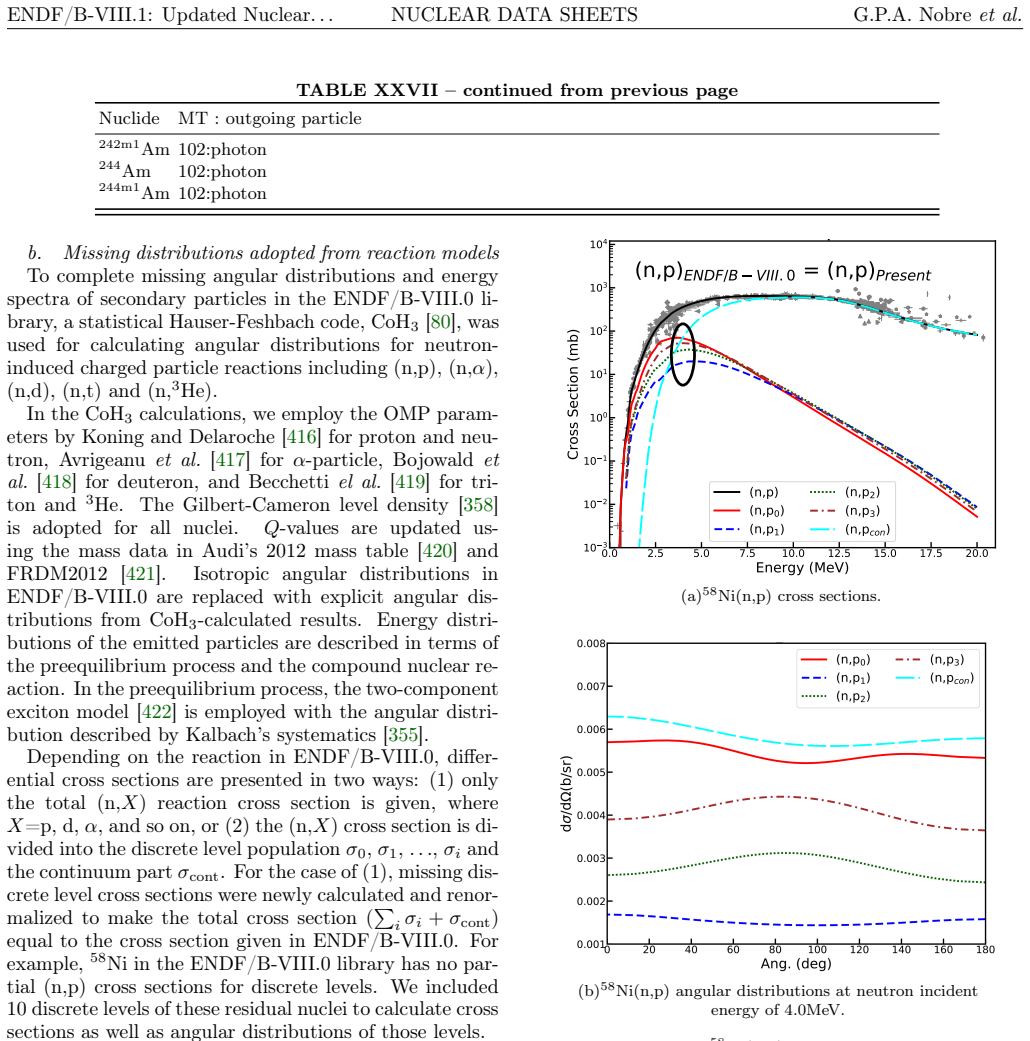
Figure 105. Figure 105: (a) shows that the total (n,p) cross section is exactly the same as that given in ENDF/B-VIII.0, along with four newly decomposed cross sections of the discrete levels and the continuum part. The additional angular distributions for these levels in the laboratory system are calculated and shown [PITH_FULL_IMAGE:figures/full_fig_p074_105.png] view at source ↗
Figure 106
Figure 106. Figure 106: FIG. 106. Angular distributions at neutron incident energy of [PITH_FULL_IMAGE:figures/full_fig_p075_106.png] view at source ↗
Figure 107
Figure 107. Figure 107: FIG. 107. Comparison of the n+ [PITH_FULL_IMAGE:figures/full_fig_p078_107.png] view at source ↗
Figure 108
Figure 108. Figure 108: FIG. 108. Comparison of the n+ [PITH_FULL_IMAGE:figures/full_fig_p078_108.png] view at source ↗
Figure 110
Figure 110. Figure 110: FIG. 110 [PITH_FULL_IMAGE:figures/full_fig_p080_110.png] view at source ↗
Figure 111
Figure 111. Figure 111: FIG. 111 [PITH_FULL_IMAGE:figures/full_fig_p081_111.png] view at source ↗
Figure 112
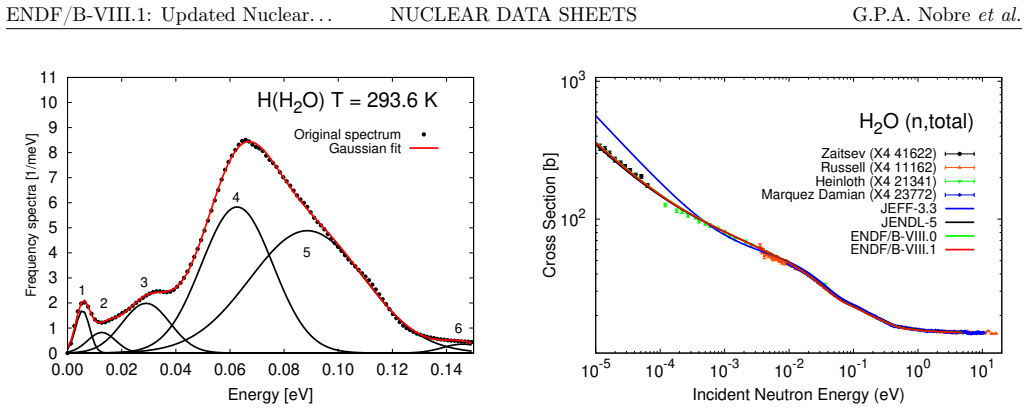
Figure 112. Figure 112: FIG. 112. (Color online) Frequency spectrum of hydrogen in [PITH_FULL_IMAGE:figures/full_fig_p085_112.png] view at source ↗
Figure 114
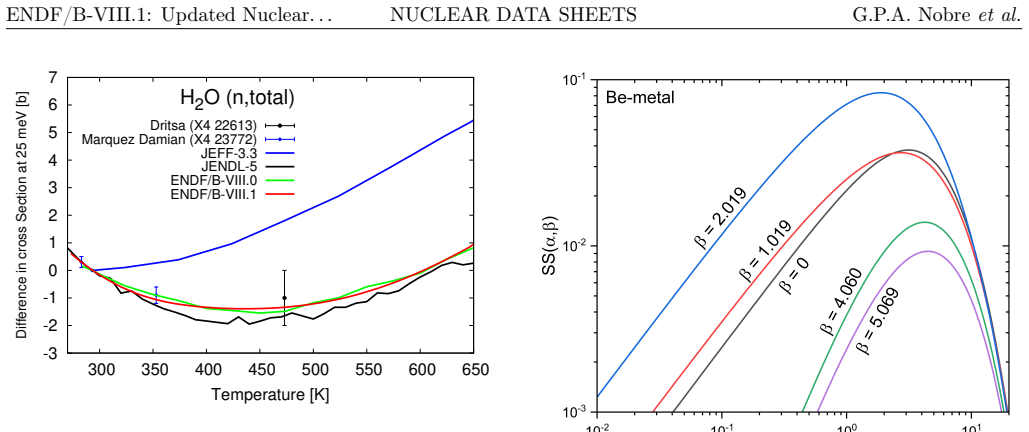
Figure 114. Figure 114: FIG. 114. (Color online) Difference in total cross section for [PITH_FULL_IMAGE:figures/full_fig_p086_114.png] view at source ↗
Figure 116
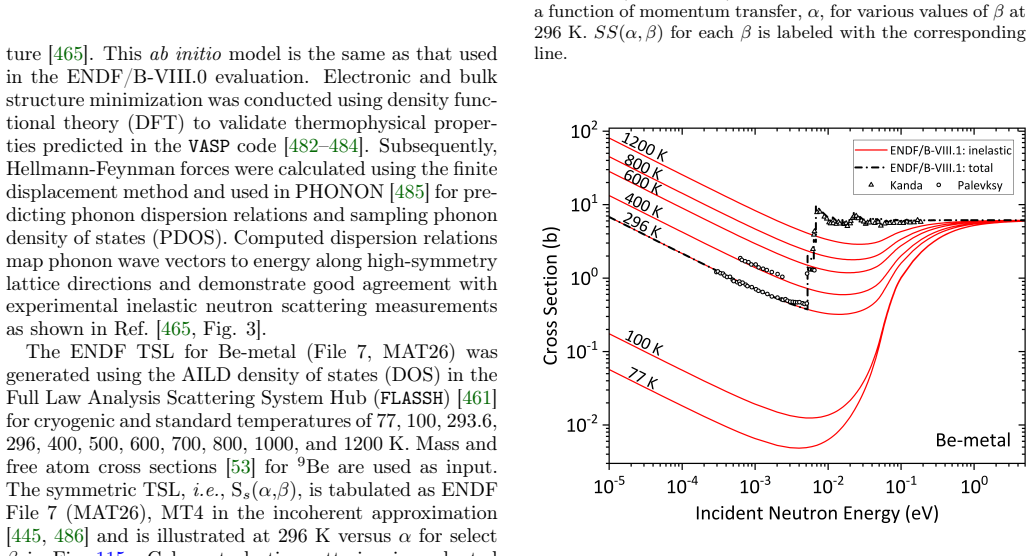
Figure 116. Figure 116: FIG. 116. (Color online) The inelastic scattering cross sec [PITH_FULL_IMAGE:figures/full_fig_p086_116.png] view at source ↗
Figure 117
Figure 117. Figure 117: FIG. 117. (Color online)The symmetric TSL for beryllium [PITH_FULL_IMAGE:figures/full_fig_p087_117.png] view at source ↗
Figure 118
Figure 118. Figure 118: FIG. 118. (Color online) Total cross sections of beryllium [PITH_FULL_IMAGE:figures/full_fig_p088_118.png] view at source ↗
Figure 120
Figure 120. Figure 120: FIG. 120. (Color online) The symmetric TSL of (a) Be(BeO) [PITH_FULL_IMAGE:figures/full_fig_p088_120.png] view at source ↗
Figure 121
Figure 121. Figure 121: FIG. 121. (Color online) The total scattering cross section of [PITH_FULL_IMAGE:figures/full_fig_p089_121.png] view at source ↗
Figure 122
Figure 122. Figure 122: FIG. 122. (Color online) The symmetric TSL of (a) [PITH_FULL_IMAGE:figures/full_fig_p089_122.png] view at source ↗
Figure 123
Figure 123. Figure 123: FIG. 123. (Color online) The total scattering cross section of [PITH_FULL_IMAGE:figures/full_fig_p090_123.png] view at source ↗
Figure 124
Figure 124. Figure 124: FIG. 124. (Color online) The ENDF/B-VIII.1 total cross sec [PITH_FULL_IMAGE:figures/full_fig_p090_124.png] view at source ↗
Figure 126
Figure 126. Figure 126: FIG. 126. Total thermal neutron scattering cross section of [PITH_FULL_IMAGE:figures/full_fig_p091_126.png] view at source ↗
Figure 127
Figure 127. Figure 127: FIG. 127. (Color online) The DOS used for reactor graphite [PITH_FULL_IMAGE:figures/full_fig_p091_127.png] view at source ↗
Figure 125
Figure 125. Figure 125: FIG. 125. (Color online) The symmetric TSL of (a) F(FLiBe), [PITH_FULL_IMAGE:figures/full_fig_p091_125.png] view at source ↗
Figure 128
Figure 128. Figure 128: FIG. 128. (Color online) The symmetric TSL of reactor [PITH_FULL_IMAGE:figures/full_fig_p092_128.png] view at source ↗
Figure 129
Figure 129. Figure 129: FIG. 129. (Color online) The inelastic scattering cross section [PITH_FULL_IMAGE:figures/full_fig_p092_129.png] view at source ↗
Figure 130
Figure 130. Figure 130: FIG. 130. (Color online) The symmetric TSL for graphite [PITH_FULL_IMAGE:figures/full_fig_p093_130.png] view at source ↗
Figure 131
Figure 131. Figure 131: FIG. 131. (Color online) Total thermal neutron scattering [PITH_FULL_IMAGE:figures/full_fig_p093_131.png] view at source ↗
Figure 133
Figure 133. Figure 133: FIG. 133. Total thermal neutron scattering cross section of [PITH_FULL_IMAGE:figures/full_fig_p094_133.png] view at source ↗
Figure 132
Figure 132. Figure 132: FIG. 132. (Color online) The symmetric TSL for (a) H(HF) [PITH_FULL_IMAGE:figures/full_fig_p094_132.png] view at source ↗
Figure 135
Figure 135. Figure 135: FIG. 135. Total thermal neutron scattering cross section of H [PITH_FULL_IMAGE:figures/full_fig_p095_135.png] view at source ↗
Figure 136
Figure 136. Figure 136: FIG. 136. (Color online) The symmetric TSL of (a) Si(3C [PITH_FULL_IMAGE:figures/full_fig_p095_136.png] view at source ↗
Figure 137
Figure 137. Figure 137: FIG. 137. (Color online) The inelastic scattering cross section [PITH_FULL_IMAGE:figures/full_fig_p096_137.png] view at source ↗
Figure 139
Figure 139. Figure 139: FIG. 139. (Color online) The symmetric TSL of (a) Si(SiO [PITH_FULL_IMAGE:figures/full_fig_p096_139.png] view at source ↗
Figure 140
Figure 140. Figure 140: FIG. 140. (Color online) The inelastic scattering cross section [PITH_FULL_IMAGE:figures/full_fig_p097_140.png] view at source ↗
Figure 142
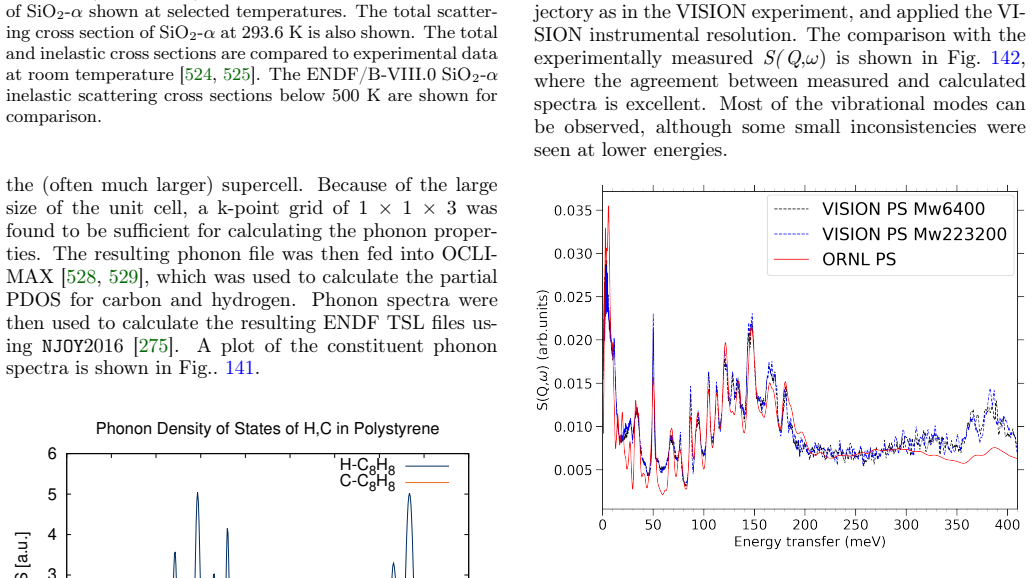
Figure 142. Figure 142: FIG. 142. Comparison of calculated S(Q, [PITH_FULL_IMAGE:figures/full_fig_p097_142.png] view at source ↗
Figure 141
Figure 141. Figure 141: FIG. 141. Phonon density of states for H & C in polystyrene. [PITH_FULL_IMAGE:figures/full_fig_p097_141.png] view at source ↗
Figure 144
Figure 144. Figure 144: FIG. 144. Phonon density of states for H, C, & O in [PITH_FULL_IMAGE:figures/full_fig_p098_144.png] view at source ↗
Figure 143
Figure 143. Figure 143: FIG. 143. Comparison of calculated total cross section versus [PITH_FULL_IMAGE:figures/full_fig_p098_143.png] view at source ↗
Figure 145
Figure 145. Figure 145: FIG. 145. Comparison of calculated S(Q, [PITH_FULL_IMAGE:figures/full_fig_p099_145.png] view at source ↗
Figure 146
Figure 146. Figure 146: FIG. 146. Comparison of calculated total cross sections versus [PITH_FULL_IMAGE:figures/full_fig_p099_146.png] view at source ↗
Figure 148
Figure 148. Figure 148: FIG. 148. Comparison of calculated k [PITH_FULL_IMAGE:figures/full_fig_p099_148.png] view at source ↗
Figure 150
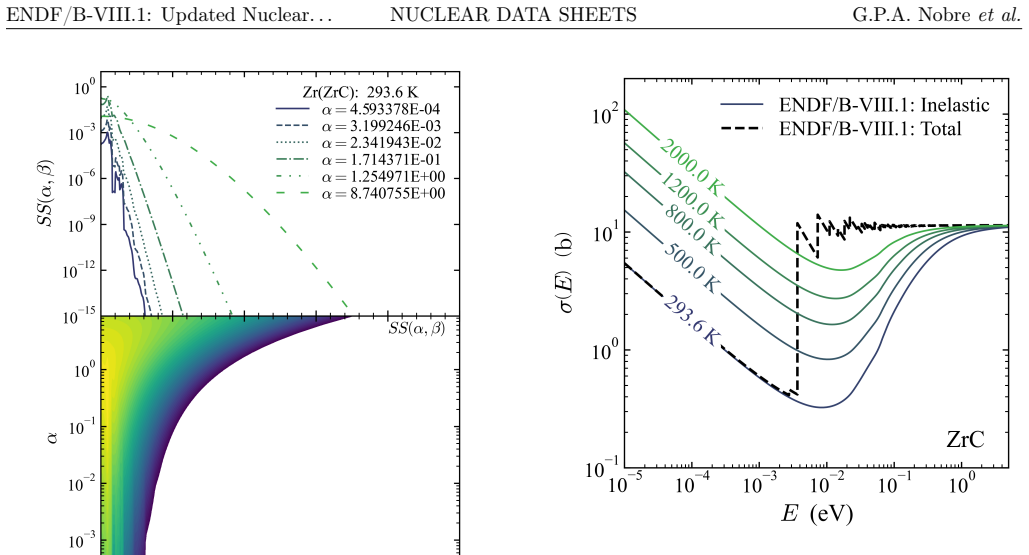
Figure 150. Figure 150: FIG. 150. (Color online) Total scattering cross section of ZrC [PITH_FULL_IMAGE:figures/full_fig_p101_150.png] view at source ↗
Figure 149
Figure 149. Figure 149: FIG. 149. (Color online) Zr(ZrC) and C(ZrC) symmetric TSL, [PITH_FULL_IMAGE:figures/full_fig_p101_149.png] view at source ↗
Figure 152
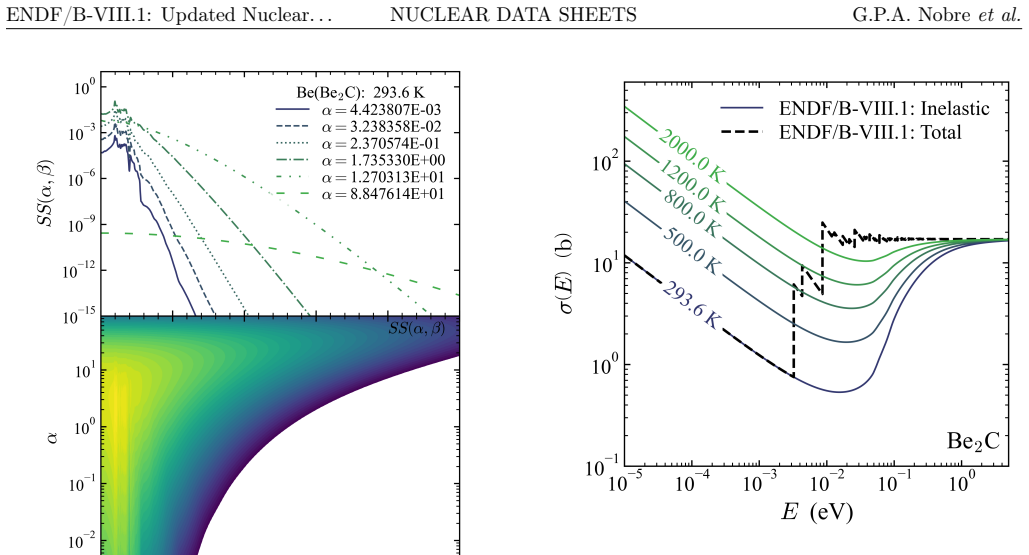
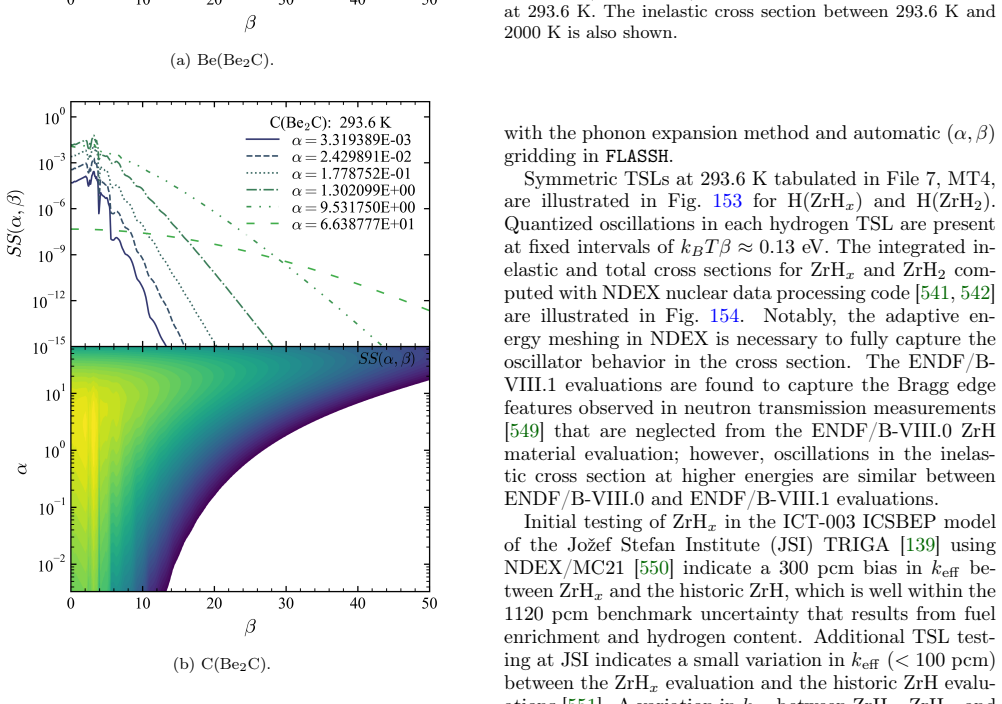
Figure 152. Figure 152: FIG. 152. (Color online) Total scattering cross section of Be [PITH_FULL_IMAGE:figures/full_fig_p102_152.png] view at source ↗
Figure 151
Figure 151. Figure 151: FIG. 151. (Color online) Be(Be [PITH_FULL_IMAGE:figures/full_fig_p102_151.png] view at source ↗
Figure 154
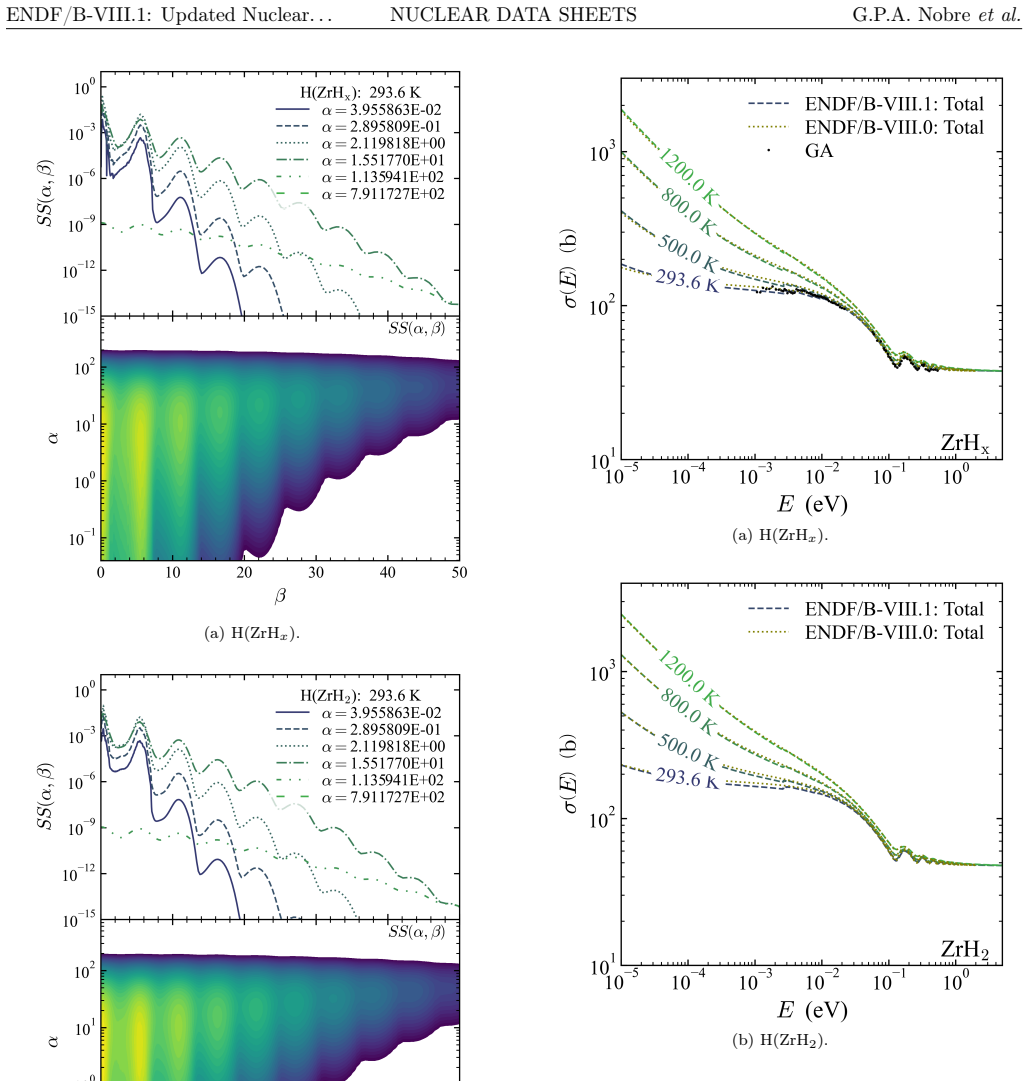
Figure 154. Figure 154: FIG. 154. (Color online) Total scattering cross section of [PITH_FULL_IMAGE:figures/full_fig_p103_154.png] view at source ↗
Figure 153
Figure 153. Figure 153: FIG. 153. (Color online) H(ZrH [PITH_FULL_IMAGE:figures/full_fig_p103_153.png] view at source ↗
Figure 155
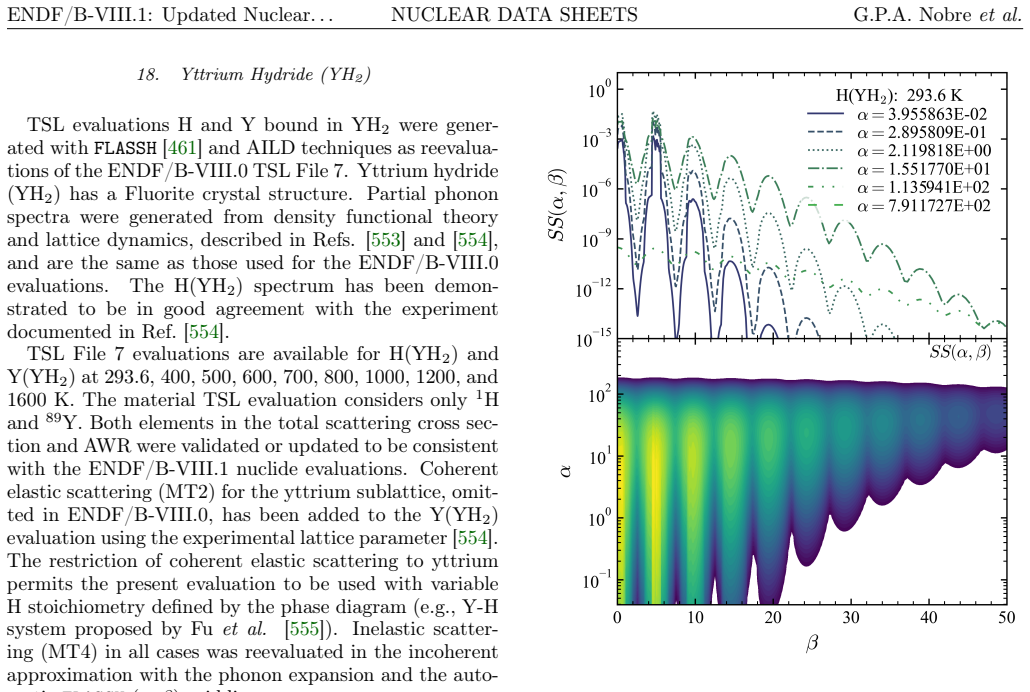
Figure 155. Figure 155: FIG. 155. (Color online) H(YH [PITH_FULL_IMAGE:figures/full_fig_p104_155.png] view at source ↗
Figure 156
Figure 156. Figure 156: FIG. 156. (Color online) Total scattering cross section of [PITH_FULL_IMAGE:figures/full_fig_p105_156.png] view at source ↗
Figure 157
Figure 157. Figure 157: FIG. 157. (Color online) H( [PITH_FULL_IMAGE:figures/full_fig_p105_157.png] view at source ↗
Figure 159
Figure 159. Figure 159: FIG. 159. (Color online) The symmetric TSL of (a) [PITH_FULL_IMAGE:figures/full_fig_p106_159.png] view at source ↗
Figure 158
Figure 158. Figure 158: FIG. 158. (Color online) Total scattering cross section of [PITH_FULL_IMAGE:figures/full_fig_p106_158.png] view at source ↗
Figure 160
Figure 160. Figure 160: FIG. 160. (Color online) The inelastic scattering cross section [PITH_FULL_IMAGE:figures/full_fig_p107_160.png] view at source ↗
Figure 161
Figure 161. Figure 161: FIG. 161. (Color online) The symmetric TSL of natural abun [PITH_FULL_IMAGE:figures/full_fig_p107_161.png] view at source ↗
Figure 163
Figure 163. Figure 163: FIG. 163. (Color online) The symmetric TSL for natural ura [PITH_FULL_IMAGE:figures/full_fig_p108_163.png] view at source ↗
Figure 164
Figure 164. Figure 164: FIG. 164. (Color online) The inelastic scattering cross section [PITH_FULL_IMAGE:figures/full_fig_p108_164.png] view at source ↗
Figure 165
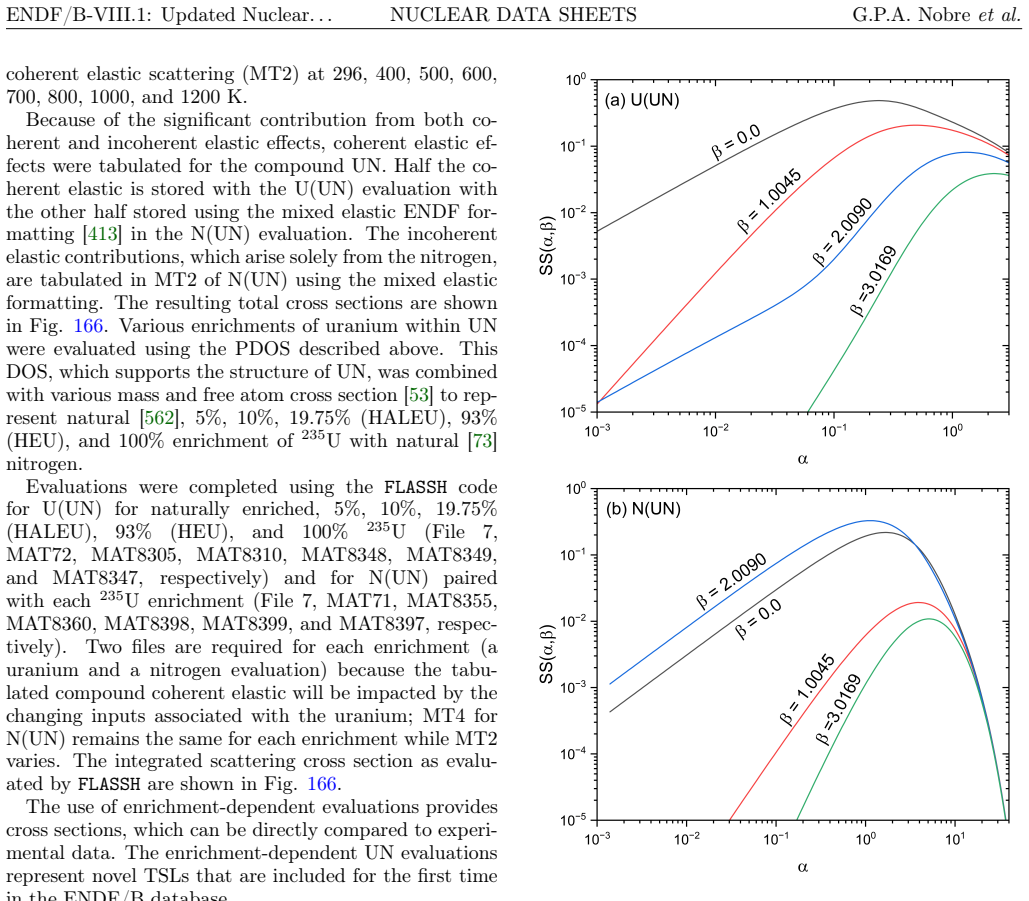
Figure 165. Figure 165: FIG. 165. (Color online) The symmetric TSL for (a) U(UN)- [PITH_FULL_IMAGE:figures/full_fig_p109_165.png] view at source ↗
Figure 166
Figure 166. Figure 166: FIG. 166. (Color online) The inelastic scattering cross section [PITH_FULL_IMAGE:figures/full_fig_p110_166.png] view at source ↗
Figure 167
Figure 167. Figure 167: FIG. 167. (Color online) The symmetric TSL for U(UO [PITH_FULL_IMAGE:figures/full_fig_p110_167.png] view at source ↗
Figure 168
Figure 168. Figure 168: FIG. 168. (Color online) The inelastic scattering cross section [PITH_FULL_IMAGE:figures/full_fig_p111_168.png] view at source ↗
Figure 169
Figure 169. Figure 169: FIG. 169. (Color online) H(UH [PITH_FULL_IMAGE:figures/full_fig_p111_169.png] view at source ↗
Figure 171
Figure 171. Figure 171: FIG. 171. (Color online) Simulated frequency spectrum for [PITH_FULL_IMAGE:figures/full_fig_p112_171.png] view at source ↗
Figure 174
Figure 174. Figure 174: FIG. 174. (Color online) Total scattering cross sections [PITH_FULL_IMAGE:figures/full_fig_p112_174.png] view at source ↗
Figure 175
Figure 175. Figure 175: FIG. 175. (Color online) Total scattering cross-sections for [PITH_FULL_IMAGE:figures/full_fig_p113_175.png] view at source ↗
Figure 176
Figure 176. Figure 176: FIG. 176. (Color online) The symmetric TSL for (a) [PITH_FULL_IMAGE:figures/full_fig_p113_176.png] view at source ↗
Figure 177
Figure 177. Figure 177: FIG. 177. (Color online) Total cross section for ENDF/B [PITH_FULL_IMAGE:figures/full_fig_p114_177.png] view at source ↗
Figure 178
Figure 178. Figure 178: FIG. 178. (Color online) Calculated scattering cross section [PITH_FULL_IMAGE:figures/full_fig_p114_178.png] view at source ↗
Figure 180
Figure 180. Figure 180: FIG. 180. (Color online) Calculated scattering cross sections [PITH_FULL_IMAGE:figures/full_fig_p115_180.png] view at source ↗
Figure 181
Figure 181. Figure 181: FIG. 181. Comparison of MC21 neutron emission energy spec [PITH_FULL_IMAGE:figures/full_fig_p119_181.png] view at source ↗
Figure 182
Figure 182. Figure 182: FIG. 182. Measurements of the [PITH_FULL_IMAGE:figures/full_fig_p121_182.png] view at source ↗
Figure 184
Figure 184. Figure 184: FIG. 184. Chain yields for thermal-neutron induced fission [PITH_FULL_IMAGE:figures/full_fig_p122_184.png] view at source ↗
Figure 185
Figure 185. Figure 185: FIG. 185. Cumulative yields and relative uncertainties of fis [PITH_FULL_IMAGE:figures/full_fig_p122_185.png] view at source ↗
Figure 186
Figure 186. Figure 186: FIG. 186 [PITH_FULL_IMAGE:figures/full_fig_p123_186.png] view at source ↗
Figure 187
Figure 187. Figure 187: FIG. 187. Mixed mode thermal scattering in D-7LiD at 400 K [PITH_FULL_IMAGE:figures/full_fig_p128_187.png] view at source ↗
Figure 188
Figure 188. Figure 188: FIG. 188. The cumulative chi-squared deviation for [PITH_FULL_IMAGE:figures/full_fig_p131_188.png] view at source ↗
Figure 189
Figure 189. Figure 189: FIG. 189. The value of [PITH_FULL_IMAGE:figures/full_fig_p132_189.png] view at source ↗
Figure 191
Figure 191. Figure 191: FIG. 191. The value of the neutron multiplication factor ( [PITH_FULL_IMAGE:figures/full_fig_p133_191.png] view at source ↗
Figure 194
Figure 194. Figure 194: FIG. 194. The calculated over experimental value of the neu [PITH_FULL_IMAGE:figures/full_fig_p134_194.png] view at source ↗
Figure 195
Figure 195. Figure 195: FIG. 195. The value of the neutron multiplication factor [PITH_FULL_IMAGE:figures/full_fig_p134_195.png] view at source ↗
Figure 196
Figure 196. Figure 196: FIG. 196. The calculated over experimental value of the [PITH_FULL_IMAGE:figures/full_fig_p135_196.png] view at source ↗
Figure 197
Figure 197. Figure 197: FIG. 197. The value of the neutron multiplication factor ( [PITH_FULL_IMAGE:figures/full_fig_p135_197.png] view at source ↗
Figure 199
Figure 199. Figure 199: FIG. 199. The calculated over experimental value of [PITH_FULL_IMAGE:figures/full_fig_p136_199.png] view at source ↗
Figure 201
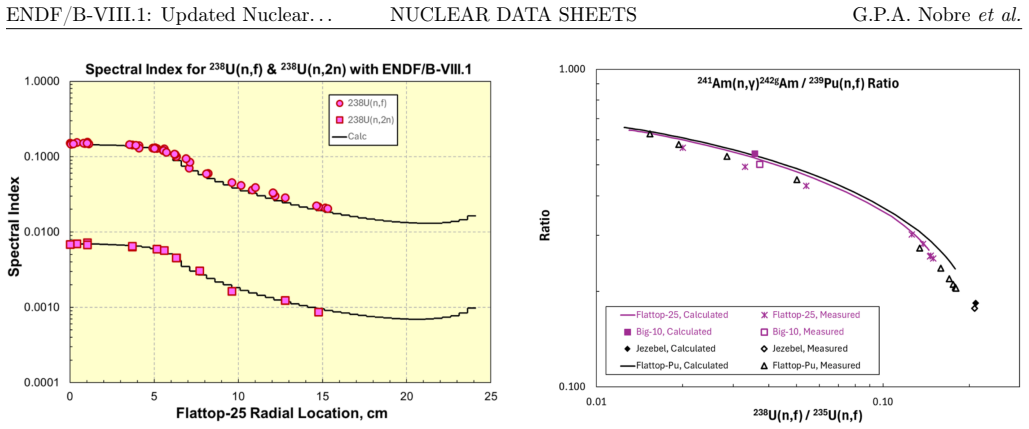
Figure 201. Figure 201: FIG. 201. MCNP-calculated and measured spectral indices for [PITH_FULL_IMAGE:figures/full_fig_p139_201.png] view at source ↗
Figure 202
Figure 202. Figure 202: FIG. 202. MCNP-calculated and measured rates for [PITH_FULL_IMAGE:figures/full_fig_p139_202.png] view at source ↗
Figure 204
Figure 204. Figure 204: FIG. 204. The [PITH_FULL_IMAGE:figures/full_fig_p140_204.png] view at source ↗
Figure 207
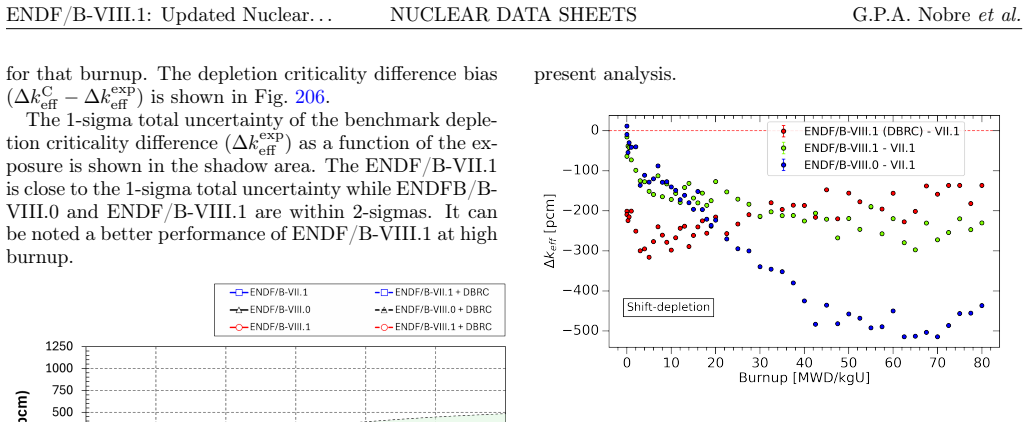
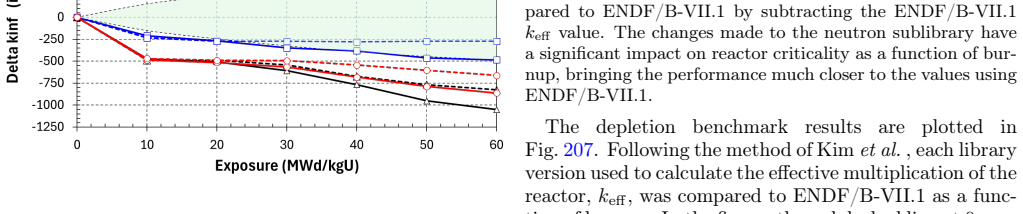
Figure 207. Figure 207: FIG. 207. The depletion calculation for each library is com [PITH_FULL_IMAGE:figures/full_fig_p141_207.png] view at source ↗
Figure 206
Figure 206. Figure 206: FIG. 206. PWR Fuel Assembly Depletion Criticality Bias (in [PITH_FULL_IMAGE:figures/full_fig_p141_206.png] view at source ↗
Figure 208
Figure 208. Figure 208: FIG. 208. Comparison of [PITH_FULL_IMAGE:figures/full_fig_p142_208.png] view at source ↗
Figure 210
Figure 210. Figure 210: FIG. 210. Comparison of [PITH_FULL_IMAGE:figures/full_fig_p142_210.png] view at source ↗
Figure 211
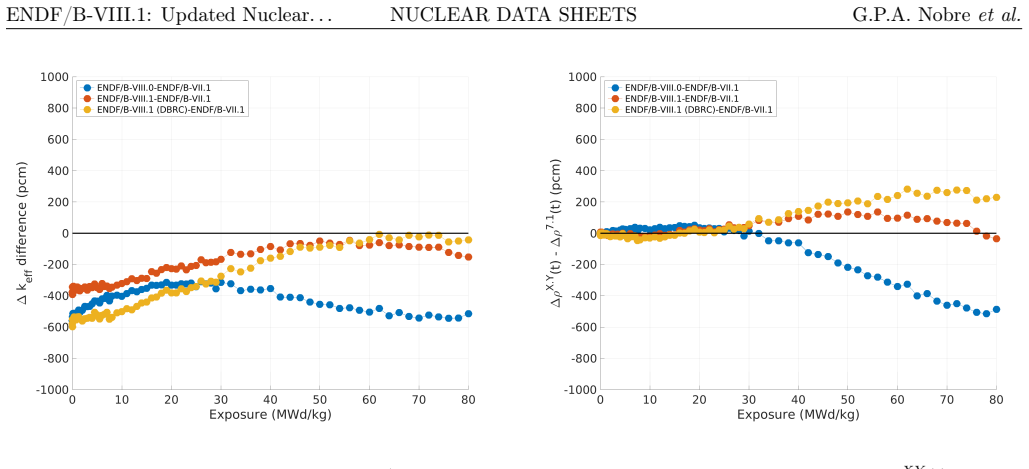
Figure 211. Figure 211: FIG. 211. Differences in the multiplication factor [PITH_FULL_IMAGE:figures/full_fig_p143_211.png] view at source ↗
Figure 212
Figure 212. Figure 212: FIG. 212. Differences in the multiplication factor [PITH_FULL_IMAGE:figures/full_fig_p143_212.png] view at source ↗
Figure 213
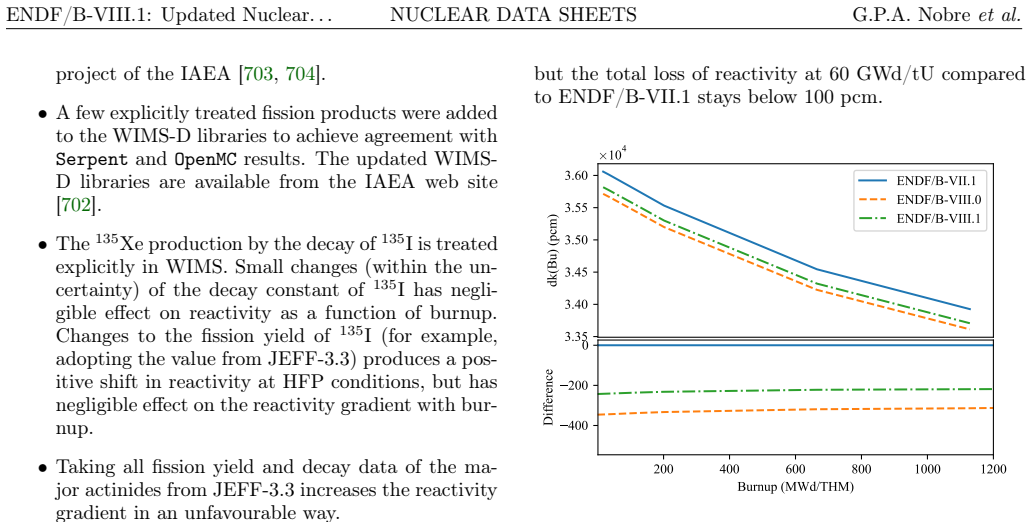
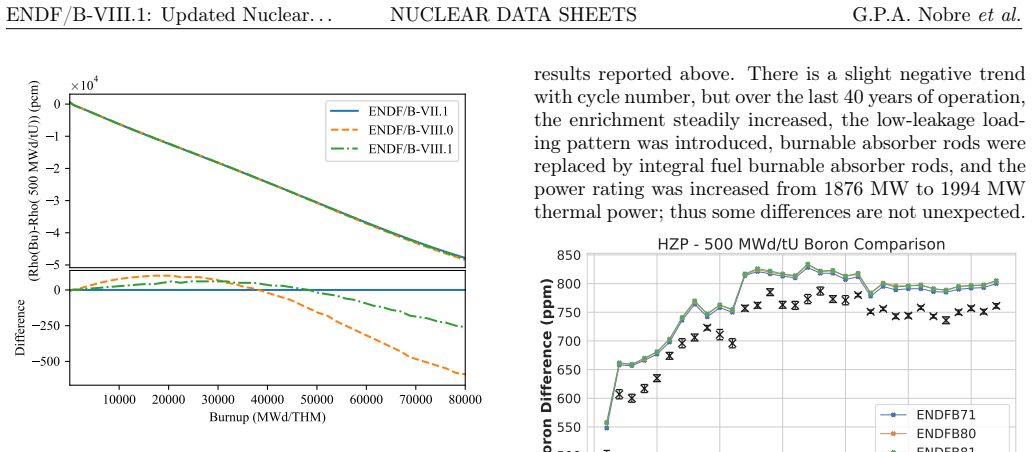
Figure 213. Figure 213: FIG. 213. Reactivity differences relative to ENDF/B-VII.1 [PITH_FULL_IMAGE:figures/full_fig_p144_213.png] view at source ↗
Figure 215
Figure 215. Figure 215: FIG. 215. Differences in the critical boron concentration at [PITH_FULL_IMAGE:figures/full_fig_p144_215.png] view at source ↗
Figure 214
Figure 214. Figure 214: FIG. 214. Critical boron concentration differences with vari [PITH_FULL_IMAGE:figures/full_fig_p144_214.png] view at source ↗
Figure 216
Figure 216. Figure 216: FIG. 216. Differences in the critical boron concentration at [PITH_FULL_IMAGE:figures/full_fig_p145_216.png] view at source ↗
Figure 217
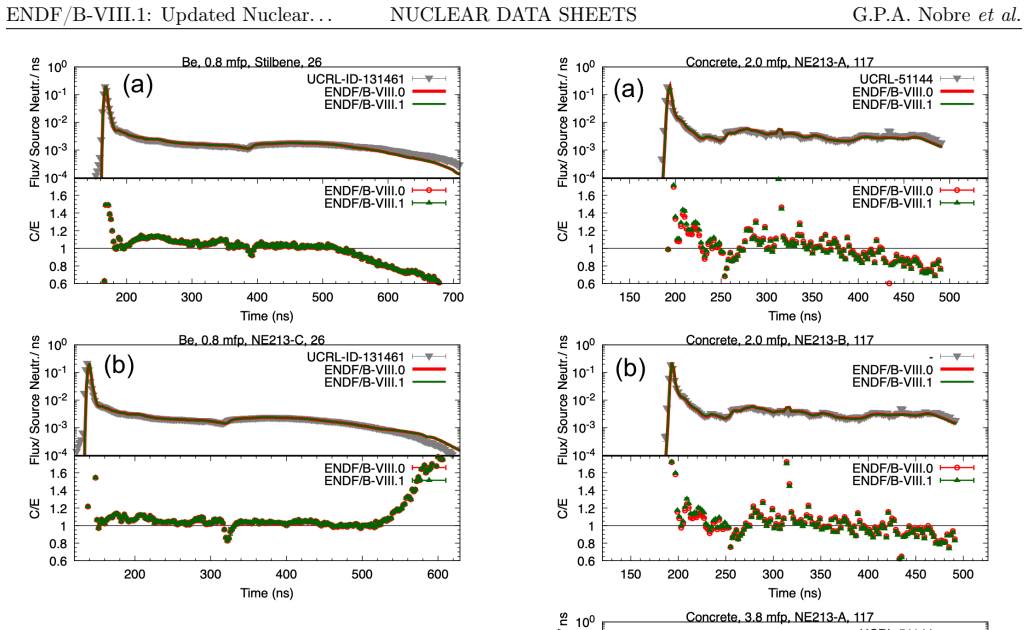
Figure 217. Figure 217: FIG. 217. LLNL pulsed-sphere neutron-leakage spectra simu [PITH_FULL_IMAGE:figures/full_fig_p145_217.png] view at source ↗
Figure 218
Figure 218. Figure 218: FIG. 218. LLNL pulsed-sphere neutron-leakage spectra simu [PITH_FULL_IMAGE:figures/full_fig_p146_218.png] view at source ↗
Figure 219
Figure 219. Figure 219: FIG. 219. LLNL pulsed-sphere neutron-leakage spectra simu [PITH_FULL_IMAGE:figures/full_fig_p146_219.png] view at source ↗
Figure 220
Figure 220. Figure 220: FIG. 220. LLNL pulsed-sphere neutron-leakage spectra simu [PITH_FULL_IMAGE:figures/full_fig_p147_220.png] view at source ↗
Figure 221
Figure 221. Figure 221: FIG. 221. LLNL pulsed-sphere neutron-leakage spectra simu [PITH_FULL_IMAGE:figures/full_fig_p147_221.png] view at source ↗
Figure 222
Figure 222. Figure 222: FIG. 222. LLNL pulsed-sphere neutron-leakage spectra sim [PITH_FULL_IMAGE:figures/full_fig_p148_222.png] view at source ↗
Figure 224
Figure 224. Figure 224: FIG. 224. LLNL pulsed-sphere neutron-leakage spectra simu [PITH_FULL_IMAGE:figures/full_fig_p148_224.png] view at source ↗
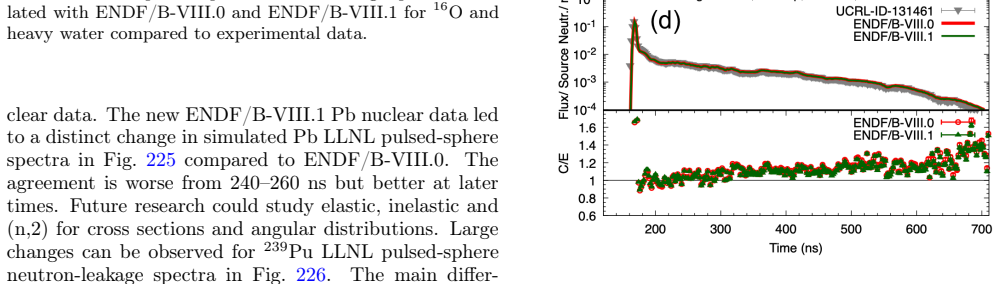
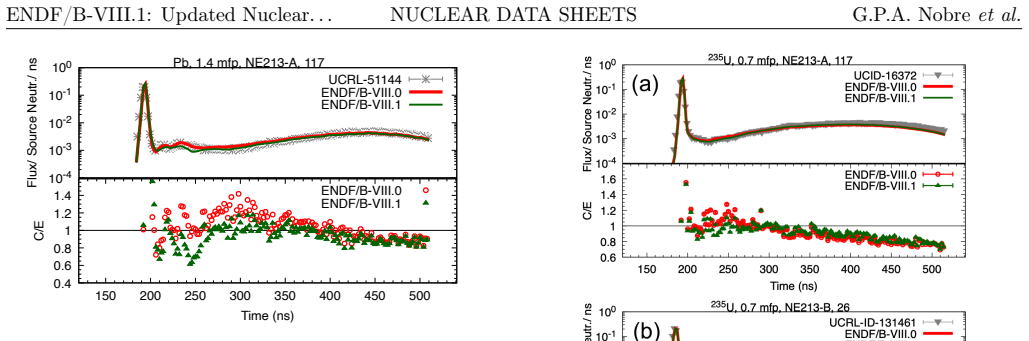
Figure 225
Figure 225. Figure 225: FIG. 225. LLNL pulsed-sphere neutron-leakage spectra simu [PITH_FULL_IMAGE:figures/full_fig_p149_225.png] view at source ↗
Figure 226
Figure 226. Figure 226: FIG. 226. LLNL pulsed-sphere neutron-leakage spectra simu [PITH_FULL_IMAGE:figures/full_fig_p149_226.png] view at source ↗
Figure 227
Figure 227. Figure 227: FIG. 227. LLNL pulsed-sphere neutron-leakage spectra simu [PITH_FULL_IMAGE:figures/full_fig_p149_227.png] view at source ↗
read the original abstract

The ENDF/B-VIII.1 library is the newest recommended evaluated nuclear data file by the Cross Section Evaluation Working Group (CSEWG) for use in nuclear science and technology applications, and incorporates advances made in the six years since the release of ENDF/B-VIII.0. Among key advances made are that the $^{239}$Pu file was reevaluated by a joint international effort and that updated $^{16,18}$O, $^{19}$F, $^{28-30}$Si, $^{50-54}$Cr, $^{55}$Mn, $^{54,56,57}$Fe, $^{63,65}$Cu, $^{139}$La, $^{233,235,238}$U, and $^{240,241}$Pu neutron nuclear data from the IAEA coordinated INDEN collaboration were adopted. Over 60 neutron dosimetry cross sections were adopted from the IAEA's IRDFF-II library. In addition, the new library includes significant changes for $^3$He, $^6$Li,$^9$Be, $^{51}$V, $^{88}$Sr, $^{103}$Rh, $^{140,142}$Ce, Dy, $^{181}$Ta, Pt, $^{206-208}$Pb, and $^{234,236}$U neutron data, and new nuclear data for the photonuclear, charged-particle and atomic sublibraries. Numerous thermal neutron scattering kernels were reevaluated or provided for the very first time. On the covariance side, work was undertaken to introduce better uncertainty quantification standards and testing for nuclear data covariances. The significant effort to reevaluate important nuclides has reduced bias in the simulations of many integral experiments with particular progress noted for fluorine, copper, and stainless steel containing benchmarks. Data issues hindered the successful deployment of the previous ENDF/B-VIII.0 for commercial nuclear power applications in high burnup situations. These issues were addressed by improving the $^{238}$U and $^{239,240,241}$Pu evaluated data in the resonance region. The new library performance as a function of burnup is similar to the reference ENDF/B-VII.1 library. The ENDF/B-VIII.1 data are available in ENDF-6 and GNDS format at https://doi.org/10.11578/endf/2571019.

Editorial analysis

A structured set of objections, weighed in public.

Desk editor's note, referee report, simulated authors' rebuttal, and a circularity audit. Tearing a paper down is the easy half of reading it; the pith above is the substance, this is the friction.

Referee Report

2 major / 3 minor

Summary. The manuscript presents the ENDF/B-VIII.1 evaluated nuclear data library, the latest recommended file from the Cross Section Evaluation Working Group. It incorporates a joint reevaluation of the 239Pu file, adoption of updated neutron data for 16,18O, 19F, 28-30Si, 50-54Cr, 55Mn, 54,56,57Fe, 63,65Cu, 139La, 233,235,238U, and 240,241Pu from the IAEA INDEN collaboration, over 60 dosimetry cross sections from the IRDFF-II library, additional changes to 3He, 6Li, 9Be, 51V, 88Sr, 103Rh, 140,142Ce, Dy, 181Ta, Pt, 206-208Pb, and 234,236U, new photonuclear/charged-particle/atomic data, and numerous reevaluated or new thermal neutron scattering kernels. The paper states that these updates reduce bias in integral experiment simulations (with particular progress for fluorine, copper, and stainless-steel benchmarks), address prior issues with 238U and 239,240,241Pu in the resonance region for high-burnup applications, and yield performance similar to ENDF/B-VII.1 as a function of burnup. Data are released in ENDF-6 and GNDS formats.

Significance. If the performance claims are substantiated, this library constitutes a meaningful incremental advance for nuclear science and applications. The international INDEN collaboration, adoption of IRDFF-II dosimetry standards, and explicit attention to high-burnup resonance data address documented limitations of ENDF/B-VIII.0. Improved covariance practices and expanded thermal-scattering coverage would benefit reactor physics, dosimetry, and radiation-transport modeling. The open release in standard formats supports reproducibility and community use.

major comments (2)
  1. [Abstract / integral benchmarks section] Abstract and integral-benchmark discussion: the claim of reduced bias in fluorine-, copper-, and stainless-steel-containing benchmarks is presented without accompanying C/E tables, quantitative bias reductions, covariance-propagation results, or coverage of the full integral-experiment suite. This evidence gap is load-bearing for the headline assertion that the INDEN adoptions constitute net improvements.
  2. [INDEN collaboration adoptions] Section describing INDEN adoptions for 19F, 63,65Cu, Fe/Cr isotopes, etc.: the manuscript assumes the reevaluated resonance parameters and cross sections are improvements over prior evaluations, yet provides no explicit test for introduction of new systematic biases in regimes outside the cited benchmarks (e.g., high-burnup spectra or specific reflector materials).
minor comments (3)
  1. [References / data sources] Add explicit references or DOIs for the specific INDEN collaboration papers and the IRDFF-II library documentation to improve traceability of adopted data.
  2. [Covariance section] Clarify the concrete changes made to covariance uncertainty quantification standards and testing procedures; the current description remains high-level.
  3. [Summary table of changes] Consider including a short table summarizing the key nuclides updated, their sources (INDEN, IRDFF-II, etc.), and the nature of the change (reevaluation vs. adoption).

Simulated Author's Rebuttal

2 responses · 0 unresolved

We thank the referee for the constructive review and recommendation of minor revision. The comments help clarify the presentation of evidence supporting the ENDF/B-VIII.1 updates. We respond to each major comment below.

read point-by-point responses
  1. Referee: [Abstract / integral benchmarks section] Abstract and integral-benchmark discussion: the claim of reduced bias in fluorine-, copper-, and stainless-steel-containing benchmarks is presented without accompanying C/E tables, quantitative bias reductions, covariance-propagation results, or coverage of the full integral-experiment suite. This evidence gap is load-bearing for the headline assertion that the INDEN adoptions constitute net improvements.

    Authors: The full manuscript includes a benchmarks section with integral experiment comparisons that support the reduced-bias statement for the cited materials. To strengthen the abstract and address the evidence gap, we will add quantitative bias-reduction values and a compact C/E summary table for the fluorine-, copper-, and stainless-steel benchmarks. A complete covariance-propagation study across the entire integral suite lies outside the scope of this library-overview paper and is typically reported in dedicated validation studies; the present work instead emphasizes the improved covariance standards now included in the library. These changes will make the headline claims more directly substantiated while preserving the paper's focus. revision: partial

  2. Referee: [INDEN collaboration adoptions] Section describing INDEN adoptions for 19F, 63,65Cu, Fe/Cr isotopes, etc.: the manuscript assumes the reevaluated resonance parameters and cross sections are improvements over prior evaluations, yet provides no explicit test for introduction of new systematic biases in regimes outside the cited benchmarks (e.g., high-burnup spectra or specific reflector materials).

    Authors: The INDEN evaluations adopted here were produced by an international collaboration that performed extensive validation against both differential data and a range of integral benchmarks. The manuscript already notes targeted improvements for high-burnup resonance behavior in the 238U and 239,240,241Pu files. For the additional isotopes (19F, Cu, Fe/Cr, etc.), we will insert a clarifying paragraph stating that the INDEN process included checks in representative spectra and that application-specific validation remains the user's responsibility. This addition directly responds to the concern without requiring new calculations. revision: yes

Circularity Check

0 steps flagged

No circularity: ENDF/B-VIII.1 updates rely on external reevaluations and benchmarks

full rationale

The paper reports adoption of reevaluated neutron data for specific nuclides from the external INDEN collaboration, IAEA IRDFF-II library, and prior ENDF versions, with performance claims tied to comparisons against independent integral experiments. No equations, fitted parameters, or derivations appear that reduce by construction to quantities defined inside this work; the bias-reduction statement references external benchmarks rather than self-referential inputs. Self-citations exist but are not load-bearing for any central claim, satisfying the criteria for a self-contained compilation report.

Axiom & Free-Parameter Ledger

2 free parameters · 1 axioms · 0 invented entities

The library update rests on numerous fitted resonance parameters and model parameters derived from experimental data, plus standard assumptions about the completeness and accuracy of those measurements.

free parameters (2)
  • resonance parameters for 238U, 239Pu and other key isotopes
    These parameters are adjusted to match experimental cross-section data in the resonance region.
  • thermal scattering kernel parameters for numerous materials
    New or reevaluated kernels involve fitting to measured scattering data.
axioms (1)
  • domain assumption Experimental nuclear data and nuclear reaction models provide a reliable basis for evaluation
    The entire library construction assumes that the input measurements and theoretical models used by the evaluation teams are sufficiently accurate and complete.

pith-pipeline@v0.9.0 · 6564 in / 1347 out tokens · 29753 ms · 2026-05-18T01:11:54.953493+00:00 · methodology

discussion (0)

Sign in with ORCID, Apple, or X to comment. Anyone can read and Pith papers without signing in.

Lean theorems connected to this paper

Citations machine-checked in the Pith Canon. Every link opens the source theorem in the public Lean library.

What do these tags mean?
matches
The paper's claim is directly supported by a theorem in the formal canon.
supports
The theorem supports part of the paper's argument, but the paper may add assumptions or extra steps.
extends
The paper goes beyond the formal theorem; the theorem is a base layer rather than the whole result.
uses
The paper appears to rely on the theorem as machinery.
contradicts
The paper's claim conflicts with a theorem or certificate in the canon.
unclear
Pith found a possible connection, but the passage is too broad, indirect, or ambiguous to say the theorem truly supports the claim.

Forward citations

Cited by 3 Pith papers

Reviewed papers in the Pith corpus that reference this work. Sorted by Pith novelty score.

  1. Resonance Statistics -Informed Fitting Applied to Automated Cross Section Evaluation

    physics.comp-ph 2026-04 unverdicted novelty 5.0

    Resonance statistics-informed methods in automated fitting reduce spin group bias, enhance Wigner statistics consistency, and stabilize resonance density with minimal impact on cross section fit quality.

  2. Monte Carlo Simulations of Suprathermal Enhancement in Advanced Nuclear Fusion Fuels

    physics.plasm-ph 2026-04 unverdicted novelty 5.0

    Monte Carlo simulations indicate suprathermal fusion enhancements are overestimated in prior deuterium work, with only DT reaching criticality without neutron leakage and p11B gains capped below 40 percent of beam energy.

  3. ALPHANSO: Open-Source Modeling of ($\alpha$,n) Neutron Source Terms

    physics.comp-ph 2026-03 unverdicted novelty 5.0

    ALPHANSO is an open-source Python tool that computes (α,n) neutron source terms with updated nuclear data and validates its outputs against experiments and other codes.

Reference graph

Works this paper leans on

1 extracted references · 1 canonical work pages · cited by 3 Pith papers

  1. [1]

    NUCLEAR DATA SHEETS G.P.A

    -THERM-049-006 1.00120 0.00250 1.00792 0.00013 1.00671 1.00597 0.00013 1.00476 HEU-SOL-THERM-049-007 1.00120 0.00240 1.00851 0.00013 1.00730 1.00664 0.00013 1.00543 HEU-SOL-THERM-049-008 1.00120 0.00240 1.00725 0.00012 1.00605 1.00556 0.00012 1.00435 HEU-SOL-THERM-049-009 1.00120 0.00200 0.99968 0.00014 0.99848 0.99782 0.00014 0.99662 HEU-SOL-THERM-049-01...