Recognition: unknown
Eppur non si trovano Vol. 2: No Planetary-mass Primordial Black Holes toward the Andromeda Galaxy
Pith reviewed 2026-05-08 02:24 UTC · model gemini-3-flash-preview
The pith
The claimed discovery of planetary-mass primordial black holes in the Andromeda Galaxy is a misidentification of variable stars.
A machine-rendered reading of the paper's core claim, the machinery that carries it, and where it could break.
Core claim
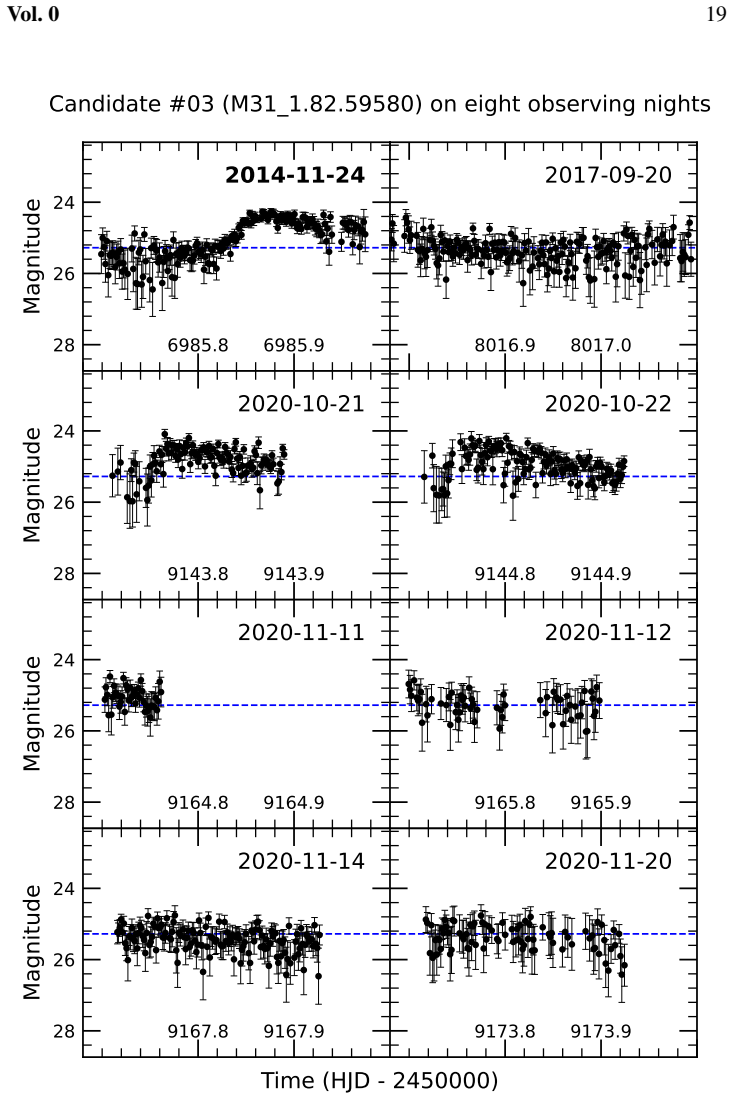
The authors show that the twelve microlensing candidates identified in previous work are misclassified variable stars, primarily RR Lyrae stars and eclipsing binaries. By applying an independent difference image analysis pipeline to the original data, they reveal that the light curves of these objects exhibit asymmetries and multi-night variability that are incompatible with the physics of gravitational microlensing. This finding removes the primary evidence for a large population of planetary-mass primordial black holes acting as dark matter in the local group.
What carries the argument
Difference Image Analysis (DIA). This is a method that subtracts a reference image of a star field from a new observation to isolate changes in brightness. It is used here to distinguish the unique, symmetric signature of a one-time microlensing event from the repeating or asymmetric patterns of variable stars in the crowded environment of a distant galaxy.
If this is right
- Constraints on the abundance of primordial black holes in the mass range of 10^-6 to 10^-4 solar masses remain at their previous low levels.
- The search for dark matter must continue to focus on other candidates, as planetary-mass black holes are ruled out as a primary component.
- Future microlensing surveys must incorporate multi-night baselines to effectively filter out stellar variables that mimic short-duration transients.
Where Pith is reading between the lines
- The misidentification in the original study likely occurred because the observation window was too narrow to catch the full cycle of the variable stars' periodic pulses.
- The result suggests that high-cadence sampling can create 'aliasing' where periodic signals are mistaken for single peaks if the temporal baseline is insufficient.
- This reinforces the model that the dark matter halo is not composed of compact objects in the planetary mass range, pushing researchers back toward particle-based or extremely high/low mass theories.
Load-bearing premise
The independent image processing pipeline correctly handles the extremely dense star fields of the Andromeda Galaxy without introducing its own systematic errors.
What would settle it
If long-term monitoring of these twelve specific locations shows that the brightness changes never repeat and maintain a perfectly symmetric profile, the identification as variable stars would be invalidated.
Figures


read the original abstract
A recent preprint by Sugiyama et al. reported the discovery of twelve candidates for short-timescale (less than one day) gravitational microlensing events based on high-cadence photometric observations of the Andromeda Galaxy (M31) using the Subaru Hyper Suprime-Cam. These detections were attributed to a large population of planetary-mass primordial black holes (PBHs) that could account for the entirety of the dark matter in the Milky Way and M31 halos. However, these results are in clear tension with previous searches for short-timescale microlensing events toward the Magellanic Clouds, such as those by the OGLE survey. In addition, both the temporal and spatial distributions of the Subaru candidates are inconsistent with expectations for microlensing events. Here, we reanalyze the Subaru data using an independent difference image analysis photometric pipeline. We find that all twelve candidates identified by Sugiyama et al. exhibit asymmetric light curves and/or variability on multiple nights of Subaru observations. Our analysis reveals that among them ten objects are RR Lyrae stars, one is an eclipsing binary, and one is an unclassified variable star. We find no compelling evidence for short-timescale microlensing events among the candidates identified in the Subaru data set, nor for a significant population of planetary-mass PBHs as dark matter components. Our results underscore the necessity of robust variable-star rejection in high-cadence microlensing searches using large telescopes.
Editorial analysis
A structured set of objections, weighed in public.
Referee Report
Summary. This manuscript re-evaluates the 12 planetary-mass primordial black hole (PBH) microlensing candidates recently reported by Sugiyama et al. (2024) using Subaru/HSC data. By employing an independent difference image analysis (DIA) pipeline based on the OGLE software and incorporating data from multiple observation nights (2016–2020), the authors demonstrate that all 12 candidates are actually known or newly identified variable stars. Specifically, they identify 10 RR Lyrae stars, one eclipsing binary, and one unclassified variable. The multi-night variability and characteristic light-curve shapes (phased with periods between 0.29 and 0.77 days) are physically incompatible with the one-time, symmetric transient nature of gravitational microlensing, thereby nullifying the claim of a significant planetary-mass PBH population based on this dataset.
Significance. The paper provides a crucial corrective to a high-impact claim in the field of dark matter. The identification of primordial black holes as the primary constituent of dark matter would be a fundamental discovery; however, this manuscript shows that the Sugiyama et al. results were likely contaminated by stellar variability. The significance lies in the methodological rigor: using an independent pipeline (OGLE DIA), multi-year archival data to check for periodicity, and physical consistency checks (standard candle magnitudes for RR Lyrae at M31 distance). This is a textbook example of how high-cadence surveys require multi-epoch follow-up or archival cross-matching to distinguish microlensing from the vast background of intrinsic stellar variables.
major comments (2)
- [Section 3.1, Table 1] The authors derive precise periods (e.g., 0.51125 d for Object 1) using data spanning multiple years. To ensure the robustness of the variable star classification, the manuscript should explicitly state the period-searching algorithm employed (e.g., Lomb-Scargle, Analysis of Variance) and provide a measure of the statistical significance or 'alias risk' for these periods, given the large gaps between Subaru runs (S16A to S20B).
- [Section 3.2, Paragraph 1] The claim that the observed magnitudes ($r \approx 25.4$) are consistent with RR Lyrae stars at M31 distance is central to the debunking. The authors should provide a brief calculation or reference comparing this observed magnitude to the expected $M_r$ of RR Lyrae stars, adjusted for the M31 distance modulus ($μ \approx 24.4$) and typical extinction, to strengthen the 'standard candle' argument for this identification.
minor comments (3)
- [Figure 1 and 2] The phased light curves are highly convincing. However, it would be helpful to include the original (unphased) data for at least one representative object in an appendix or a small inset to illustrate the sparsity of the sampling relative to the multi-year baseline.
- [Abstract & Introduction] The manuscript mentions that the 'spatial distributions' of the Subaru candidates were inconsistent with microlensing expectations. While the periodicity argument is the 'smoking gun,' the paper would benefit from a small plot showing the spatial distribution of these 12 stars relative to the M31 disk/halo structure to support this secondary claim.
- [Section 3.1, Object 12] Object 12 is listed as 'unclassified variable.' While its variability across multiple nights (Figure 2) is sufficient to rule out microlensing, a brief mention of why it does not fit the RR Lyrae or EB categories (e.g., irregular timing or unusual color) would be informative.
Simulated Author's Rebuttal
We thank the referee for their positive assessment of our manuscript and for recognizing the methodological rigor of our re-analysis. The referee’s comments regarding the period-finding procedure and the standard candle nature of the candidates are well-taken. We have incorporated specific details and calculations to address these points, which we believe strengthen the physical arguments presented in the paper.
read point-by-point responses
-
Referee: [Section 3.1, Table 1] The authors derive precise periods (e.g., 0.51125 d for Object 1) using data spanning multiple years. To ensure the robustness of the variable star classification, the manuscript should explicitly state the period-searching algorithm employed (e.g., Lomb-Scargle, Analysis of Variance) and provide a measure of the statistical significance or 'alias risk' for these periods, given the large gaps between Subaru runs (S16A to S20B).
Authors: We have updated Section 3.1 to specify that we used the Analysis of Variance (AoV; Schwarzenberg-Czerny 1989) algorithm for period searching, which is particularly robust for non-sinusoidal light curves like those of RR Lyrae stars. Regarding the 'alias risk': while the multi-year gaps between Subaru runs (S16A, S19A, S20B) are indeed large, the risk of daily aliasing is significantly mitigated by the high cadence within individual nights. For example, the S16A run provides nearly 7 hours of continuous monitoring. The observed 'slope' or rate of change during these windows acts as a strong constraint on the period, as the phase must evolve consistently with the intra-night data. This intra-night 'lever arm' allows us to distinguish between aliases that would otherwise be degenerate in sparser datasets. We have added a sentence to the manuscript clarifying how the intra-night cadence assists in period disambiguation. revision: yes
-
Referee: [Section 3.2, Paragraph 1] The claim that the observed magnitudes ($r \approx 25.4$) are consistent with RR Lyrae stars at M31 distance is central to the debunking. The authors should provide a brief calculation or reference comparing this observed magnitude to the expected $M_r$ of RR Lyrae stars, adjusted for the M31 distance modulus ($μ \approx 24.4$) and typical extinction, to strengthen the 'standard candle' argument for this identification.
Authors: We agree that an explicit calculation strengthens the identification. Taking the distance modulus to M31 as $\mu \approx 24.44$ (e.g., Ribas et al. 2005) and the typical absolute magnitude of RR Lyrae stars as $M_r \approx +0.5$ to $+0.6$ (depending on metallicity), the expected apparent magnitude is $r \approx 25.0$. Accounting for a typical foreground Galactic extinction toward M31 of $A_r \approx 0.17$ (Schlafly & Finkbeiner 2011) and potential moderate extinction within M31 itself, the expected observed magnitude is $r \approx 25.2-25.5$. Our identified candidates, centered around $r \approx 25.4$, are in excellent agreement with this range. We have added this arithmetic and the relevant references to Section 3.2 to make this consistency more transparent to the reader. revision: yes
Circularity Check
No circularity: independent empirical re-analysis of observational data.
full rationale
The paper presents an independent re-reduction of the Subaru Hyper Suprime-Cam dataset using the OGLE Difference Image Analysis (DIA) pipeline. The core finding—that twelve previously reported microlensing candidates are in fact variable stars (primarily RR Lyrae and eclipsing binaries)—is reached through an empirical identification of multi-night periodicity and light-curve asymmetry in the processed data. The analysis does not rely on self-defining assumptions or load-bearing self-citations to force its conclusions; rather, it identifies physical characteristics in the light curves (such as specific periods and magnitudes consistent with the distance to M31) that are incompatible with the microlensing hypothesis. The methodology is a standard observational cross-check where the 'prediction' of variable star nature is a falsifiable discovery made through data analysis, not a result guaranteed by the pipeline's construction or author-specific theorems.
Axiom & Free-Parameter Ledger
axioms (2)
- domain assumption Gravitational microlensing events are singular, non-repeating events.
- domain assumption Light curve morphology (shape and period) can definitively classify RR Lyrae stars.
Forward citations
Cited by 3 Pith papers
-
Microlensing of fast and slow compact objects
Microlensing surveys constrain fast and slow compact objects at masses and densities differing by orders of magnitude from dark matter limits due to speed-mass degeneracy in Einstein crossing times.
-
Primordial Black Hole from Tensor-induced Density Fluctuation: First-order Phase Transitions and Domain Walls
Tensor perturbations from first-order phase transitions and domain wall annihilation induce curvature fluctuations at second order that form primordial black holes, allowing asteroid-mass PBHs to comprise all dark mat...
-
In-depth analysis of the clustering of dark matter particles around primordial black holes. Part III: CMB constraints
CMB data limits the s-wave annihilation cross section of thermal dark matter particles to ≲ 10^{-30} cm³/s scaled by PBH fraction and mass for PBHs heavier than ~10^{-10} solar masses.
Reference graph
Works this paper leans on
-
[1]
Alcock, C.,et al.1996,ApJ,471,
Aihara, H.,et al.2018,PASJ,70, S4. Alcock, C.,et al.1996,ApJ,471,
2018
-
[2]
Baba, H.,et al.2002, in Astronomical Data Analysis Software and Systems XI,Astronomical Society of the Pacific Conference Series, vol
Alcock, C.,et al.1998,ApJL,499, L9. Baba, H.,et al.2002, in Astronomical Data Analysis Software and Systems XI,Astronomical Society of the Pacific Conference Series, vol. 281, eds. D.A. Bohlender, D. Durand, and T.H. Handley,
1998
-
[3]
Chambers, K.C.,et al.2016,arXiv e-prints, arXiv:1612.05560
Blas, D.,et al.2026,arXiv e-prints, arXiv:2602.12252. Chambers, K.C.,et al.2016,arXiv e-prints, arXiv:1612.05560. Craig, M.,et al.2025, astropy/ccdproc: 2.5.1: The final 2.x release. Crotts, A.P.S. 1992,ApJL,399, L43. Domènech, G., Pi, S., and Wang, A. 2026,arXiv e-prints, arXiv:2602.24061. Furusawa, H.,et al.2018,PASJ,70, S3. Gaia Collaboration,et al.201...
-
[4]
1994,A&A,286,
Jetzer, P. 1994,A&A,286,
1994
-
[5]
2026,arXiv e-prints, arXiv:2602.09558
Kasai, K., Kawasaki, M., Murai, K., and Neda, S. 2026,arXiv e-prints, arXiv:2602.09558. Kawanomoto, S.,et al.2018,PASJ,70,
-
[6]
Li, S., Riess, A.G., Busch, M.P., Casertano, S., Macri, L.M., and Yuan, W
Komiyama, Y .,et al.2018,PASJ,70, S2. Li, S., Riess, A.G., Busch, M.P., Casertano, S., Macri, L.M., and Yuan, W. 2021,ApJ,920,
2018
-
[7]
Mróz, P.,et al.2017,Nature,548,
Miyazaki, S.,et al.2018,PASJ,70, S1. Mróz, P.,et al.2017,Nature,548,
2018
-
[8]
Niikura, H., Takada, M., Yokoyama, S., Sumi, T., and Masaki, S
Narloch, W.,et al.2024,A&A,689, A138. Niikura, H., Takada, M., Yokoyama, S., Sumi, T., and Masaki, S. 2019a,Phys. Rev. D,99, 083503. Niikura, H.,et al.2019b,Nature Astronomy,3,
2024
-
[9]
Renault, C.,et al.1998,A&A,329,
Renault, C.,et al.1997,A&A,324, L69. Renault, C.,et al.1998,A&A,329,
1997
-
[10]
1993,PASP,105,
Schechter, P.L., Mateo, M., and Saha, A. 1993,PASP,105,
1993
-
[11]
1989,MNRAS,241,
Schwarzenberg-Czerny, A. 1989,MNRAS,241,
1989
-
[12]
Soszy´nski, I.,et al.2014,Acta Astron.,64,
2014
-
[13]
Soszy´nski, I.,et al.2016,Acta Astron.,66,
2016
-
[14]
Sugiyama, S., Takada, M., Yasuda, N., and Tominaga, N. 2026,arXiv e-prints, arXiv:2602.05840. Sumi, T.,et al.2023,AJ,166,
-
[15]
2003,Acta Astron.,53,
Udalski, A. 2003,Acta Astron.,53,
2003
-
[16]
2015,Acta Astron.,65,
Udalski, A., Szyma´nski, M.K., and Szyma´nski, G. 2015,Acta Astron.,65,
2015
-
[17]
2000,Acta Astron.,50,
Wo´ zniak, P.R. 2000,Acta Astron.,50,
2000
-
[18]
V ol. 013 6985.8 6985.9 23.0 23.5 24.0 24.5 25.0Magnitude 2014-11-24 8016.9 8017.0 2017-09-20 9143.8 9143.9 23.0 23.5 24.0 24.5 25.0Magnitude 2020-10-21 9144.8 9144.9 2020-10-22 9164.8 9164.9 23.0 23.5 24.0 24.5 25.0Magnitude 2020-11-11 9165.8 9165.9 2020-11-12 9167.8 9167.9 23.0 23.5 24.0 24.5 25.0Magnitude 2020-11-14 9173.8 9173.9 2020-11-20 Candidate (...
2014
discussion (0)
Sign in with ORCID, Apple, or X to comment. Anyone can read and Pith papers without signing in.