REVIEW 3 major objections 5 minor 3 cited by
Extreme optical line ratios in z>3 galaxies arise from harder spectra, massive star clusters, and elevated nitrogen.
Reviewed by Pith at T0; open to challenge. T0 means a machine referee read the full paper against a public rubric. the ladder, T0–T4 →
T0 review · grok-4.5
2026-07-12 17:23 UTC pith:VJEGUCOX
load-bearing objection Lumen is a real methodological step forward and the multi-diagram isolation of mechanisms is clean; the Master model’s extreme uniform cluster-mass floor is the load-bearing lever and is acknowledged as such. the 3 major comments →
Origins of Extreme Emission-Line Ratios in z > 3 Galaxies: Insights from the Lumen Model
The pith
A machine-rendered reading of the paper's core claim, the machinery that carries it, and where it could break.
Core claim
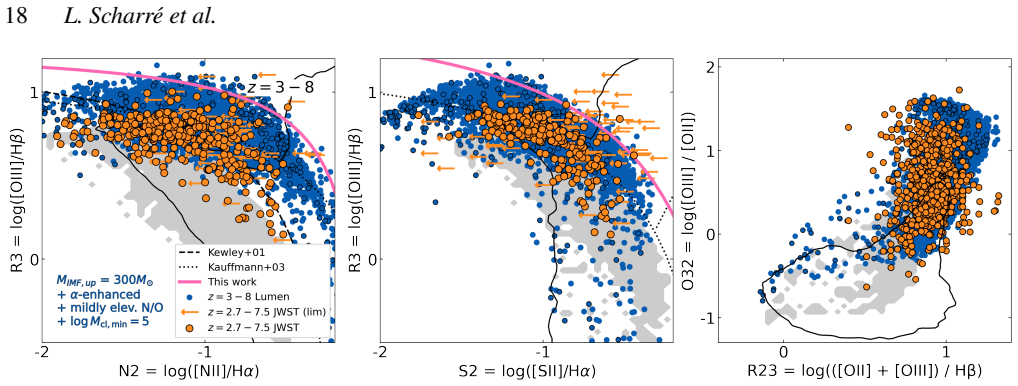
Models that simultaneously include harder ionizing spectra (higher IMF upper-mass cutoff plus alpha-enhancement), elevated ionization parameters powered by massive star clusters of at least 10^5-10^6 solar masses, and enhanced nitrogen abundances reproduce the observed high-redshift galaxy population across the N2-BPT, S2-VO87, and O32-R23 diagrams; alpha-enhancement or density changes alone cannot.
What carries the argument
Lumen: a post-processing framework that resamples young star particles into a cluster mass function, reinserts the clusters into dense gas, and couples each cluster to a Cloudy photoionization model so that spatially distributed HII-region emission can be summed into galaxy-integrated line ratios.
Load-bearing premise
That high-redshift star clusters can be modelled simply by raising the minimum cluster mass by two to three orders of magnitude while keeping the same power-law slope, and that this change can be applied uniformly to every galaxy.
What would settle it
A statistically complete sample of rest-frame optical spectra at z greater than 3 that measures [NII]/H-alpha, [SII]/H-alpha and [OIII]/[OII] simultaneously and finds either no need for clusters above 10^5 solar masses or a systematic suppression of [SII] that matches high-density models.
Editorial analysis
A structured set of objections, weighed in public.
Referee Report
Summary. The paper introduces Lumen, a post-processing framework that resamples young TNG50 star particles into clusters drawn from a Griffin-inspired CMF, places them into dense gas, and assigns Cloudy photoionization models to produce spatially distributed HII-region emission. After validating the Base model at z=0 against PHANGS HII-region properties, local BPT/VO87/O32–R23 sequences, the Hα luminosity function, and strong-line metallicity calibrations, the authors apply a controlled suite of single-parameter variations (harder SEDs via higher IMF upper-mass cutoff and α-enhancement, AGN, elevated M_cl,min, higher n_H, elevated N/O, LyC leakage, dust variants) plus one composite “Master” model to z=3–8. They conclude that α-enhancement alone is insufficient; moderate offsets require harder spectra plus AGN, while the most extreme R3 and O32 values require high ionization parameters from massive clusters (≳10^5–10^6 M⊙), and the highest N2 additionally needs enhanced N/O. High uniform densities (n~10^4 cm^{-3}) boost several ratios but suppress S2, creating tension with observations. The Master model motivates new demarcation lines for star-forming galaxies.
Significance. If the central claim holds, the work supplies a cosmologically embedded, multi-HII-region framework that systematically isolates the physical drivers of the JWST-era BPT and O32–R23 offsets and yields concrete, falsifiable demarcation lines. Strengths include the explicit z=0 validation against resolved HII-region statistics (PHANGS) and integrated diagnostics, the controlled single-parameter suite that cleanly separates spectral hardness from ionization-parameter and abundance effects, and the transparent construction of the Master model. The framework is reusable for future metallicity-diagnostic tests and for other simulations, which is a genuine methodological advance over single-zone or galaxy-wide photoionization assignments.
major comments (3)
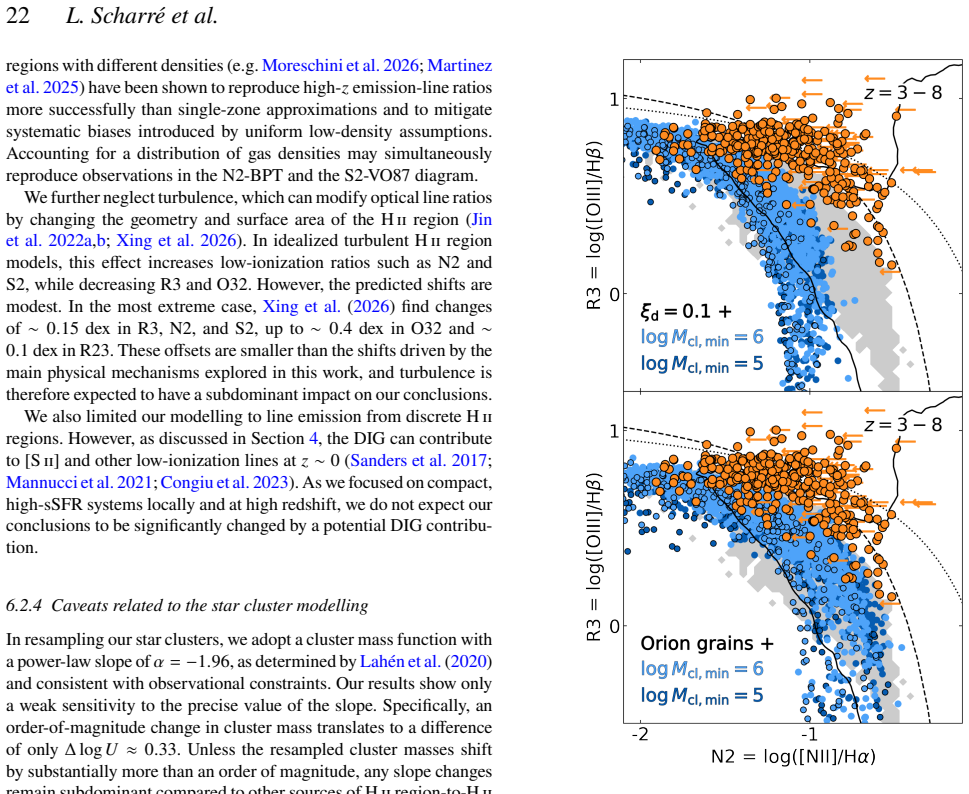
- The central claim that massive star clusters are required for the bulk high-z population rests almost entirely on raising M_cl,min from 10^3 to 10^5–10^6 M⊙ while keeping α≈−2 and applying the floor uniformly to every galaxy (§2.2.1, §3.4.2, Table 2, §5.4). Because U scales as Q^{1/3} (Eq. 2) and Q scales with cluster mass, this single change produces the ~0.4–0.6 dex mean log U increase that alone matches the bulk of the JWST high-R3/O32 points (Fig. 12). The paper itself notes that the true population “likely spans a continuum” between Base and Master and that lower-mass clusters may simply be under-detected (§5.4, §6.2.4). Without at least one intermediate-CMF or mixed-population run (or a quantitative demonstration that a realistic high-z CMF still yields the same locus), the claim that massive clusters are required for the bulk population remains under-supported.
- The Master model is presented as the successful synthesis that “reproduces the observed high-z galaxy population” (abstract, §5.4, Fig. 10), yet it is an intentionally extreme, uniform application of every lever. The resulting locus over-predicts the density of extreme points relative to the data, and the new demarcation lines (Eqs. 3–4) are drawn from that extreme edge. The paper should either (i) show a continuum of models between Base and Master that brackets the observed scatter without over-prediction, or (ii) clearly reframe the Master model and the new lines as an upper-bound envelope rather than a population match.
- High n_H = 10^4 cm^{-3} simultaneously reaches extreme R3/O32/N2 while suppressing S2 below the observed high-z distribution (§5.1–5.3, Fig. 8). The paper correctly flags the tension, but the discussion of multi-density or multi-component models (§6.2.3) remains qualitative. Because density is one of the few levers that can boost N2 without elevated N/O, a concrete test (even a two-zone toy model) is needed before density can be ruled out or retained as a viable contributor for a subset of systems.
minor comments (5)
- Figure 1 caption and legend: the redshift colour scale and survey symbols are dense; a simplified key or separate panels would improve readability.
- Notation table (Table 1) defines R3, N2, etc., as logarithms, but the text occasionally uses the same symbols for the linear ratios; a consistent convention would help.
- Section 3.3.2: the ranking of clusters by age and gas cells by density is described clearly, but a short quantitative check that the resulting age–density correlation matches high-resolution simulations or observations would strengthen the placement scheme.
- Appendix A (z=2 results) is useful but under-referenced in the main text; a brief pointer in §5 would help readers who want the intermediate-redshift comparison.
- Typos/formatting: occasional missing spaces around units (e.g., “10 4 cm−3”), and the arXiv header still carries placeholder “Accepted XXX”.
Circularity Check
No load-bearing circularity: high-z Master-model success is an independent parameter-variation test against JWST data, not a fit renamed as prediction.
specific steps
-
fitted input called prediction
[§3.3.3 (Base-model calibration of ε)]
"We therefore treated ε as a calibration parameter to reproduce an empirically motivated distribution of ionization parameters. ... Inspired by Carton et al. (2017), we adopted log U = −log Z_gas − 3.25 to estimate log U from the mean gas-phase metallicity Z_gas in 50 annuli ... we then inverted Equation 2 to derive a radial profile of ε."
ε is not predicted from first principles; it is inverted so that the Base-model U distribution follows an external empirical U–Z relation at z=0. This is ordinary post-processing calibration and is not used to claim a prediction of that same U–Z relation. It does not force the high-z Master-model results, which arise from independent changes to IMF cutoff, cluster-mass floor and N/O that are compared to JWST data.
full rationale
The paper’s central claim is that a composite of harder spectra (higher IMF upper-mass cutoff + α-enhancement), elevated ionization parameters from a raised cluster-mass floor (≳10^5–10^6 M⊙), and mild N/O enhancement can jointly cover the observed z=3–8 loci in N2-BPT, S2-VO87 and O32–R23. That claim is tested by running discrete Lumen variants, each changing one (or a few) inputs relative to a Base model that was calibrated only at z=0, and comparing the resulting Cloudy line ratios to external JWST samples. The sole empirical calibration is the volume-filling factor ε, which is inverted from an adopted log U = −log Z_gas − 3.25 relation (Carton et al. 2017) so that the Base model recovers local H II-region and SDSS sequences; this sets the absolute U scale at z=0 but does not force the high-z offsets. Raising M_cl,min increases Q and therefore U via the explicit Strömgren scaling (Eq. 2); the consequent rise in R3 and O32 is a genuine model prediction, not a tautology. The Master model is openly described as an intentionally extreme, uniformly applied combination chosen after inspecting which individual levers move the loci, and the authors themselves note that real galaxies likely occupy a continuum between Base and Master. Self-citations to prior Hirschmann et al. work supply the AGN NLR grid and a comparison baseline (Appendix B) but are not used as uniqueness theorems that forbid alternatives. No equation equates a fitted parameter to the claimed high-z line-ratio offsets by construction. Score 1 reflects only the minor, non-load-bearing z=0 ε calibration.
Axiom & Free-Parameter Ledger
free parameters (6)
- minimum star-cluster mass M_cl,min =
10^5–10^6 M⊙
- N/O abundance offset =
+0.1 / +0.6 dex
- ionized-gas density n_H =
10^2–10^4 cm^{-3}
- volume-filling factor ε radial profile =
calibrated per annulus
- IMF upper-mass cutoff =
300 M⊙
- stellar metallicity reduction for α-enhancement =
Z_gas/5
axioms (5)
- domain assumption Cluster mass function dN/dM ∝ M^–1.96 between 10^3 M⊙ and M_cl,max set by Σ_SFR (Lahén et al. 2020 / Griffin)
- domain assumption Cloudy photoionization models with fixed n_H, ξ_d=0.3, solar C/O and Gutkin et al. (2016) abundance patterns adequately represent real HII regions
- ad hoc to paper Youngest clusters reside in densest gas cells; older clusters in progressively more diffuse gas
- domain assumption TNG50 star-forming gas densities and metallicities can be used as proxies for HII-region conditions after the ε calibration
- domain assumption Diffuse ionized gas contribution is negligible for the high-sSFR systems under study
invented entities (2)
-
Lumen framework
independent evidence
-
Master model
no independent evidence
read the original abstract
Optical emission-line ratios in star-forming galaxies at $z \sim 3$-8, such as [OIII]/H$\beta$ and [OIII]/[OII], are strongly offset from those at $z \sim 0$-2, pointing to more extreme ionization and ISM conditions in the early Universe. To constrain the physical origin of these offsets, we developed Lumen, a framework for modelling nebular emission from spatially distributed HII regions in cosmological simulations. We apply Lumen to IllustrisTNG50, validate its predictions at low redshift, and test a suite of proposed mechanisms for producing extreme line ratios at $z = 3$-8. We focus on the [NII]/H$\alpha$ versus [OIII]/H$\beta$ (N2-BPT) diagram, the [SII]/H$\alpha$ versus [OIII]/H$\beta$ (S2-VO87) diagram, and the [OIII]/[OII] versus ([OII]+[OIII])/H$\beta$ (O32-R23) diagram. We find that $\alpha$-enhancement alone cannot explain the bulk of observations. Moderate offsets emerge from the combined effects of $\alpha$-enhancement, a higher IMF upper-mass cutoff, and AGN contributions. The most extreme [OIII]/H$\beta$ and [OIII]/[OII] values require high ionization parameters powered by massive star clusters of $\gtrsim 10^5$-$10^6\,\mathrm{M}_\odot$, consistent with recent JWST observations. Reproducing the highest [NII]/H$\alpha$ ratios additionally requires enhanced nitrogen abundances. Although gas densities of $n \sim 10^4\,\mathrm{cm}^{-3}$ can boost several diagnostic ratios, they suppress [SII]/H$\alpha$ and are therefore in tension with current observations. Overall, models combining harder ionizing spectra, elevated ionization parameters from massive star clusters, and enhanced nitrogen abundances reproduce the observed high-$z$ galaxy population across the N2-BPT, S2-VO87, and O32-R23 diagrams. This successful model also motivates new demarcation lines for star-forming galaxies in the N2-BPT and S2-VO87 diagrams.
Figures




Forward citations
Cited by 3 Pith papers
-
RUBIES: The Evolution of the Ionization Parameter from 0 < z < 9
RUBIES JWST sample shows U increases with redshift and sSFR, decreases with mass, rising by a factor of ~4 from z=2 to z=6 at fixed mass and sSFR, with 0.3 dex systematic uncertainty from photoionization model range.
-
Stellar photoionisation modelling in SYNTHESIZER
Synthesizer now combines stellar population spectra with Cloudy photoionisation grids to predict nebular line and continuum emission for galaxies, with a systematic map of modelling choices.
-
RUBIES: The Evolution of the Ionization Parameter from 0 < z < 9
The ionization parameter inferred from O32 rises with redshift and sSFR, falls with stellar mass, and increases by ~4x from z=2 to z=6 at fixed mass and sSFR, with a ~0.3 dex model systematic.
Reference graph
Works this paper leans on
-
[1]
C., Shimizu I., Hirashita H., Todoroki K., Choi J
Abdurro’uf et al., 2025, arXiv:2512.08054 Adamo A., et al., 2024, Nature, 632, 513 Aoyama S., Hou K. C., Shimizu I., Hirashita H., Todoroki K., Choi J. H., Nagamine K., 2017, MNRAS, 466, 105 Arellano-Córdova K. Z., et al., 2025, MNRAS, 540, 2991 Asano R. S., Takeuchi T. T., Hirashita H., Inoue A. K., 2013, Earth, Planets and Space, 65, 213 Backhaus B. E.,...
arXiv 2025
discussion (0)
Sign in with ORCID, Apple, or X to comment. Anyone can read and Pith papers without signing in.