REVIEW 2 major objections 2 minor 2 cited by
The amount of early data needed for accurate subscription churn prediction depends on the specific cohort and target definition used.
Reviewed by Pith at T0; open to challenge. T0 means a machine referee read the full paper against a public rubric. the ladder, T0–T4 →
T0 review · grok-4.3
2026-07-02 16:24 UTC pith:DAMKNMON
load-bearing objection The paper shows observation-window sufficiency for churn prediction is design-dependent, with an inversion under a moving target on KKBox, but everything rests on one dataset. the 2 major comments →
How Early Is Early Enough? Design-Dependent Observation-Window Sufficiency in Subscription Churn Prediction
The pith
A machine-rendered reading of the paper's core claim, the machinery that carries it, and where it could break.
Core claim
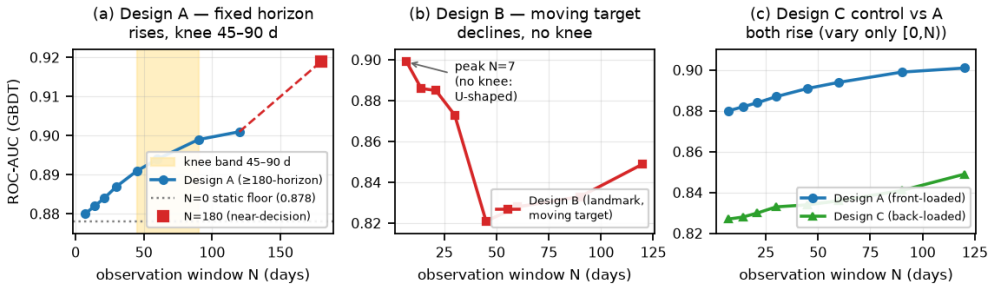
The nine-window sufficiency curve that plots prediction performance against observation-window length is singular to the cohort/task design being tested; in one design it shows a knee at 45-90 days while in a moving-target design the curve inverts and can shift with the feature set.
What carries the argument
The nine-window sufficiency curve tested across three cohort/task designs, which shows performance gains from longer early windows vary and can reverse depending on how the prediction task is constructed.
Load-bearing premise
The mechanism observed on the single KKBox music-streaming dataset generalizes in direction to other subscription services even if exact magnitudes differ.
What would settle it
Running the same three-design stress test on a second subscription dataset from a different service and finding that the sufficiency curve remains fixed across designs would falsify the claim.
If this is right
- In the manual-renewal segment, early behavior data raises PR by 0.10 at 120 days.
- Standard designs show diminishing returns after the 45-90 day band.
- Moving-target designs produce an inverted curve whose shape depends on the feature set.
- Any window-sufficiency claim must explicitly state its cohort construction, target definition, and feature families.
Where Pith is reading between the lines
- Practitioners should run design-stress tests on their own data rather than adopting a single observation-window length from published results.
- The design-dependency pattern may appear in other early-window prediction tasks such as fraud or retention models.
- Future experiments could measure how much the curve shifts when contract-status features are added or removed.
Editorial analysis
A structured set of objections, weighed in public.
Referee Report
Summary. The paper examines how many days of early behavior suffice for subscription churn prediction on the public KKBox music-streaming dataset. It reports that an indicator of contract status is typically the early churn signal, but in the manual-renewal segment early behavior yields a PR increase of +0.10 at 120 days, with a nine-window sufficiency curve showing a diminishing-returns knee in the 45-90 day band. Stress-testing across three cohort/task designs demonstrates that the curve shape is design-dependent, including an inversion under a moving target that can further shift with feature sets. The authors conclude that any sufficiency claim must explicitly state its cohort construction, target definition, and feature families, while qualifying that all evidence is from one dataset and that the mechanism should generalize but magnitudes may differ.
Significance. If the empirical results hold, the work provides a concrete, reproducible demonstration that observation-window sufficiency claims in churn prediction are sensitive to experimental design choices even within a single public dataset, including the possibility of curve inversion. The use of multiple designs on KKBox and the explicit single-dataset caveat constitute strengths that could encourage more precise reporting of cohort, target, and feature choices in future studies.
major comments (2)
- [Abstract and results] Abstract and results: The reported PR +0.10 gain at 120 days in the manual-renewal segment and the curve inversion under the moving-target design are presented without error bars, confidence intervals, or statistical significance tests. This omission is load-bearing for the central design-dependence claim, as it leaves open whether the observed differences exceed sampling variability.
- [Experimental setup] Experimental setup: Full details on the implementation of the three cohort/task designs (including how the moving target is operationalized and how feature families are varied) are insufficient to support exact replication of the inversion result, which is central to the design-dependency conclusion.
minor comments (2)
- [Results] A summary table comparing the three designs, their target definitions, and key curve outcomes would improve readability and allow direct visual comparison of the design dependence.
- [Abstract] The abstract could name the three designs explicitly rather than referring only to 'three cohort/task designs' to make the variation clearer on first reading.
Simulated Author's Rebuttal
We thank the referee for the constructive feedback. We address the two major comments below and will revise the manuscript accordingly to improve clarity and reproducibility.
read point-by-point responses
-
Referee: [Abstract and results] Abstract and results: The reported PR +0.10 gain at 120 days in the manual-renewal segment and the curve inversion under the moving-target design are presented without error bars, confidence intervals, or statistical significance tests. This omission is load-bearing for the central design-dependence claim, as it leaves open whether the observed differences exceed sampling variability.
Authors: We agree that the absence of error bars or confidence intervals limits the strength of the design-dependence claim. In the revised version we will add bootstrap-derived 95% confidence intervals to the reported PR gains and to the sufficiency curves (both the standard and inverted cases) so that readers can assess whether the observed differences exceed sampling variability. revision: yes
-
Referee: [Experimental setup] Experimental setup: Full details on the implementation of the three cohort/task designs (including how the moving target is operationalized and how feature families are varied) are insufficient to support exact replication of the inversion result, which is central to the design-dependency conclusion.
Authors: We accept that the current description does not supply enough detail for exact replication of the inversion result. We will expand the experimental-setup section with explicit definitions of each cohort construction, the precise operationalization of the moving target (including label-construction windows and censoring rules), and the exact feature-family variants used in each design. revision: yes
Circularity Check
No significant circularity identified
full rationale
The paper is a purely empirical study that compares observation-window sufficiency curves across three cohort/task designs on the external public KKBox dataset. No equations, fitted parameters, or derivations are present that reduce any result to its own inputs by construction. The central claims rest on direct experimental variation within the dataset (including an observed inversion under a moving target), with explicit qualification that all evidence comes from one dataset and magnitudes may not generalize. No self-citations are load-bearing, no ansatzes are smuggled, and no uniqueness theorems or renamings of known results are invoked. This is a standard self-contained empirical comparison.
Axiom & Free-Parameter Ledger
axioms (1)
- domain assumption The KKBox dataset and its manual-renewal segment provide representative behavior for testing subscription churn prediction designs.
read the original abstract
How many days of early behavior suffice for subscription churn prediction? In the public KKBox dataset, the early indicator of churn is typically an indicator of someone's contract status; however, when looking in the heavily churned manual-renewal segment, having access to early behavior creates a substantial increase in prediction for that specific segment (PR +0.10 at 120 days). A nine-window sufficiency curve shows a diminishing-returns knee in a 45-90 day band. However, stress-testing over three cohort/task designs shows that this curve is singular to the design being tested; for example, in our test with a moving target, the curve inverts and can shift depending on the feature set used. Therefore, any window-sufficiency claim should state its cohort construction, target definition, and feature families. All evidence is from one music-streaming dataset; the mechanism should generalize but the magnitudes may not.
Figures
Forward citations
Cited by 2 Pith papers
-
When Should Active RAG Retrieve? A Budget-Aware Evaluation of Utility, Calibration, and Cost
Active RAG evaluation should be budget-aware: report exact and deployable frontiers, realized usage, harm rates, and cost decompositions instead of single-point accuracy.
-
Toward User-Conditioned Evaluation of Personal LLM Agents under Temporal Interventions
No existing agent benchmark protocol replays a fixed temporal change across varied persistent user states while measuring cross-component failure propagation, creating a concrete design gap for personal-agent evaluation.
Reference graph
Works this paper leans on
-
[1]
Customer event history for churn prediction: How long is long enough?
M. Ballings and D. Van den Poel, “Customer event history for churn prediction: How long is long enough?”Expert Syst. Appl., vol. 39, no. 18, pp. 13517–13522, 2012
work page 2012
-
[2]
H. Apaydın and P. T ¨ufekci, “The effect of the length of the customer event history and the staying power of the predictive models in customer churn prediction: A case study of Migros Sanal Market,”Acad. Platform J. Eng. Sci., vol. 6, no. 3, pp. 1–10, 2018
work page 2018
-
[3]
Rapid Prediction of Player Retention in Free-to-Play Mobile Games
A. Drachen et al., “Rapid prediction of player retention in free-to-play mobile games,” inProc. AAAI Conf. Artif. Intell. Interactive Digital Entertainment (AIIDE), 2016, arXiv:1607.03202
work page internal anchor Pith review Pith/arXiv arXiv 2016
-
[4]
Finding a ‘kneedle’ in a haystack: Detecting knee points in system behavior,
V . Satop¨a¨a, J. Albrecht, D. Irwin, and B. Raghavan, “Finding a ‘kneedle’ in a haystack: Detecting knee points in system behavior,” inProc. 31st Int. Conf. Distrib. Comput. Syst. Workshops (ICDCSW), 2011, pp. 166– 171
work page 2011
-
[5]
Churn prediction for high- value players in casual social games,
J. Runge, P. Gao, F. Garcin, and B. Faltings, “Churn prediction for high- value players in casual social games,” inProc. IEEE Conf. Comput. Intell. Games (CIG), 2014, pp. 1–8
work page 2014
-
[6]
Predicting player churn in the wild,
F. Hadiji, R. Sifa, A. Drachen, C. Thurau, K. Kersting, and C. Bauck- hage, “Predicting player churn in the wild,” inProc. IEEE Conf. Comput. Intell. Games (CIG), 2014, pp. 1–8
work page 2014
-
[7]
Early churn prediction from large scale user-product interaction time series,
S. Bhattacharjee, U. Thukral, and N. Patil, “Early churn prediction from large scale user-product interaction time series,” inProc. IEEE Int. Conf. Mach. Learn. Appl. (ICMLA), 2023, pp. 2079–2086, arXiv:2309.14390
-
[8]
KKBox churn prediction challenge,
WSDM Cup 2018, “KKBox churn prediction challenge,” 2018. [Online]. Available: https://wsdm-cup-2018.kkbox.events/
work page 2018
-
[9]
M. R. Khan, J. Manoj, A. Singh, and J. Blumenstock, “Behavioral modeling for churn prediction: Early indicators and accurate predictors of customer defection and loyalty,” inProc. IEEE Int. Congr. Big Data (BigDataCongress), 2015, arXiv:1512.06430
work page internal anchor Pith review Pith/arXiv arXiv 2015
-
[10]
M. Imani, M. Joudaki, A. Beikmohammadi, and H. R. Arabnia, “Cus- tomer churn prediction: A systematic review of recent advances, trends, and challenges in machine learning and deep learning,”Mach. Learn. Knowl. Extr., vol. 7, no. 3, art. 105, 2025
work page 2025
-
[11]
LightGBM: A highly efficient gradient boosting decision tree,
G. Ke et al., “LightGBM: A highly efficient gradient boosting decision tree,” inProc. NeurIPS, 2017, pp. 3149–3157
work page 2017
-
[12]
Dynamic prediction by landmarking in event history analysis,
H. C. van Houwelingen, “Dynamic prediction by landmarking in event history analysis,”Scand. J. Statist., vol. 34, no. 1, pp. 70–85, 2007
work page 2007
-
[13]
A proportional hazards model for the subdistribution of a competing risk,
J. P. Fine and R. J. Gray, “A proportional hazards model for the subdistribution of a competing risk,”J. Amer. Statist. Assoc., vol. 94, no. 446, pp. 496–509, 1999
work page 1999
-
[14]
Approximate statistical tests for comparing supervised classification learning algorithms,
T. G. Dietterich, “Approximate statistical tests for comparing supervised classification learning algorithms,”Neural Comput., vol. 10, no. 7, pp. 1895–1923, 1998
work page 1923
-
[15]
Inference for the generalization error,
C. Nadeau and Y . Bengio, “Inference for the generalization error,”Mach. Learn., vol. 52, no. 3, pp. 239–281, 2003
work page 2003
-
[16]
B. Shen, L. Jin, H. Cai, L. Hu, and Y . Xin, “The efficiency frontier: A unified framework for cost-performance optimization in LLM context management,”arXiv preprint arXiv:2605.23071, 2026
work page internal anchor Pith review Pith/arXiv arXiv 2026
discussion (0)
Sign in with ORCID, Apple, or X to comment. Anyone can read and Pith papers without signing in.