REVIEW 2 major objections 6 minor 1 cited by
A new code predicts which ultra-cool dwarfs will be mistaken for high-redshift galaxies, and finds that T to early-Y types most often fake z~8 galaxies near survey limits.
Reviewed by Pith at T0; open to challenge. T0 means a machine referee read the full paper against a public rubric. the ladder, T0–T4 →
2026-07-12 08:08 UTC pith:AUCQ57QT
load-bearing objection Practical public code that correctly ranks a confirmed BoRG contaminant field and maps z~8 UCD contamination across HST/Roman/JWST; absolute rates stay model-dependent by factors of several, as the authors state. the 2 major comments →
Assessing Ultra-Cool Dwarf Contamination in Photometrically Selected High-Redshift Galaxy Samples
The pith
A machine-rendered reading of the paper's core claim, the machinery that carries it, and where it could break.
Core claim
The authors claim that FC-ENZO, by injecting synthetic ultra-cool dwarfs drawn from current atmosphere libraries into user-specified photometric-redshift and color-color cuts, can predict both the absolute number and the spectral-type mix of stellar contaminants in high-redshift samples; under their fiducial setup the dominant contaminants are T to early-Y dwarfs that most often pass z~8 selections, and the contamination concentrates near each survey's limiting magnitude.
What carries the argument
FC-ENZO: a four-step pipeline that (1) shifts synthetic UCD SEDs to magnitude bins, (2) measures the fraction that satisfy a given galaxy selection, (3) multiplies by a Galactic number-density model, and (4) reports expected contaminants per field and magnitude.
Load-bearing premise
The absolute contaminant counts rest on the adopted Galactic thin/thick-disk and halo density model; swapping two published models changes the predicted rates by factors of five to seven in typical extragalactic fields.
What would settle it
Spectroscopic follow-up of a statistically complete set of z~8 photometric candidates in fields spanning a range of predicted FC-ENZO contamination rates would either recover the forecasted number of T/Y dwarfs or show a clear mismatch.
If this is right
- Fields ranked highest by FC-ENZO can be de-prioritized for scarce spectroscopic time or targeted for extra morphological checks.
- Luminosity-function measurements at the bright end of z~8 must include a magnitude-dependent UCD correction, especially for HST-depth surveys.
- Roman deep-tier planning can use the same machinery to choose fields and filter combinations that keep bright-end contamination low.
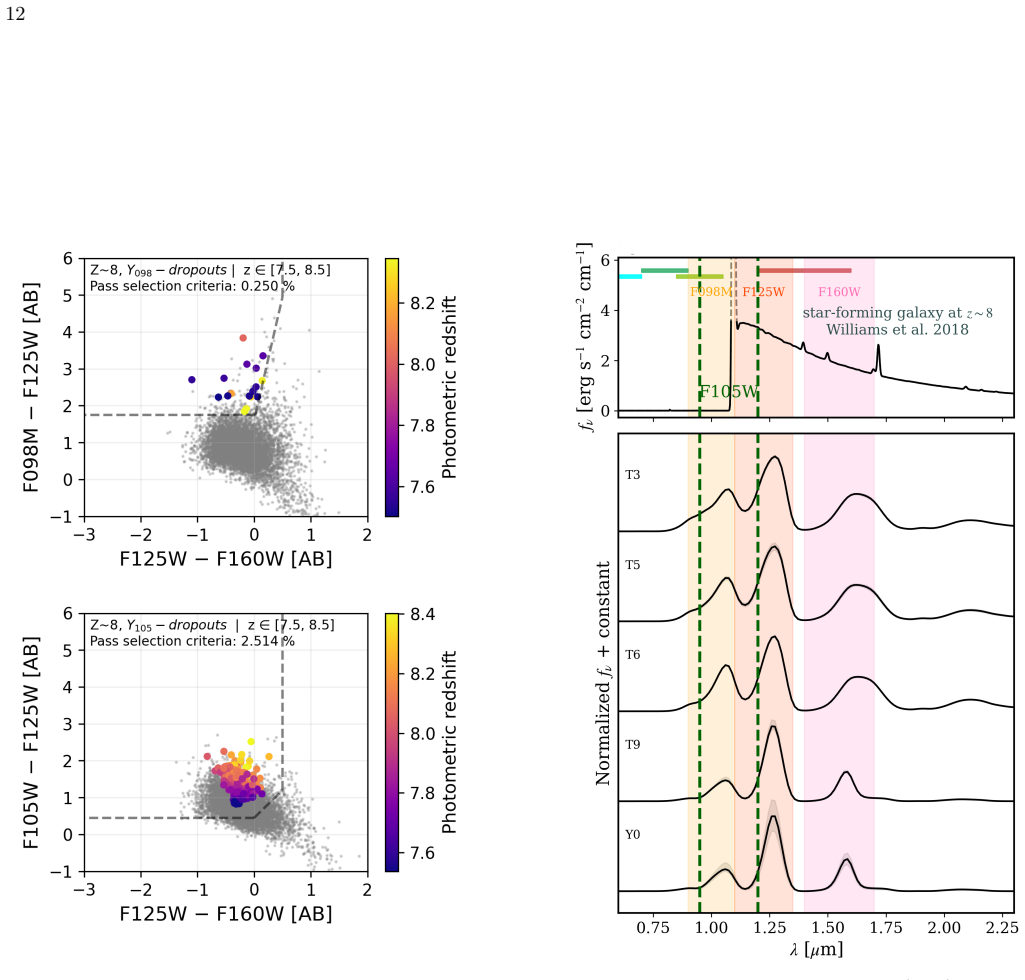
- F098M-style dropouts suppress more UCD interlopers than F105W-style dropouts for HST z~8 samples.
- Deeper JWST imaging keeps UCD contamination well below the galaxy luminosity function even after completeness correction.
Where Pith is reading between the lines
- Because absolute rates depend so strongly on the Galactic density model, future Gaia or JWST proper-motion censuses of faint T/Y dwarfs would immediately tighten every FC-ENZO prediction.
- The same pipeline can be re-run with any new atmosphere grid that includes clouds or non-solar C/O ratios, turning FC-ENZO into a living test of brown-dwarf atmosphere physics.
- Clustering analyses that currently treat all photometric high-z candidates as galaxies will systematically under-estimate bias if the brightest bins contain the predicted UCD fraction.
Editorial analysis
A structured set of objections, weighed in public.
Referee Report
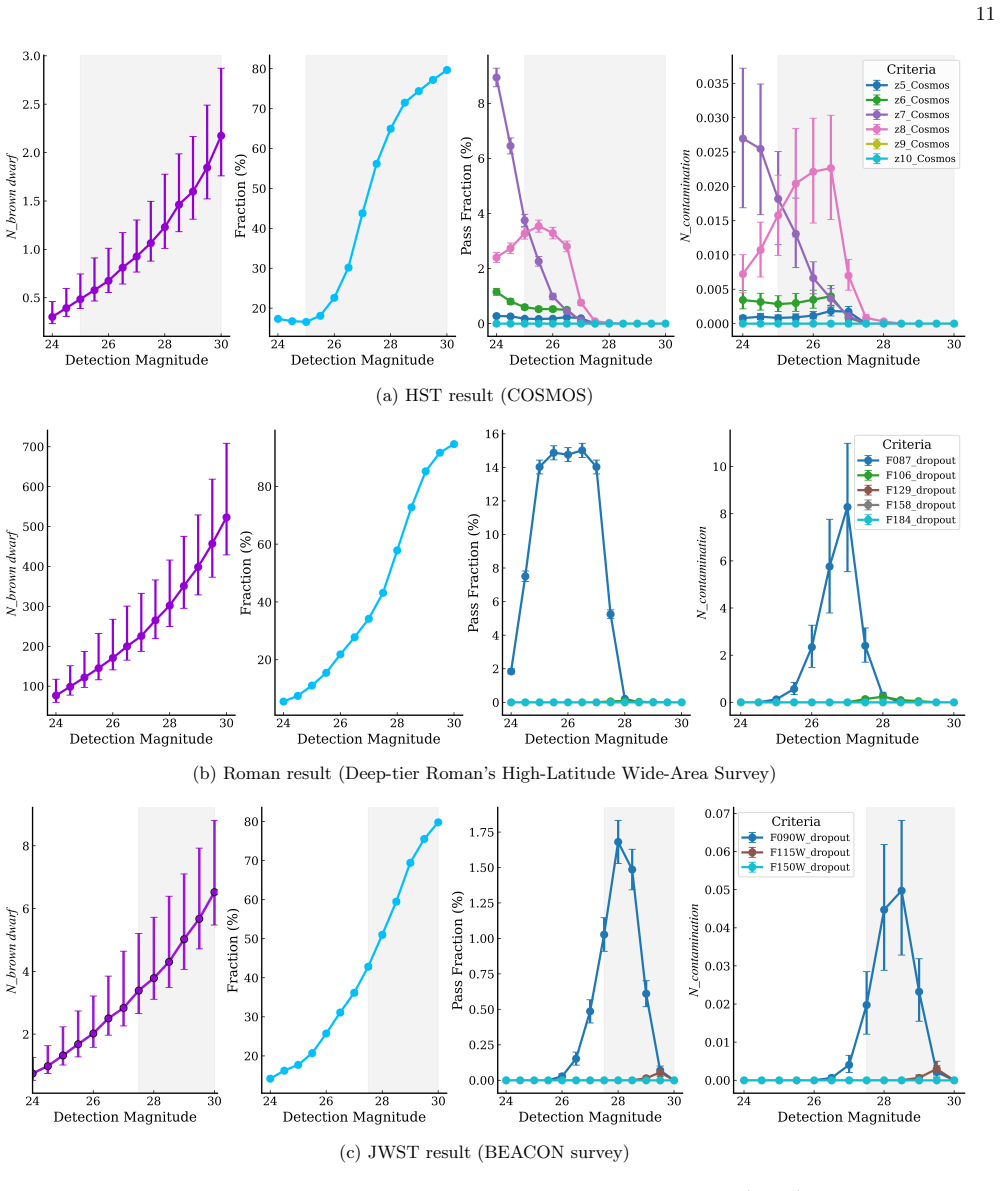
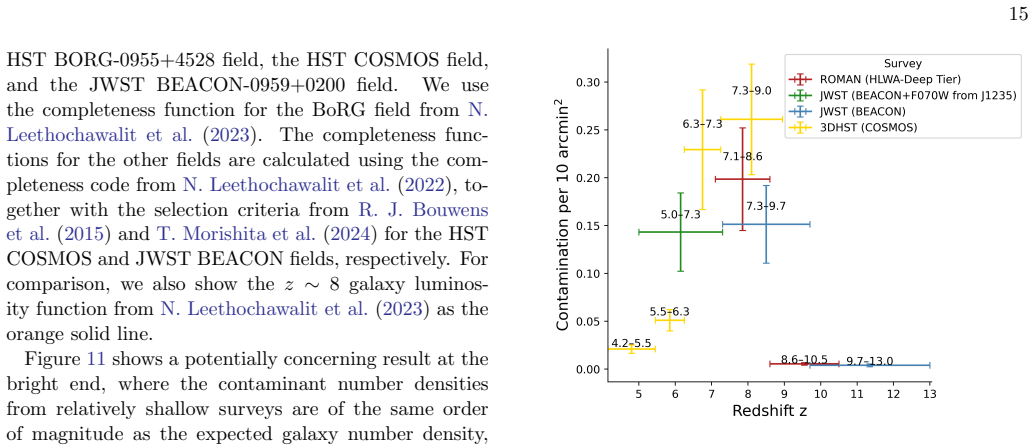
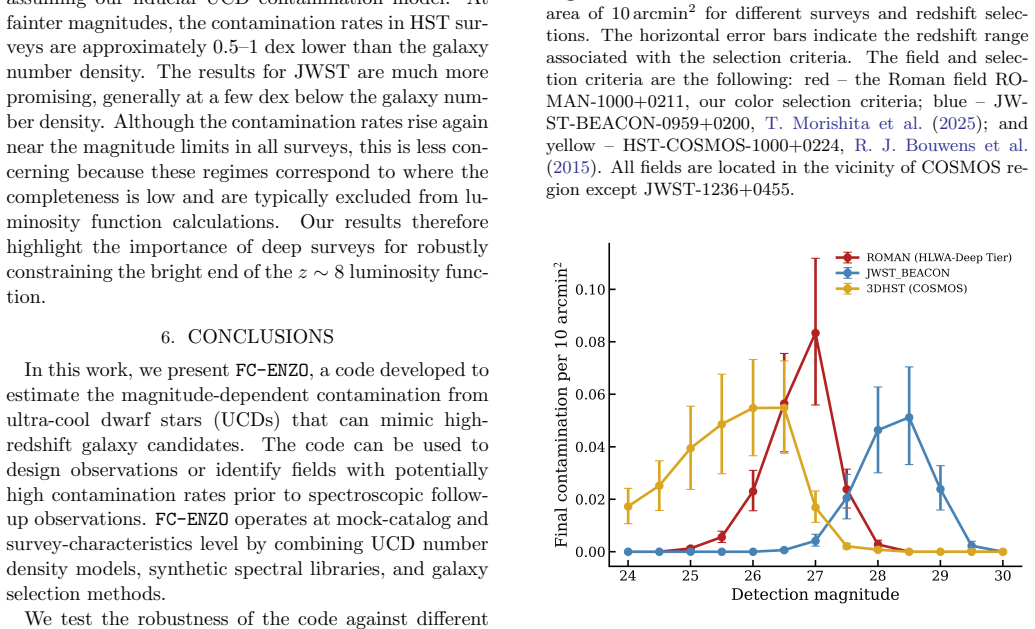
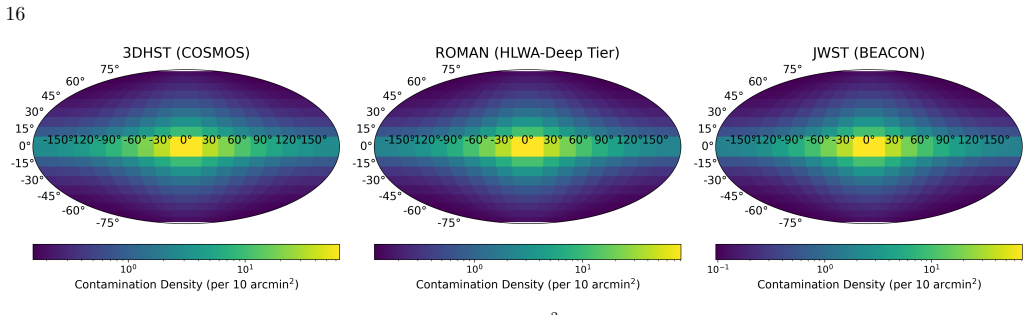
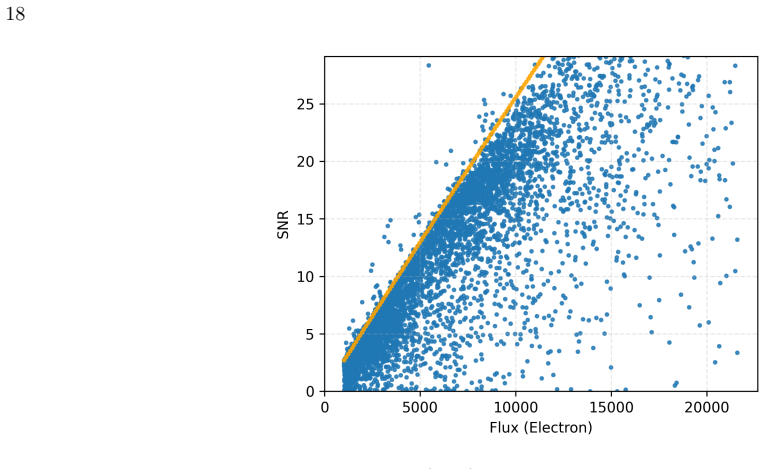
Summary. The paper introduces FC-ENZO, a catalog-level tool that combines UCD number-density models (primarily Aganze et al. 2022b), synthetic atmosphere libraries (Elf Owl fiducial; Bobcat comparison), Poisson noise from survey header parameters, and user-specified color/photo-z selection to predict the number of ultra-cool dwarfs misclassified as high-redshift galaxies. Applied to BoRG follow-up fields, COSMOS-like HST depths, Roman deep-tier HLWAS, and JWST BEACON, the main results are that T to early-Y dwarfs dominate contamination, that z∼8 is the most vulnerable redshift regardless of telescope, that area-normalized contamination levels are similar across deep HST/Roman/JWST surveys but concentrate near each survey’s limiting magnitude, and that bright-end relative contamination ranks HST > Roman > JWST. Absolute rates are shown to vary by factors of several with metallicity, atmosphere grid, and especially the stellar density model.
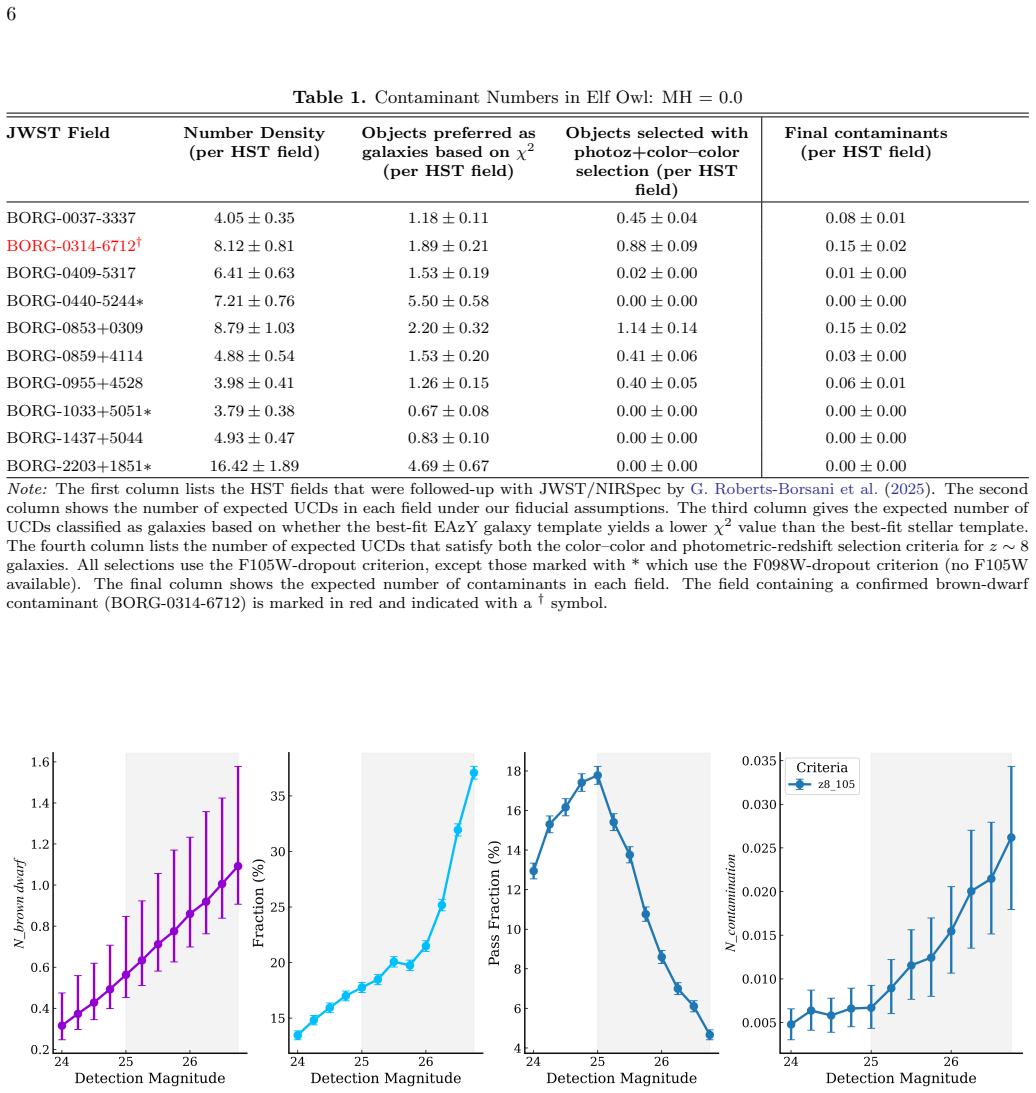
Significance. If the relative rankings and redshift dependence hold, the work is a practical contribution to survey design, field prioritization for spectroscopy, and statistical contamination accounting in luminosity-function and clustering analyses at the bright end of z∼7–9 samples. Strengths include a transparent, reproducible pipeline; public code; explicit recovery of the spectroscopically confirmed T2 contaminant field (BORG-0314-6712) as highest-risk among the ten BoRG follow-ups (Table 1); and systematic sensitivity tests across atmosphere grids, metallicity, and two density models. The comparison across HST, Roman, and JWST under consistent methodology is timely for Roman planning and for interpreting existing JWST high-z samples.
major comments (2)
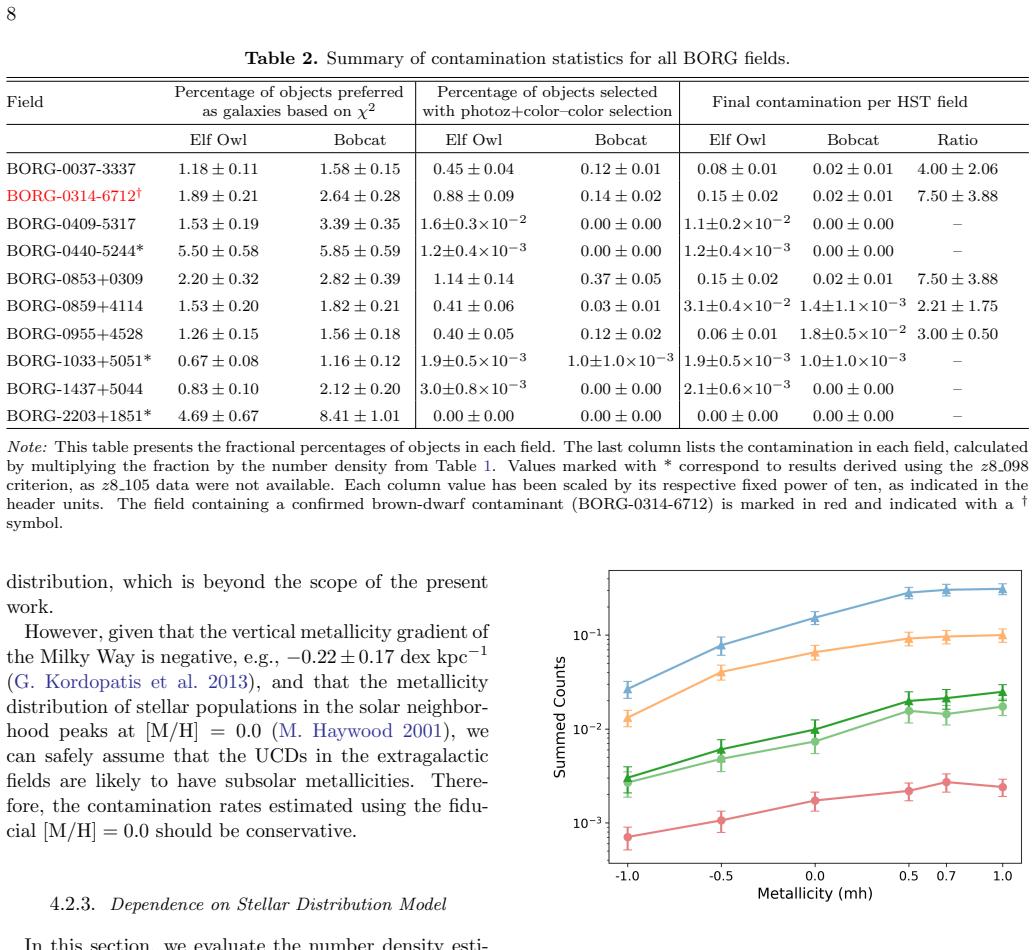
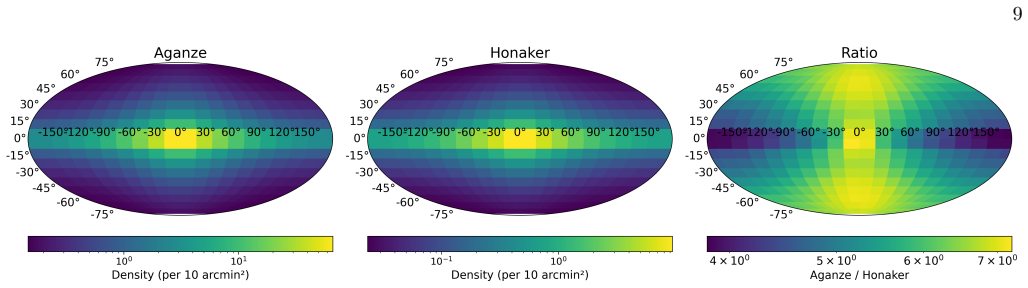
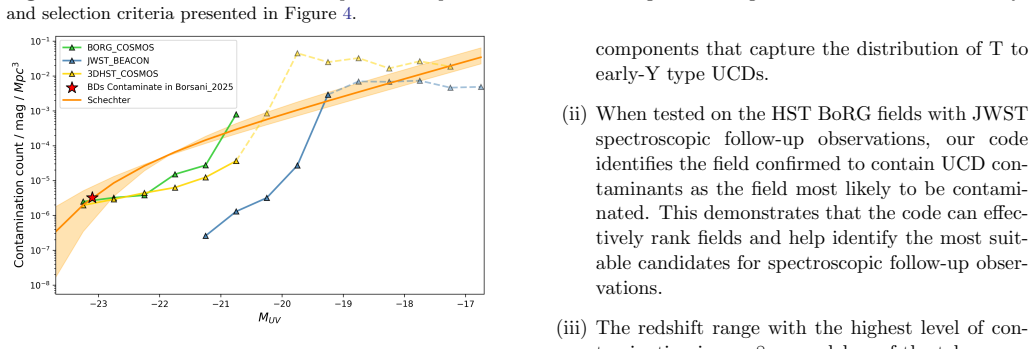
- §4.2.3 and Fig. 3: swapping Aganze et al. (2022b) for Honaker & Gizis (2025) changes predicted extragalactic contamination by factors of ∼5–7, driven by thin-disk scale heights. Fig. 11 then converts the fiducial rates into LF units and compares them to the z∼8 galaxy LF, including a statement that shallow-survey bright-end contamination can be comparable to the galaxy density. Because absolute rates are this model-dependent, the LF comparison should be presented strictly as illustrative under the fiducial density model (or shown for both models), and the abstract/conclusions should more explicitly separate robust relative rankings from absolute numbers used for LF correction.
- §2.1: radii used to scale Elf Owl surface fluxes are interpolated from Sonora Bobcat evolutionary tracks. The paper does not quantify how radius differences between the two model generations affect absolute fluxes, distance limits (dmin/dmax in §3.4), or final contaminant counts. A short test (e.g., fixed-radius vs Bobcat radii, or available Elf Owl/Bobcat radius comparisons at shared Teff–log g) is needed to show that this hybrid choice does not systematically bias the magnitude-dependent rates that feed Figs. 9–11.
minor comments (6)
- Abstract and §5.3: “similar overall contamination levels” should state the normalization (per equal area / per pointing) more clearly, since raw per-field numbers differ by FoV.
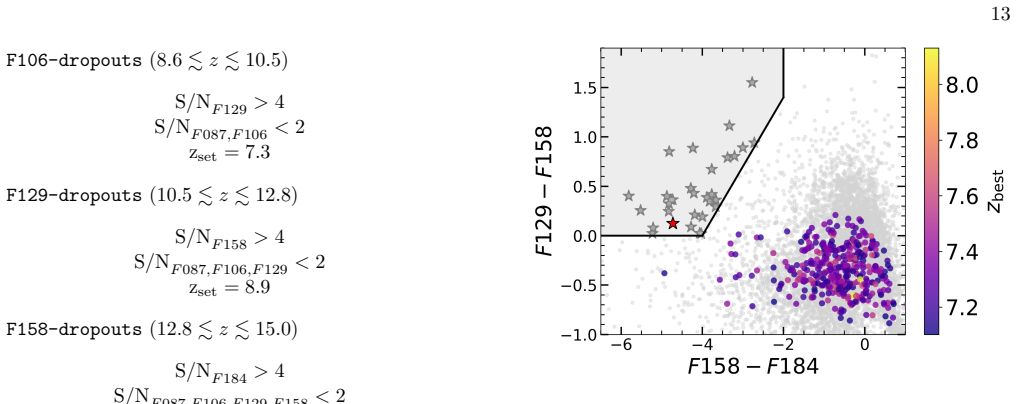
- Fig. 4 caption and panels: detection magnitudes are F160W / F158 / F444W; a single sentence in the main text noting that the x-axes are not identical rest-frame quantities would reduce misreading when comparing telescopes.
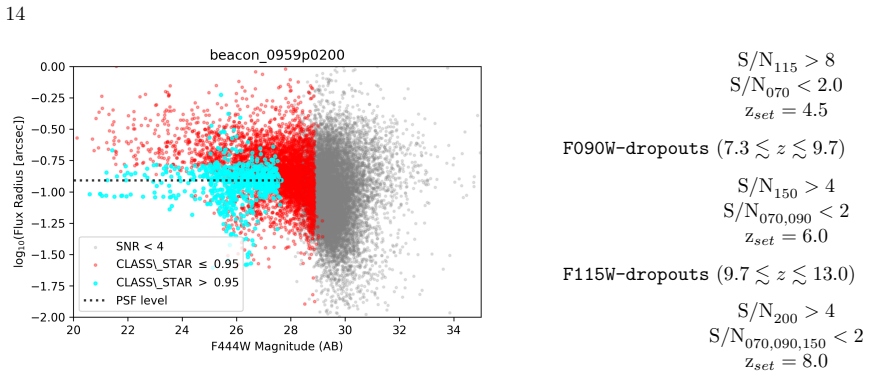
- §3.3 / morphology: the catalog-level assumption that point and extended sources are indistinguishable is justified for faint HST, but for JWST (§5.2) the CLASS STAR discussion (Fig. 7) could be tied more explicitly to which magnitude bins enter the final contaminant totals.
- Typos / wording: “Specfically” (§3.4); “distinguieshed” (§3.3); “Figur 4b” (§5.1); “ultra-compact dwarfs” once in §5.1 should be ultra-cool; “Nancy Roman Grace Telescopes” in the introduction should be Nancy Grace Roman Space Telescope.
- Table 2 header says “fractional percentages” while values appear to be number densities or fractions consistent with Table 1; clarify units so the Elf Owl/Bobcat ratio column is unambiguous.
- GitHub link is mentioned but not given as a stable DOI/archive citation; for reproducibility, a Zenodo (or equivalent) release of FC-ENZO at submission would strengthen the paper.
Circularity Check
No circularity: contamination rates are products of external SED libraries and external density models under user-specified cuts; self-citations supply survey setups only.
full rationale
FC-ENZO multiplies two independent pieces: (i) the fraction of synthetic UCDs (Elf Owl or Bobcat atmospheres, radii from Bobcat tracks, spectral types from Kirkpatrick et al. 2021) that pass a user-supplied color/photo-z/χ² selection, and (ii) the absolute number density obtained by integrating an external Galactic model (Aganze et al. 2022b or Honaker & Gizis 2025) along the line of sight (Eq. 1). Neither piece is fitted to the high-z samples under study, nor is either defined in terms of the other. The paper explicitly varies both libraries and both density models and reports the resulting factor-of-several changes (§4.2), so the absolute rates are not forced by construction. Self-citations (Morishita, Leethochawalit, Trenti) appear only for survey depths, completeness functions, and the particular color/photo-z cuts being tested; they do not supply the UCD SEDs, the density model, or a uniqueness claim that closes a logical loop. Validation on the spectroscopically confirmed BoRG contaminant field is an external check, not a fit. Consequently the central claims (T/early-Y dominance, z~8 peak, area-normalized similarity across telescopes with magnitude concentration near each survey limit) rest on independent inputs and contain no self-definitional, fitted-as-prediction, or load-bearing self-citation circularity.
Axiom & Free-Parameter Ledger
free parameters (3)
- thin-disk scale heights H(SpT) =
249/153/175 pc (Aganze) vs ~113–124 pc (Honaker)
- local space densities ρ⊙(SpT)
- metallicity [M/H] =
0.0 (fiducial)
axioms (3)
- domain assumption UCD surface fluxes can be scaled by (R/D)^2 using radii interpolated from Bobcat evolutionary tracks even when Elf Owl atmospheres are used.
- domain assumption At the magnitudes of interest (m ≳ 25–27), point sources and compact galaxies are morphologically indistinguishable, so CLASS_STAR is omitted.
- domain assumption The Jurić et al. (2008) thin/thick/halo functional form with Aganze or Honaker parameters correctly describes the line-of-sight density of late-T/Y dwarfs.
invented entities (1)
-
FC-ENZO code
independent evidence
Cite this review
Pith. "Pith review of Assessing Ultra-Cool Dwarf Contamination in Photometrically Selected High-Redshift Galaxy Samples." pith.science (2026). https://pith.science/paper/AUCQ57QT
@misc{pith2026260702354,
  author       = {Pith},
  title        = {Pith review of: Assessing Ultra-Cool Dwarf Contamination in Photometrically Selected High-Redshift Galaxy Samples},
  year         = {2026},
  howpublished = {\url{https://pith.science/paper/AUCQ57QT}},
  note         = {Machine review of arXiv:2607.02354}
}
read the original abstract
Ultra-cool dwarf stars (UCDs) are a common source of contamination in high-redshift galaxy searches as both sources are red and these early-forming galaxies can have sizes that are difficult to resolve even with space telescopes. Standard selection techniques, including photometric redshift estimation and color-color criteria, cannot fully eliminate this contamination. We develop \textbf{F}oreground \textbf{C}ontamination \textbf{E}valuator of \textbf{N}earby dwarf stars in high-\textbf{Z} photometrically selected \textbf{O}bjects (FC-ENZO), a code that predicts the number of dwarf stars misidentified as high-redshift galaxies for a given survey setup. FC-ENZO models the number of UCDs and evaluates the fraction of synthesized dwarf stars that passes user-specified selection methods. We compare two synthetic spectral energy distribution libraries and find that the ELF OWL library, which relaxes the assumption of chemical equilibrium, predicts larger contaminant fractions than the BOBCAT library, because of stronger absorption features around $ 1 $ \micron. The contamination fraction increases with metallicity and also depends on the adopted stellar number-density model. The dominant contaminants are T to early Y-type UCDs, which are most commonly misclassified as galaxies at $z \sim 8$. Comparing deep surveys from different space telescopes, we find similar overall contamination levels within the same redshift range. However, the contamination is concentrated near the limiting magnitude of each survey. At brighter magnitudes, the relative contamination is highest for HST (COSMOS), followed by Roman deep-tier survey, and JWST. Although the predicted contaminant numbers remain sensitive to model assumptions, FC-ENZO provides a practical tool for survey design and for identifying optimal fields for spectroscopic follow-up.
Figures
Forward citations
Cited by 1 Pith paper
-
A Type Ia Supernova Candidate at $z\sim4.3$: A Transient Interloper in the Search for $z\sim14$ Galaxies
A JWST candidate z~14 galaxy is reclassified as a Type Ia supernova at z~4.3, implying SN Ia minimum delay times shorter than 1 Gyr.
Reference graph
Works this paper leans on
-
[1]
Aganze, C., Burgasser, A. J., Malkan, M., et al. 2022a, ApJ, 924, 114, doi: 10.3847/1538-4357/ac35ea
-
[2]
Aganze, C., Burgasser, A. J., Malkan, M., et al. 2022b, ApJ, 934, 73, doi: 10.3847/1538-4357/ac7053
-
[3]
Bagley, M. B., Finkelstein, S. L., Rhoads, J., et al. 2026, arXiv e-prints, arXiv:2603.09828, doi: 10.48550/arXiv.2603.09828
-
[4]
1996, A&AS, 117, 393, doi: 10.1051/aas:1996164
Bertin, E., & Arnouts, S. 1996, A&AS, 117, 393, doi: 10.1051/aas:1996164
-
[5]
2019, MNRAS, 486, 1167, doi: 10.1093/mnras/stz217
Bland-Hawthorn, J., Sharma, S., Tepper-Garcia, T., et al. 2019, MNRAS, 486, 1167, doi: 10.1093/mnras/stz217
-
[6]
Bouwens, R. J., Illingworth, G. D., Oesch, P. A., et al. 2011, ApJ, 737, 90, doi: 10.1088/0004-637X/737/2/90
-
[7]
Bouwens, R. J., Illingworth, G. D., Oesch, P. A., et al. 2015, ApJ, 803, 34, doi: 10.1088/0004-637X/803/1/34
-
[8]
Bowler, R. A. A., Dunlop, J. S., McLure, R. J., et al. 2012, MNRAS, 426, 2772, doi: 10.1111/j.1365-2966.2012.21904.x
-
[9]
Bowler, R. A. A., Dunlop, J. S., McLure, R. J., et al. 2015, MNRAS, 452, 1817, doi: 10.1093/mnras/stv1403
-
[10]
Brammer, G. B., van Dokkum, P. G., & Coppi, P. 2008, ApJ, 686, 1503, doi: 10.1086/591786 19
doi:10.1086/591786 2008
-
[11]
Burgasser, A. J. 2014, in Astronomical Society of India Conference Series, Vol. 11, Astronomical Society of India Conference Series, 7–16, doi: 10.48550/arXiv.1406.4887
-
[12]
Caballero, J. A., Burgasser, A. J., & Klement, R. 2008, A&A, 488, 181, doi: 10.1051/0004-6361:200809520 Carnero Rosell, A., Santiago, B., dal Ponte, M., et al. 2019, MNRAS, 489, 5301, doi: 10.1093/mnras/stz2398
-
[13]
Casey, C. M., Kartaltepe, J. S., Drakos, N. E., et al. 2023, ApJ, 954, 31, doi: 10.3847/1538-4357/acc2bc
-
[14]
Chen, B., Stoughton, C., Smith, J. A., et al. 2001, ApJ, 553, 184, doi: 10.1086/320647
doi:10.1086/320647 2001
-
[15]
1997, ApJ, 477, 765, doi: 10.1086/303726
Chiappini, C., Matteucci, F., & Gratton, R. 1997, ApJ, 477, 765, doi: 10.1086/303726
doi:10.1086/303726 1997
-
[16]
Conroy, C., Naidu, R. P., Zaritsky, D., et al. 2019, ApJ, 887, 237, doi: 10.3847/1538-4357/ab5710
-
[17]
2024a, MNRAS, 533, 2391, doi: 10.1093/mnras/stae2006
Dalmasso, N., Leethochawalit, N., Trenti, M., & Boyett, K. 2024a, MNRAS, 533, 2391, doi: 10.1093/mnras/stae2006
-
[18]
2024b, MNRAS, 528, 898, doi: 10.1093/mnras/stad3901
Dalmasso, N., Trenti, M., & Leethochawalit, N. 2024b, MNRAS, 528, 898, doi: 10.1093/mnras/stad3901
-
[19]
Dietz, S. E., Yoon, J., Beers, T. C., & Placco, V. M. 2020, ApJ, 894, 34, doi: 10.3847/1538-4357/ab7fa4
-
[20]
2013, NewAR, 57, 80, doi: 10.1016/j.newar.2013.06.001
Feltzing, S., & Chiba, M. 2013, NewAR, 57, 80, doi: 10.1016/j.newar.2013.06.001
-
[21]
Finkelstein, S. L., Ryan, Jr., R. E., Papovich, C., et al. 2015, ApJ, 810, 71, doi: 10.1088/0004-637X/810/1/71
-
[22]
L., Bagley, M., Song, M., et al
Finkelstein, S. L., Bagley, M., Song, M., et al. 2022, ApJ, 928, 52, doi: 10.3847/1538-4357/ac3aed
-
[23]
Finkelstein, S. L., Bagley, M. B., Ferguson, H. C., et al. 2023, ApJL, 946, L13, doi: 10.3847/2041-8213/acade4
-
[24]
Finkelstein, S. L., Leung, G. C. K., Bagley, M. B., et al. 2024, ApJL, 969, L2, doi: 10.3847/2041-8213/ad4495
-
[25]
Franco, M., Casey, C. M., Akins, H. B., et al. 2025, arXiv e-prints, arXiv:2508.04791, doi: 10.48550/arXiv.2508.04791
-
[26]
Geballe, T. R., Knapp, G. R., Leggett, S. K., et al. 2002, ApJ, 564, 466, doi: 10.1086/324078
doi:10.1086/324078 2002
-
[27]
2009, ApJ, 692, 1075, doi: 10.1088/0004-637X/692/2/1075
Gillessen, S., Eisenhauer, F., Trippe, S., et al. 2009, ApJ, 692, 1075, doi: 10.1088/0004-637X/692/2/1075
-
[28]
Grogin, N. A., Kocevski, D. D., Faber, S. M., et al. 2011, ApJS, 197, 35, doi: 10.1088/0067-0049/197/2/35
-
[30]
Hainline, K. N., Johnson, B. D., Robertson, B., et al. 2024b, ApJ, 964, 71, doi: 10.3847/1538-4357/ad1ee4
-
[31]
Hainline, K. N., Helton, J. M., Johnson, B. D., et al. 2024c, ApJ, 964, 66, doi: 10.3847/1538-4357/ad20d1
-
[32]
2024, ApJ, 960, 56, doi: 10.3847/1538-4357/ad0b7e
Harikane, Y., Nakajima, K., Ouchi, M., et al. 2024, ApJ, 960, 56, doi: 10.3847/1538-4357/ad0b7e
-
[33]
2016, ApJ, 821, 123, doi: 10.3847/0004-637X/821/2/123
Harikane, Y., Ouchi, M., Ono, Y., et al. 2016, ApJ, 821, 123, doi: 10.3847/0004-637X/821/2/123
-
[34]
2001, MNRAS, 325, 1365, doi: 10.1046/j.1365-8711.2001.04510.x
Haywood, M. 2001, MNRAS, 325, 1365, doi: 10.1046/j.1365-8711.2001.04510.x
-
[35]
Heintz, K. E., Brammer, G. B., Watson, D., et al. 2025, A&A, 693, A60, doi: 10.1051/0004-6361/202450243
-
[36]
Honaker, E. J., & Gizis, J. E. 2025, ApJ, 985, 48, doi: 10.3847/1538-4357/adc689 Juri´ c, M., Ivezi´ c,ˇZ., Brooks, A., et al. 2008, ApJ, 673, 864, doi: 10.1086/523619
-
[37]
Kakazu, Y., Hu, E. M., Liu, M. C., et al. 2010, ApJ, 723, 184, doi: 10.1088/0004-637X/723/1/184
-
[38]
Kirkpatrick, J. D. 2005, ARA&A, 43, 195, doi: 10.1146/annurev.astro.42.053102.134017
-
[39]
Kirkpatrick, J. D., Gelino, C. R., Faherty, J. K., et al. 2021, ApJS, 253, 7, doi: 10.3847/1538-4365/abd107
-
[40]
Koekemoer, A. M., Faber, S. M., Ferguson, H. C., et al. 2011, ApJS, 197, 36, doi: 10.1088/0067-0049/197/2/36
-
[41]
Kordopatis, G., Gilmore, G., Wyse, R. F. G., et al. 2013, MNRAS, 436, 3231, doi: 10.1093/mnras/stt1804
-
[42]
Kreilgaard, K. C., Mason, C. A., Morishita, T., et al. 2026, arXiv e-prints, arXiv:2604.17963, doi: 10.48550/arXiv.2604.17963
-
[43]
2023, ApJ, 950, 8, doi: 10.3847/1538-4357/acc8cb
Lacy, B., & Burrows, A. 2023, ApJ, 950, 8, doi: 10.3847/1538-4357/acc8cb
-
[44]
Lee, Y. S., Beers, T. C., Kim, Y. K., et al. 2017, ApJ, 836, 91, doi: 10.3847/1538-4357/836/1/91
-
[45]
2026, ApJ, 998, 217, doi: 10.3847/1538-4357/ae374b
Trenti, M. 2026, ApJ, 998, 217, doi: 10.3847/1538-4357/ae374b
-
[46]
2023, MNRAS, 524, 5454, doi: 10.1093/mnras/stad2202
Trenti, M., & Treu, T. 2023, MNRAS, 524, 5454, doi: 10.1093/mnras/stad2202
-
[47]
2022, MNRAS, 509, 5836, doi: 10.1093/mnras/stab3265
Roberts-Borsani, G., & Treu, T. 2022, MNRAS, 509, 5836, doi: 10.1093/mnras/stab3265
-
[48]
Marley, M., Saumon, D., Morley, C., et al. 2021, Sonora Bobcat: cloud-free, substellar atmosphere models, spectra, photometry, evolution, and chemistry, Sonora Bobcat Zenodo, doi: 10.5281/zenodo.5063476
-
[49]
S., Saumon, D., Visscher, C., et al
Marley, M. S., Saumon, D., Visscher, C., et al. 2021, ApJ, 920, 85, doi: 10.3847/1538-4357/ac141d
-
[50]
Masters, D., McCarthy, P., Burgasser, A. J., et al. 2012, ApJL, 752, L14, doi: 10.1088/2041-8205/752/1/L14
-
[51]
2024, MNRAS, 527, 583, doi: 10.1093/mnras/stad2952
Mazzi, A., Girardi, L., Trabucchi, M., et al. 2024, MNRAS, 527, 583, doi: 10.1093/mnras/stad2952
-
[52]
McLure, R. J., Dunlop, J. S., Bowler, R. A. A., et al. 2013, MNRAS, 432, 2696, doi: 10.1093/mnras/stt627
-
[53]
2021, ApJS, 253, 4, doi: 10.3847/1538-4365/abce67
Morishita, T. 2021, ApJS, 253, 4, doi: 10.3847/1538-4365/abce67
-
[54]
2018, ApJ, 867, 150, doi: 10.3847/1538-4357/aae68c 20
Morishita, T., Trenti, M., Stiavelli, M., et al. 2018, ApJ, 867, 150, doi: 10.3847/1538-4357/aae68c 20
-
[55]
2020, ApJ, 904, 50, doi: 10.3847/1538-4357/abba83
Morishita, T., Stiavelli, M., Trenti, M., et al. 2020, ApJ, 904, 50, doi: 10.3847/1538-4357/abba83
-
[56]
2024, ApJ, 963, 9, doi: 10.3847/1538-4357/ad1404
Morishita, T., Stiavelli, M., Chary, R.-R., et al. 2024, ApJ, 963, 9, doi: 10.3847/1538-4357/ad1404
-
[57]
Morishita, T., Mason, C. A., Kreilgaard, K. C., et al. 2025, ApJ, 983, 152, doi: 10.3847/1538-4357/adbbdc
-
[58]
2026, AJ, 171, 191, doi: 10.3847/1538-3881/ae40f1
McConachie, I., & Brammer, G. 2026, AJ, 171, 191, doi: 10.3847/1538-3881/ae40f1
-
[59]
Mukherjee, S., Batalha, N. E., Fortney, J. J., & Marley, M. S. 2023, ApJ, 942, 71, doi: 10.3847/1538-4357/ac9f48
-
[60]
2016, ApJ, 830, 159, doi: 10.3847/0004-637X/830/2/159
Nakajima, T., & Sorahana, S. 2016, ApJ, 830, 159, doi: 10.3847/0004-637X/830/2/159
-
[61]
Oesch, P. A., Bouwens, R. J., Illingworth, G. D., Labb´ e, I., & Stefanon, M. 2018, ApJ, 855, 105, doi: 10.3847/1538-4357/aab03f
-
[62]
Oesch, P. A., Bouwens, R. J., Illingworth, G. D., et al. 2013, ApJ, 773, 75, doi: 10.1088/0004-637X/773/1/75
-
[63]
2009, ApJ, 706, 1136, doi: 10.1088/0004-637X/706/2/1136
Ouchi, M., Mobasher, B., Shimasaku, K., et al. 2009, ApJ, 706, 1136, doi: 10.1088/0004-637X/706/2/1136
-
[64]
Pirzkal, N., Sahu, K. C., Burgasser, A., et al. 2005, ApJ, 622, 319, doi: 10.1086/427896
doi:10.1086/427896 2005
-
[65]
Pirzkal, N., Burgasser, A. J., Malhotra, S., et al. 2009, ApJ, 695, 1591, doi: 10.1088/0004-637X/695/2/1591
-
[66]
Pontoppidan, K. M., Pickering, T. E., Laidler, V. G., et al. 2016, in Society of Photo-Optical Instrumentation Engineers (SPIE) Conference Series, Vol. 9910, Observatory Operations: Strategies, Processes, and Systems VI, ed. A. B. Peck, R. L. Seaman, & C. R. Benn, 991016, doi: 10.1117/12.2231768
-
[67]
2022, ApJ, 927, 236, doi: 10.3847/1538-4357/ac4803
Leethochawalit, N., & Trenti, M. 2022, ApJ, 927, 236, doi: 10.3847/1538-4357/ac4803
-
[68]
2025, ApJ, 983, 18, doi: 10.3847/1538-4357/adba60
Roberts-Borsani, G., Bagley, M., Rojas-Ruiz, S., et al. 2025, ApJ, 983, 18, doi: 10.3847/1538-4357/adba60
-
[69]
Robertson, B., Johnson, B. D., Tacchella, S., et al. 2024, ApJ, 970, 31, doi: 10.3847/1538-4357/ad463d
-
[70]
Robertson, B. E., Ellis, R. S., Furlanetto, S. R., & Dunlop, J. S. 2015, ApJ, 802, L19, doi: 10.1088/2041-8205/802/2/l19
-
[71]
Ryan, Jr., R. E., Hathi, N. P., Cohen, S. H., & Windhorst, R. A. 2005, ApJL, 631, L159, doi: 10.1086/497368
doi:10.1086/497368 2005
-
[72]
Ryan, Jr., R. E., & Reid, I. N. 2016, AJ, 151, 92, doi: 10.3847/0004-6256/151/4/92
-
[73]
Skelton, R. E., Whitaker, K. E., Momcheva, I. G., et al. 2014, The Astrophysical Journal Supplement Series, 214, 24, doi: 10.1088/0067-0049/214/2/24
-
[74]
2019, ApJ, 870, 118, doi: 10.3847/1538-4357/aaf1a7
Sorahana, S., Nakajima, T., & Matsuoka, Y. 2019, ApJ, 870, 118, doi: 10.3847/1538-4357/aaf1a7
-
[75]
Stanway, E. R., Bremer, M. N., & Lehnert, M. D. 2008, MNRAS, 385, 493–510, doi: 10.1111/j.1365-2966.2008.12853.x
-
[76]
Stanway, E. R., Bunker, A. J., McMahon, R. G., et al. 2004, ApJ, 607, 704, doi: 10.1086/383531
doi:10.1086/383531 2004
-
[77]
Steidel, C. C., Adelberger, K. L., Giavalisco, M., Dickinson, M., & Pettini, M. 1999, The Astrophysical Journal, 519, 1, doi: 10.1086/307363
doi:10.1086/307363 1999
-
[78]
Adelberger, K. L. 1996, ApJL, 462, L17, doi: 10.1086/310029
doi:10.1086/310029 1996
-
[79]
A., Morishita, T., Kodama, T., et al
Sutanto, R. A., Morishita, T., Kodama, T., et al. 2026, arXiv e-prints, arXiv:2602.04333, doi: 10.48550/arXiv.2602.04333
-
[80]
J., Ahmed, S., & Laithwaite, R
Warren, S. J., Ahmed, S., & Laithwaite, R. C. 2021, The Open Journal of Astrophysics, 4, 4, doi: 10.21105/astro.2010.11093
-
[81]
Weibel, A., Oesch, P. A., Williams, C. C., et al. 2026, ApJ, 1002, 136, doi: 10.3847/1538-4357/ae5a9c
This paper was first reviewed by grok-4.5 on July 12, 2026.
discussion (0)
Sign in with ORCID, Apple, or X to comment. Anyone can read and Pith papers without signing in.