REVIEW 3 major objections 5 minor 1 cited by
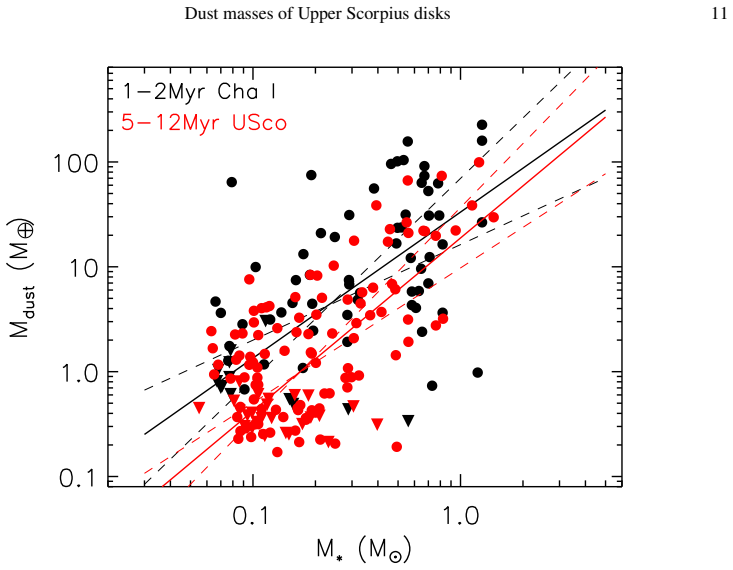
Upper Scorpius disks, at 5–12 Myr, hold roughly six times less millimeter dust than younger Chamaeleon I disks, with a median of 0.95 Earth masses.
Reviewed by Pith at T0; open to challenge. T0 means a machine referee read the full paper against a public rubric. the ladder, T0–T4 →
T0 review · deepseek-v4-flash
2026-08-02 00:51 UTC pith:TWOEYGGR
load-bearing objection Directionally strong, numerically overstated: the factor-of-six depletion is likely closer to four once the age dependence of accretion is accounted for. the 3 major comments →
Dust masses of Upper Scorpius disks and their statistics
The pith
A machine-rendered reading of the paper's core claim, the machinery that carries it, and where it could break.
Core claim
The central claim is that the dust reservoirs of Upper Scorpius disks are substantially depleted by ages of ~5–12 Myr, with a median dust mass of 0.95 Earth masses (about six times below the 5.69 Earth masses of younger Chamaeleon I disks), and that this depletion is inferred using a new calibration of dust temperature versus stellar luminosity. The authors derive a grid of 918 radiative transfer models that account for stellar-mass-dependent disk sizes, accretion rates, and porous dust properties, yielding log T_dust = 1.506 + 0.115 log L* + 0.004 (log L*)^2. This predicts systematically higher dust temperatures for low-mass stars than earlier prescriptions, which raises inferred masses for
What carries the argument
The argument is carried by a new model-derived relation between dust temperature and stellar luminosity, log T_dust = 1.506 + 0.115 log L* + 0.004 (log L*)^2, together with a porous dust opacity of κ_0.88mm = 0.84 cm²/g. The relation is built from a grid of 918 radiative transfer models that include stellar-mass-dependent disk sizes and accretion rates, so that low-mass stars have smaller, more compact disks that are heated more efficiently. This machinery directly converts observed 0.88 mm fluxes into dust masses via the optically thin formula, and it is the reason the paper claims the sixfold depletion is not simply an artifact of assuming a uniform 20 K dust temperature.
Load-bearing premise
The derived dust masses hinge on assuming that disk radii scale with stellar mass as log R_eff = 1.77 + 0.58 log M* and accretion rates as log Mdot = −7.93 + 1.95 log M*, extrapolated down to the low-mass Upper Scorpius population; if actual disks are larger or accreting more slowly, the inferred temperatures drop and dust masses rise.
What would settle it
Measure resolved disk sizes and accretion rates for a sample of M-dwarf disks in Upper Scorpius: if their characteristic radii do not follow the assumed mass scaling (e.g., they are as large as those of higher-mass stars), the warm-temperature prediction fails and the inferred median dust mass would increase, shrinking the sixfold depletion. Alternatively, spatially resolved dust temperature measurements at 0.88 mm for individual low-luminosity disks would directly test the T_dust–L* relation.
If this is right
- If the median dust mass in Upper Scorpius is 0.95 Earth masses, then the reservoir of millimeter-sized grains available for planet formation at 5–12 Myr is far smaller than at 1–2 Myr.
- The comparison with exoplanet masses (median ~4.28 Earth masses) suggests that by 5–12 Myr a large fraction of the original solid material has been incorporated into larger bodies, removed by radial drift, or hidden in optically thick regions.
- The slightly steeper dust-mass–stellar-mass relation in Upper Scorpius (slope 1.65 versus 1.38 in Chamaeleon I) is consistent with millimeter grains being depleted more efficiently around lower-mass stars.
- The optically thin approximation used to compute dust masses is supported by the models: in the majority of grid models, the optically thick region is confined to the inner disk and most of the dust mass lies in optically thin regions.
- The new temperature calibration raises inferred dust masses for low-mass stars compared with earlier prescriptions, which partly compensates for the lower porous-dust opacity and changes absolute but not relative dust mass estimates.
Where Pith is reading between the lines
- An editor might infer that if the assumed disk-size–stellar-mass scaling is too steep for the low-mass Upper Scorpius population, the inferred dust temperatures for those stars could be overestimated, meaning the true median dust mass might be higher than 0.95 Earth masses and the sixfold depletion somewhat weaker.
- The new calibration implies that previous dust mass estimates for old, low-mass disks using a fixed 20 K temperature or older luminosity scalings may be systematically too high, since those older prescriptions yield cooler temperatures for low-mass stars.
- The paper's mechanism suggests a testable extension: direct submillimeter imaging of a few low-mass Upper Scorpius disks to measure their characteristic radii would validate or falsify the compact-disk assumption that drives the warm-temperature prediction.
- A natural consequence of the steepening slope is that dust-trapping pressure bumps must be less effective in lower-mass disks; this could be tested by comparing the frequency of rings and gaps in high- versus low-mass disks at similar ages.
Editorial analysis
A structured set of objections, weighed in public.
Referee Report
Summary. This paper derives a new dust-temperature--stellar-luminosity calibration from a grid of 918 HOCHUNK3D radiative-transfer models that include stellar-mass-dependent disk sizes and accretion rates and porous DSHARP dust, then uses the relation (Eq. 8) with κ_0.88mm = 0.84 cm2/g to convert the Carpenter et al. (2025) ALMA 0.88 mm fluxes of 136 full/transitional Upper Scorpius disks into dust masses. Using Kaplan-Meier survival analysis, it reports a median dust mass of 0.95 M_Earth for USco versus 5.69 M_Earth for a spectrally matched Cha I sample, and a slightly steeper M_dust-M* relation in USco (slope 1.65 versus 1.38). The paper tests the optically thin approximation with its model grid and compares the USco distribution to the exoplanet mass distribution.
Significance. If the result holds, the paper sharpens the evidence for millimeter-dust depletion over 5-12 Myr and provides a new T_dust(L*) relation that can be used by other groups. The main strengths are the well-defined 136-disk USco sample, the explicit radiative-transfer treatment that improves on a fixed 20 K or a single power-law T_dust assumption, the use of censored-data statistics, the explicit test of the optically thin approximation, and the mass-restricted comparison. The porous-opacity choice is transparent and the model grid is clearly described. The central risk is that the T_dust calibration inherits external scaling relations (disk size versus M*, Mdot versus M*) fitted in younger regions and extrapolated to 5-12 Myr USco; this directly affects the magnitude of the claimed depletion relative to Cha I.
major comments (3)
- [Sect. 3.4, Eq. (8), and Sect. 3.5] The grid assigns Mdot using log Mdot = -7.93 + 1.95 log M*, fitted to 256 disks in Taurus, Lupus, Ophiuchus, and Chamaeleon I (Fig. 2). These are young regions, while USco is 5-12 Myr and accretion rates decline with age. Section 3.5 states that viscous heating contributes 5.2 K at L* = 0.1 Lsun, a substantial part of the 24.8 K predicted by Eq. (8). If the true USco Mdot values are lower, the inferred T_dust for low-mass USco stars is too high and the derived dust masses are too low. This bias is age-selective because the same Mdot relation is more defensible for the young Cha I sample, so the factor-of-six median depletion in Sect. 4.1 is likely an overestimate. The mass-restricted comparison in Sect. 4.1 does not cure this because it reuses the same T_dust calibration. Please quantify the sensitivity of the median masses to reduced or zero viscous heating, or constrain Mdot from USco
- [Sect. 4.1] The central values 0.95 and 5.69 M_Earth are quoted as point estimates without uncertainties. No confidence intervals are given for the Kaplan-Meier medians, and the scatter in Eq. (8) and the opacity uncertainty are not propagated. Because the factor-of-six depletion is the main quantitative claim, the paper should report bootstrap or analytic uncertainties on the medians (and on their ratio), including the censored fraction and finite sample sizes. The narrow-mass subsample medians (2.83 versus 0.44 M_Earth) also need uncertainties before they can be used as supporting evidence.
- [Sect. 2 versus Sect. 4] Section 2 states that sources without Gaia distances are assigned 145 pc (USco) and 190 pc (Cha I), while Section 4 states 145 pc and 160 pc. Since M_dust depends on D^2, this is a factor of (190/160)^2 = 1.41 for the affected Cha I sources. Please reconcile the two numbers, state how many sources lack Gaia distances, and re-run the relevant medians if necessary.
minor comments (5)
- [Eq. (6)] The viscous dissipation expression is garbled in the typesetting; the formula should be checked and reproduced cleanly.
- [Sect. 3.3] The informal phrasing 'gazillions of absorption/re-emission events' should be replaced by a quantitative statement about photon statistics and convergence.
- [General] For reproducibility, consider providing a machine-readable table of the 136 sources with adopted distances, T_dust, and derived dust masses, and likewise for the Cha I sample.
- [Sect. 4.1] The comparison to the exoplanet mass distribution is made only at the level of median values; a two-sample test on the full distributions would make the 'mass budget' statement more robust.
- [Fig. 2 caption] The caption uses 'Chamaeleon' while the text uses 'Chamaeleon I'/'Cha I'; unify the notation.
Circularity Check
No significant circularity; one minor same-author citation supports a load-bearing modeling equivalence, but the central dust-mass comparison is independently grounded.
specific steps
-
self citation load bearing
[Section 3.4 (Parameter space of the model grid), around Eq. (3) and the sampling of R_c]
"As demonstrated in Liu et al. (2024), the characteristic radius is a good representative for the effective disk radius. Therefore, we directly sampled R_c using the relation provided by Andrews et al. (2018)."
The new T_dust-L* calibration (Eq. 8) is driven largely by stellar-mass-dependent disk sizes. To import the external Andrews+18 R_eff-M* relation into the RT grid, the paper equates R_c with R_eff, and the only support for this equivalence is a citation to Liu et al. (2024), a paper sharing an author with the present study. This is a same-author citation used to justify a load-bearing modeling step rather than a derivation demonstrated in this paper. It does not, however, make the final dust masses reduce to the fitted inputs, because the observed fluxes and the external R_eff-M* and Mdot-M* relations are independent of the target USco dust masses.
full rationale
The derivation chain is otherwise self-contained. Eq. (1) is the standard optically-thin dust-mass estimator; Eq. (8) is a new calibration obtained from a 918-model HOCHUNK3D grid whose inputs (R_eff-M* from Andrews+18, Mdot-M* from Manara+23, DSHARP+porosity opacities, P=0.8) come from external observations or stated physical assumptions, not from the USco dust masses being derived. Applying Eq. (8) to the observed ALMA fluxes is a calibration, not a fit to the target quantity. The factor-of-six Cha I/USco depletion is supported independently by the raw 0.88 mm flux decline (median 3.6 vs 1.5 mJy, factor 2.4) and by earlier studies, so even if Eq. (8) were biased the qualitative conclusion would not be an artifact. The extrapolation of the young-region Mdot-M* relation to 5-12 Myr USco and the 5.2 K viscous-heating contribution are modeling/systematic uncertainties (correctness risk), not circularity. The only circularity-adjacent concern is the Liu et al. (2024) self-citation used to equate R_c with R_eff; it is a minor same-author support for a sub-step, not a reduction of the central claim to its inputs. Hence score 2.
Axiom & Free-Parameter Ledger
free parameters (10)
- Dust porosity P =
0.8
- Grain size distribution parameters =
a_min=0.01 μm; a_max(SGP)=1 μm; a_max(LGP)=1 mm; power-law index -3.5
- Dust settling parameters =
f=0.85; Λ=0.2
- Disk geometry grid values =
h100 = 5, 10, 15 AU; Ψ = 1.05, 1.15, 1.25; disk-to-stellar mass ratios = 0.001, 0.01, 0.1
- Surface density exponent γ =
1
- Disk outer radius truncation =
R_out = 5 R_c
- Accretion rate relation coefficients =
log Mdot = -7.93 + 1.95 log M*
- Disk size relation coefficients =
log R_eff = 1.77 + 0.58 log M*
- T_dust-L* relation fit coefficients =
1.506, 0.115, 0.004
- Dust-to-gas mass ratio =
0.01
axioms (8)
- domain assumption Monte Carlo radiative transfer as implemented in HOCHUNK3D correctly computes dust temperatures for the prescribed disk structures.
- domain assumption The optically thin approximation in Eq. (1) is valid for deriving dust masses from 0.88 mm fluxes.
- domain assumption A single mass-averaged dust temperature and a single opacity characterize the submillimeter emission of each disk.
- domain assumption Stellar spectra can be approximated as blackbodies at the effective temperature and luminosity.
- domain assumption The two-population settled disk structure (small grains in a flared layer, large grains near the midplane) captures the essential vertical distribution of dust.
- domain assumption The stellar-mass-dependent disk size and accretion-rate relations derived from other regions apply to the Upper Scorpius disk population.
- domain assumption Pre-main-sequence evolutionary tracks (Baraffe+15 for M dwarfs, Feiden+16 for hotter stars) give correct stellar masses and radii.
- domain assumption Gaia parallaxes and adopted distances (145 pc for USco, 160-190 pc for Cha I) are correct for sources without parallaxes.
read the original abstract
The total dust mass of protoplanetary disks is a key property that determines the potential for planet formation. Upper Scorpius (USco), with an age of ~5-12Myr, provides an important laboratory for investigating the evolution of dust reservoirs on timescales comparable to those of planet formation. In this work, we analyze the dust mass distribution of 136 full and transitional disks in USco using the largest ALMA 0.88mm continuum sample currently available for the region. To improve the accuracy of dust mass estimates, we construct a grid of 918 self-consistent radiative transfer models that account for stellar-mass-dependent disk sizes, accretion rates, and porous dust properties. The models yield a new calibration between dust temperature and stellar luminosity, predicting systematically higher dust temperatures for low-mass stars than commonly adopted prescriptions. Using these revised dust temperatures together with porous dust opacities, we derive dust masses for the USco disks and compare them with those of a younger sample in the Chamaeleon~I star-forming region. We find a median dust mass of 0.95M_E for the USco disks, approximately six times lower than that of the Chamaeleon I disks (5.69M_E), providing strong evidence for substantial depletion of millimeter-sized dust grains over the first several Myr of disk evolution. We confirm the previous finding of a highly significant correlation between stellar mass and dust mass, with a slightly steeper relation in USco than in Chamaeleon I. The low dust masses observed in USco, together with their comparison to mature exoplanetary systems, suggest that a large fraction of the primordial solid reservoir has already been incorporated into larger bodies, removed by radial drift, or hidden from millimeter observations by ages of 5-12 Myr.
Figures


Forward citations
Cited by 1 Pith paper
-
The Influence of Dust Composition on Accretion Outbursts
Using 1D simulations with dust evaporation and condensation, the paper shows that dead-zone accretion outbursts vaporize dust out to about 0.5 au and that higher dust sublimation temperatures produce stronger but less...
Reference graph
Works this paper leans on
-
[1]
Andrews, S. M. 2020, ARA&A, 58, 483
2020
-
[2]
M., Rosenfeld, K
Andrews, S. M., Rosenfeld, K. A., Kraus, A. L., & Wilner, D. J. 2013, ApJ, 771, 129 Dust masses of Upper Scorpius disks 13
2013
-
[3]
M., Terrell, M., Tripathi, A., et al
Andrews, S. M., Terrell, M., Tripathi, A., et al. 2018, ApJ, 8 65, 157
2018
-
[4]
M., Wilner, D
Andrews, S. M., Wilner, D. J., Espaillat, C., et al. 2011, ApJ , 732, 42
2011
-
[5]
P ., Manara, C
Ansdell, M., Williams, J. P ., Manara, C. F., et al. 2017, AJ, 1 53, 240
2017
-
[6]
P ., van der Marel, N., et al
Ansdell, M., Williams, J. P ., van der Marel, N., et al. 2016, A pJ, 828, 46
2016
-
[7]
P ., Trapman, L., et al
Ansdell, M., Williams, J. P ., Trapman, L., et al. 2018, ApJ, 8 59, 21
2018
-
[8]
P ., & Eisner, J
Ballering, N. P ., & Eisner, J. A. 2019, AJ, 157, 144 Baraffe, I., Homeier, D., Allard, F., & Chabrier, G. 2015, A&A , 577, A42
2019
-
[9]
Beckwith, S. V . W ., & Sargent, A. I. 1991, ApJ, 381, 250
1991
-
[10]
2024, ARA&A, 62, 157
Birnstiel, T. 2024, ARA&A, 62, 157
2024
-
[11]
2016, Space Sci
Birnstiel, T., Fang, M., & Johansen, A. 2016, Space Sci. Rev. , 205, 41
2016
-
[12]
P ., Zhu, Z., et al
Birnstiel, T., Dullemond, C. P ., Zhu, Z., et al. 2018, ApJ, 86 9, L45
2018
-
[13]
1935, Ann
Bruggeman, D. 1935, Ann. Phys., 416, 636 Brunngräber, R., & Wolf, S. 2021, A&A, 648, A87
1935
-
[14]
M., Esplin, T
Carpenter, J. M., Esplin, T. L., Luhman, K. L., Mamajek, E. E. , & Andrews, S. M. 2025, ApJ, 978, 117
2025
-
[15]
M., Ricci, L., & Isella, A
Carpenter, J. M., Ricci, L., & Isella, A. 2014, ApJ, 787, 42
2014
-
[16]
I., & Goldreich, P
Chiang, E. I., & Goldreich, P . 1997, ApJ, 490, 368
1997
-
[17]
2016, A&A, 594, A83
Daemgen, S., Natta, A., Scholz, A., et al. 2016, A&A, 594, A83
2016
-
[18]
J., Hillenbrand, L
David, T. J., Hillenbrand, L. A., Gillen, E., et al. 2019, ApJ , 872, 161
2019
-
[19]
2021, OpTool: Command-line driven tool for creating complex dust opacities, Astrophysics Source Code Library, record ascl: 2104.010
Dominik, C., Min, M., & Tazaki, R. 2021, OpTool: Command-line driven tool for creating complex dust opacities, Astrophysics Source Code Library, record ascl: 2104.010
2021
-
[20]
Draine, B. T. 2003, ARA&A, 41, 241 Drążkowska, J., Bitsch, B., Lambrechts, M., et al. 2023, in Astronomical Society of the Pacific Conference
2003
-
[21]
P ., & Dominik, C
Dullemond, C. P ., & Dominik, C. 2005, A&A, 434, 971
2005
-
[22]
P ., Dominik, C., & Natta, A
Dullemond, C. P ., Dominik, C., & Natta, A. 2001, ApJ, 560, 957
2001
-
[23]
Fang, M., & Herczeg, G. J. 2025, ApJ, 994, 248
2025
-
[24]
2023, ApJ, 945, 11 2
Fang, M., Pascucci, I., Edwards, S., et al. 2023, ApJ, 945, 11 2
2023
-
[25]
2009, A&A, 504, 461
Fang, M., van Boekel, R., Wang, W ., et al. 2009, A&A, 504, 461
2009
-
[26]
S., Pascucci, I., et al
Fang, M., Kim, J. S., Pascucci, I., et al. 2017, AJ, 153, 188
2017
-
[27]
Feiden, G. A. 2016, A&A, 593, A99
2016
-
[28]
D., & Nelson, P
Feigelson, E. D., & Nelson, P . I. 1985, ApJ, 293, 192 Gaia Collaboration, Vallenari, A., Brown, A. G. A., et al. 20 23, A&A, 674, A1
1985
-
[29]
Galli, P . A. B., Bouy, H., Olivares, J., et al. 2021, A&A, 646, A46
2021
-
[30]
T., & Herbst, E
Garrod, R. T., & Herbst, E. 2006, A&A, 457, 927
2006
-
[31]
2023, ApJ, 953, 92
Ginski, C., Tazaki, R., Dominik, C., & Stolker, T. 2023, ApJ, 953, 92
2023
-
[32]
2026, ApJ, 997, 192
Godines, D., Lyra, W ., Ricci, L., et al. 2026, ApJ, 997, 192
2026
-
[33]
L., Espaillat, C
Grant, S. L., Espaillat, C. C., Wendeborn, J., et al. 2021, Ap J, 913, 123
2021
-
[34]
P ., et al
Gupta, A., Miotello, A., Williams, J. P ., et al. 2024, A&A, 68 3, A133
2024
-
[35]
P ., Mulders, G
Hendler, N. P ., Mulders, G. D., Pascucci, I., et al. 2017, ApJ , 841, 116
2017
-
[36]
2013, Chemical Reviews, 113, 9016
Henning, T., & Semenov, D. 2013, Chemical Reviews, 113, 9016
2013
-
[37]
1996, A&A, 311, 291
Henning, T., & Stognienko, R. 1996, A&A, 311, 291
1996
-
[38]
D., & Nelson, P
Isobe, T., Feigelson, E. D., & Nelson, P . I. 1986, ApJ, 306, 49 0
1986
-
[39]
2016, Icarus, 277 , 257
Jorda, L., Gaskell, R., Capanna, C., et al. 2016, Icarus, 277 , 257
2016
-
[40]
Kelly, B. C. 2007, ApJ, 665, 1489
2007
-
[41]
J., & Hartmann, L
Kenyon, S. J., & Hartmann, L. 1987, ApJ, 323, 714
1987
-
[42]
Kirchschlager, F., Bertrang, G. H. M., & Flock, M. 2019, MNRA S, 488, 1211
2019
-
[43]
2015, Science, 349, 2.639
Kofman, W ., Herique, A., Barbin, Y ., et al. 2015, Science, 349, 2.639
2015
-
[44]
M., Kraus, A
Krolikowski, D. M., Kraus, A. L., & Rizzuto, A. C. 2021, AJ, 16 2, 110 14 Deng et al
2021
-
[45]
J., DeRocco, W ., Hadden, S., & Gaudi, B
Lee, E. J., DeRocco, W ., Hadden, S., & Gaudi, B. S. 2026, ApJ, 1 005, L18
2026
-
[46]
2023, MNRAS, 518, 6092
Li, D., Liu, Y ., Wang, H., Wang, Y ., & Ma, Y . 2023, MNRAS, 518, 6092
2023
-
[47]
Lissauer, J. J. 1993, ARA&A, 31, 129
1993
-
[48]
2017, A&A, 607, A74
Liu, Y ., Henning, T., Carrasco-González, C., et al. 2017, A&A, 607, A74
2017
-
[49]
2024, A&A, 692, A148
Liu, Y ., Roussel, H., Linz, H., et al. 2024, A&A, 692, A148
2024
-
[50]
J., Pascucci, I., et al
Long, F., Herczeg, G. J., Pascucci, I., et al. 2018, ApJ, 863, 61
2018
-
[51]
J., Harsono, D., et al
Long, F., Herczeg, G. J., Harsono, D., et al. 2019, ApJ, 882, 4 9
2019
-
[52]
M., Rosotti, G., et al
Long, F., Andrews, S. M., Rosotti, G., et al. 2022, ApJ, 931, 6
2022
-
[53]
L., & Esplin, T
Luhman, K. L., & Esplin, T. L. 2020, AJ, 160, 44
2020
-
[54]
F., Ansdell, M., Rosotti, G
Manara, C. F., Ansdell, M., Rosotti, G. P ., et al. 2023, in Astronomical Society of the Pacific Conference
2023
-
[55]
F., Morbidelli, A., & Guillot, T
Manara, C. F., Morbidelli, A., & Guillot, T. 2018, A&A, 618, L 3
2018
-
[56]
C., & Kata oka, A
Miotello, A., Kamp, I., Birnstiel, T., Cleeves, L. C., & Kata oka, A. 2023, in Astronomical Society of the Pacific Conference Series, Vol. 534, Protostars and Planets VII, ed. S. Inutsuka, Y . Aikawa, T. Muto, K. Tomida, & M. Tamura, 501
2023
-
[57]
D., Pascucci, I., Ciesla, F
Mulders, G. D., Pascucci, I., Ciesla, F. J., & Fernandes, R. B . 2021, ApJ, 920, 66 Öberg, K. I., Facchini, S., & Anderson, D. E. 2023, ARA&A, 61, 287
2021
-
[58]
J., et al
Pascucci, I., Testi, L., Herczeg, G. J., et al. 2016, ApJ, 831 , 125
2016
-
[59]
J., Mamajek, E
Pecaut, M. J., Mamajek, E. E., & Bubar, E. J. 2012, ApJ, 746, 15 4
2012
-
[60]
2022, European Physical Journal Plus, 137, 1206
Pinilla, P . 2022, European Physical Journal Plus, 137, 1206
2022
-
[61]
2020, A&A, 635, A105
Pinilla, P ., Pascucci, I., & Marino, S. 2020, A&A, 635, A105
2020
-
[62]
N., & Morbidelli, A
Raymond, S. N., & Morbidelli, A. 2022, in Astrophysics and Sp ace Science Library, Vol. 466, Demographics of Exoplanetary Systems, Lecture Notes of the 3rd Advanced School on Exoplanetary Science, ed. K. Biazzo, V . Bozza, L. Mancini, & A. Sozzetti, 3
2022
-
[63]
A., González-Ruilova, C., Cieza, L
Ruiz-Rodriguez, D. A., González-Ruilova, C., Cieza, L. A., et al. 2025, ApJ, 989, 2
2025
-
[64]
R., Calahan, J
Schwarz, K. R., Calahan, J. K., Zhang, K., et al. 2021, ApJS, 2 57, 20
2021
-
[65]
I., & Sunyaev, R
Shakura, N. I., & Sunyaev, R. A. 1973, A&A, 24, 337
1973
-
[66]
2026, ApJ, 1001, 27
Shi, Y ., Long, F., Macías, E., et al. 2026, ApJ, 1001, 27
2026
-
[67]
2023, ApJ, 944, L43
Tazaki, R., Ginski, C., & Dominik, C. 2023, ApJ, 944, L43
2023
-
[68]
2014, in Protosta rs and Planets VI, ed
Testi, L., Birnstiel, T., Ricci, L., et al. 2014, in Protosta rs and Planets VI, ed. H. Beuther, R. S. Klessen, C. P . Dullemond, & T. Henning, 339
2014
-
[69]
M., Birnstiel, T., & Wilner, D
Tripathi, A., Andrews, S. M., Birnstiel, T., & Wilner, D. J. 2 017, ApJ, 845, 44 Tychoniec, Ł., Tobin, J. J., Karska, A., et al. 2018, ApJS, 23 8, 19 Tychoniec, Ł., Manara, C. F., Rosotti, G. P ., et al. 2020, A&A, 640, A19 van der Marel, N., Williams, J. P ., Ansdell, M., et al. 2018, A pJ, 854, 177 van der Plas, G., Ménard, F., Ward-Duong, K., et al. 20...
2018
-
[70]
G., & Brandt, R
Warren, S. G., & Brandt, R. E. 2008, Journal of Geophysical Re search (Atmospheres), 113, D14220
2008
-
[71]
A., Wood, K., Bjorkman, J
Whitney, B. A., Wood, K., Bjorkman, J. E., & Wolff, M. J. 2003, A pJ, 591, 1049
2003
-
[72]
P ., & Cieza, L
Williams, J. P ., & Cieza, L. A. 2011, ARA&A, 49, 67
2011
-
[73]
P ., Cieza, L., Hales, A., et al
Williams, J. P ., Cieza, L., Hales, A., et al. 2019, ApJ, 875, L 9
2019
-
[74]
C., Rilinger, A
Xin, Z., Espaillat, C. C., Rilinger, A. M., Ribas, Á., & Macía s, E. 2023, ApJ, 942, 4
2023
-
[75]
S., Law, C
Zhang, K., Booth, A. S., Law, C. J., et al. 2021, ApJS, 257, 5
2021
-
[76]
2023, ApJ, 953, 96
Zhang, S., Zhu, Z., Ueda, T., et al. 2023, ApJ, 953, 96
2023
discussion (0)
Sign in with ORCID, Apple, or X to comment. Anyone can read and Pith papers without signing in.