iWorld-Bench: A Benchmark for Interactive World Models with a Unified Action Generation Framework
Pith reviewed 2026-05-08 18:44 UTC · model grok-4.3
The pith
iWorld-Bench supplies a 330k-clip dataset and unified action framework to test world models on physical interaction tasks.
A machine-rendered reading of the paper's core claim, the machinery that carries it, and where it could break.
Core claim
iWorld-Bench consists of a diverse video dataset drawn from 330k clips and reduced to 2.1k curated samples together with an Action Generation Framework that unifies evaluation across models with different interaction modalities. The framework supports six task types that assess visual generation, trajectory following, and memory through 4.9k test samples. Evaluation of 14 representative world models on this benchmark identifies key limitations in current approaches and supplies a public leaderboard for continued comparison.
What carries the argument
The Action Generation Framework that translates outputs from models with differing action modalities into a common format for consistent testing across tasks.
If this is right
- Models can be compared fairly on interaction abilities regardless of their internal action representations.
- The 330k clips and 2.1k samples supply training data that targets specific gaps in perception and memory.
- The six tasks isolate weaknesses in visual generation, path following, and recall for targeted model improvement.
- The public leaderboard enables ongoing tracking of progress as new world models appear.
- Insights from the 14-model evaluation point to concrete directions for addressing current shortcomings.
Where Pith is reading between the lines
- Strong results on the benchmark may indicate better transfer to downstream control problems such as robotic planning, though this remains untested.
- The curation method from large raw video to focused high-quality samples could be reused to build narrower benchmarks for manipulation or navigation.
- Adding tasks with longer temporal horizons might expose further memory limitations not captured by the current six types.
- Pairing the benchmark with real-world robot trajectories would allow direct measurement of sim-to-real gaps.
Load-bearing premise
The 2.1k curated samples and six task types sufficiently represent the core physical interaction capabilities needed to advance toward AGI-level agents.
What would settle it
A model that achieves high scores across all six tasks but cannot perform the same distance, memory, or trajectory tasks when transferred to a physical robot or different simulation environment would falsify the benchmark's usefulness.
Figures



read the original abstract
Achieving Artificial General Intelligence (AGI) requires agents that learn and interact adaptively, with interactive world models providing scalable environments for perception, reasoning, and action. Yet current research still lacks large-scale datasets and unified benchmarks to evaluate their physical interaction capabilities. To address this, we propose iWorld-Bench, a comprehensive benchmark for training and testing world models on interaction-related abilities such as distance perception and memory. We construct a diverse dataset with 330k video clips and select 2.1k high-quality samples covering varied perspectives, weather, and scenes. As existing world models differ in interaction modalities, we introduce an Action Generation Framework to unify evaluation and design six task types, generating 4.9k test samples. These tasks jointly assess model performance across visual generation, trajectory following, and memory. Evaluating 14 representative world models, we identify key limitations and provide insights for future research. The iWorld-Bench model leaderboard is publicly available at iWorld-Bench.com.
Editorial analysis
A structured set of objections, weighed in public.
Referee Report
Summary. The paper proposes iWorld-Bench, a benchmark for interactive world models consisting of a dataset constructed from 330k video clips with 2.1k high-quality samples selected to cover varied perspectives, weather, and scenes; a unified Action Generation Framework to handle differing interaction modalities; six task types that generate 4.9k test samples jointly assessing visual generation, trajectory following, and memory; an evaluation of 14 representative world models that identifies key limitations; and a public leaderboard at iWorld-Bench.com.
Significance. If the dataset selection and task design are shown to be representative and well-calibrated, the benchmark would address a clear gap by providing a standardized, unified evaluation protocol for physical interaction capabilities in world models, with the public leaderboard and Action Generation Framework offering concrete value for reproducibility and community progress toward more adaptive agents.
major comments (2)
- [Abstract and Dataset Construction] Abstract and Dataset Construction section: the claim that the 2.1k curated samples (selected from 330k clips) sufficiently represent core physical interaction capabilities rests on the statement that they cover 'varied perspectives, weather, and scenes,' but no quantitative coverage metrics, explicit selection criteria, or correlation analysis with established physical-interaction benchmarks are supplied.
- [Task Design and Evaluation] Task Design and Evaluation sections: the six task types are asserted to 'jointly assess' abilities and the 14-model evaluation is used to 'identify key limitations,' yet no details appear on task difficulty calibration, inter-task correlations, or statistical significance (e.g., confidence intervals or hypothesis tests) of the reported results.
minor comments (1)
- [Abstract] Abstract: the exact breakdown of the 4.9k test samples across the six task types is not stated, which would aid readers in assessing balance.
Simulated Author's Rebuttal
We thank the referee for the constructive comments on our manuscript. We address each major comment point by point below, indicating the revisions we will make to strengthen the paper.
read point-by-point responses
-
Referee: [Abstract and Dataset Construction] Abstract and Dataset Construction section: the claim that the 2.1k curated samples (selected from 330k clips) sufficiently represent core physical interaction capabilities rests on the statement that they cover 'varied perspectives, weather, and scenes,' but no quantitative coverage metrics, explicit selection criteria, or correlation analysis with established physical-interaction benchmarks are supplied.
Authors: We agree that the current description of dataset representativeness is primarily qualitative. In the revised manuscript, we will expand the Dataset Construction section with quantitative coverage metrics (e.g., distributions and percentages across perspective angles, weather categories, and scene types), explicit multi-stage selection criteria used during curation from the 330k clips, and a discussion relating these samples to core physical interaction capabilities. A direct quantitative correlation analysis with other benchmarks was not included originally due to differing evaluation protocols; we will add a qualitative comparison and flag full quantitative alignment as future work. revision: yes
-
Referee: [Task Design and Evaluation] Task Design and Evaluation sections: the six task types are asserted to 'jointly assess' abilities and the 14-model evaluation is used to 'identify key limitations,' yet no details appear on task difficulty calibration, inter-task correlations, or statistical significance (e.g., confidence intervals or hypothesis tests) of the reported results.
Authors: We acknowledge that additional methodological and statistical details are needed to support the claims. We will revise the Task Design and Evaluation sections to describe task difficulty calibration via pilot experiments, provide inter-task correlation analysis demonstrating complementarity across the six tasks, and report confidence intervals along with appropriate statistical tests for performance differences among the 14 models. These additions will more rigorously substantiate the joint assessment and identified limitations. revision: yes
Circularity Check
No circularity: benchmark curation and task design are explicit design choices, not derived results
full rationale
The paper is a benchmark proposal that constructs a dataset by selecting 2.1k samples from 330k clips and defines six task types plus an Action Generation Framework to unify evaluation. These steps are presented as curation and design decisions to enable testing of external world models, with no mathematical derivations, equations, fitted parameters, or predictions that reduce to the inputs by construction. No self-citations are invoked as load-bearing uniqueness theorems or ansatzes. Evaluation results on 14 representative models are external and falsifiable. The central claim therefore rests on the explicit representativeness of the curated samples rather than any internal circular reduction, making the work self-contained.
Axiom & Free-Parameter Ledger
Reference graph
Works this paper leans on
-
[1]
Nguyen, T.-M., Yuan, S., Cao, M., Lyu, Y ., Nguyen, T
doi: 10.1109/TIP.2012.2214050. Nguyen, T.-M., Yuan, S., Cao, M., Lyu, Y ., Nguyen, T. H., and Xie, L. Ntu viral: A visual-inertial-ranging-lidar dataset, from an aerial vehicle viewpoint.The Inter- national Journal of Robotics Research, 41(3):270–280, 2022. Patel, M., Yang, F., Qiu, Y ., Cadena, C., Scherer, S., Hutter, M., and Wang, W. Tartanground: A la...
-
[2]
Spatial Analysis (Indoor/Outdoor): - Determine if the agent isIndoor(enclosed) orOutdoor(open air)
-
[3]
- Example: ’Abandoned industrial courtyard with rusty pipes and overgrown grass’
Detailed Scene Description: - Generate a descriptive English phrase for the specific scene visible in the frames. - Example: ’Abandoned industrial courtyard with rusty pipes and overgrown grass’
-
[4]
- This should be the most representative word for the place
Scene Categorization (Dynamic Summary): - Based on your description above, summarize the scene into a SINGLE Root Noun (Category). - This should be the most representative word for the place. - Do NOT use adjectives here, just the noun
-
[5]
- Indoor: Lighting (Fluorescent, Dim, Natural)
Atmospheric Analysis: - Outdoor: Weather (Sunny, Cloudy, Rainy, Night). - Indoor: Lighting (Fluorescent, Dim, Natural)
-
[6]
Environment_Type
Entity Extraction: - List 15+ distinct objects visible in the scene (structural + dynamic). OUTPUT JSON FORMAT: { "Environment_Type": "Indoor" or "Outdoor", "Scene_Description": "Your detailed descriptive phrase", "Scene_Tag": "Single Root Noun (The dynamic summary)", "Weather_Lighting": "Weather or Lighting condition", "Entities": "List of objects separa...
-
[7]
We adopt the MUSIQ quality prediction model, leveraging its ability to perceive diverse resolutions and aspect ratios to score each frame in the video sequence
Image Quality ( SImage).This metric assesses low-level visual distortions such as overexposure, noise, or blur in generated video frames. We adopt the MUSIQ quality prediction model, leveraging its ability to perceive diverse resolutions and aspect ratios to score each frame in the video sequence. The final score is obtained by calculating the arithmetic ...
-
[8]
We categorize pixel grayscales into three levels (dark, mid, bright) to construct a 3D brightness distribution vector vt = [pdark, pmid, pbright]⊤ for each frame
Brightness Consistency (SBrightness).This metric aims to evaluate the stability of the brightness distribution in generated videos. We categorize pixel grayscales into three levels (dark, mid, bright) to construct a 3D brightness distribution vector vt = [pdark, pmid, pbright]⊤ for each frame. The comprehensive score is derived by calculating the similari...
-
[9]
The hue spectrum (0-179) is divided into 7 core intervals to construct a hue feature vector ht ∈R 7
Color Temperature Constraint (SColor).To evaluate the consistency of the environmental atmosphere, we analyze the Hue dimension in the HSV color space. The hue spectrum (0-179) is divided into 7 core intervals to construct a hue feature vector ht ∈R 7. We calculate the weighted perceptual similarity of the entire sequence relative to the initial frame. To...
-
[10]
Sharpness Retention (SSharpness).This metric evaluates the stability of details by monitoring the evolution of edge gradients. We propose a vectorized Tenengrad method: independently calculate the sum of absolute gradients in the horizontal (Gx) and vertical (Gy) directions, and construct a 2D sharpness vector gt = (P |Gx|, P |Gy|)⊤ to 27 A Benchmark for ...
-
[11]
We adopt a sampling-reconstruction paradigm: discard the odd frames in the generated video and use the interpolation model to reconstruct them
Motion Smoothness ( SMotion).This metric evaluates the sequence coherence of generated videos using the motion prior of a video interpolation model. We adopt a sampling-reconstruction paradigm: discard the odd frames in the generated video and use the interpolation model to reconstruct them. Subsequently, the smoothness is quantified by calculating the co...
-
[12]
The evaluation includes two stages: trajectory alignment and accuracy calculation
Trajectory Accuracy (SAccuracy).This metric quantifies the accuracy with which the world model follows preset camera control commands. The evaluation includes two stages: trajectory alignment and accuracy calculation. First, ViPE is used to extract the original extrinsic trajectory Eraw; to eliminate coordinate system mismatch, a rotation transformation m...
-
[13]
Unlike STrajectory which relies on third-party estimators, this metric directly uses the system-built precise extrinsic sequence Egt as the benchmark
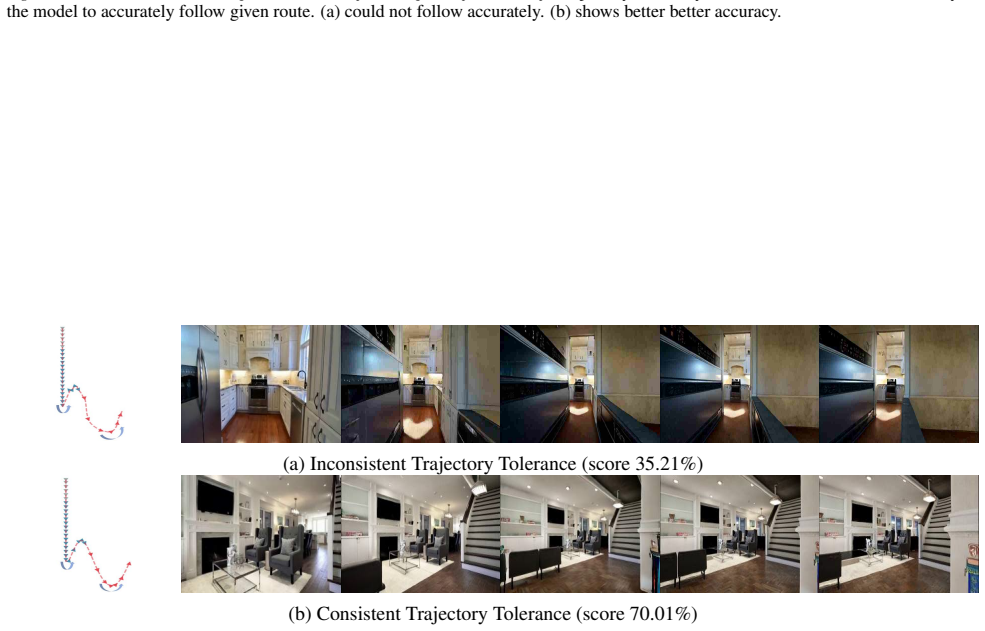
Trajectory Tolerance (STolerance).This metric aims to evaluate the robustness of the model in trajectory execution under the guidance of accurate Ground-truth. Unlike STrajectory which relies on third-party estimators, this metric directly uses the system-built precise extrinsic sequence Egt as the benchmark. We adopt the same coordinate alignment and tan...
-
[14]
Memory Symmetry (SMemory).This metric quantifies the model’s logical loop-closure ability by checking the pixel-wise consistency of symmetric frame pairs(ft, fT−t+1 ) in cyclic or symmetric actions. We calculate the Mean Squared Error (MSEt) of symmetric frame pairs, which is then mapped to a similarity score using a compound exponential function with an ...
-
[15]
Trajectory Alignment (SAlignment).This metric evaluates the model’s ability to maintain symmetric closed-loop camera trajectories in round-trip tasks. ViPE is used to extract the camera extrinsic parameters of each frame, resulting in a sequence {Et}T t=1, where Et ∈R 12 represents the reshaped extrinsic matrix. We calculate the deviation of motion featur...
discussion (0)
Sign in with ORCID, Apple, or X to comment. Anyone can read and Pith papers without signing in.