REVIEW 3 major objections 5 minor 46 references
Light particle and quark chemical potentials from negatively to positively charged particle yield ratios corrected by removing strong and weak decays
T0 review · 3 major / 5 minor · reviewed 2026-08-14 · deepseek-v4-flash
Pith's one-line read The paper claims that after removing strong and weak decay backgrounds, the extracted chemical potentials of protons and up, down, and strange quarks peak near 4 GeV even though the raw yield ratios show no such extremum.
desk verdict Useful, transparent compilation, but the 4 GeV peak in extracted quark chemical potentials is inherited from an assumed T_ch(s) curve and is not established by the data. read the letter →
The pith
A machine-rendered reading of the paper's core claim, the machinery that carries it, and where it could break.
The reading
What carries the argument
The machinery is a set of Boltzmann-statistics relations between yield ratios and chemical potentials. For any particle $j$, $k_j = \exp(-2\mu_j/T_{\rm ch})$, so $\mu_j = -\frac12 T_{\rm ch}\ln k_j$; for light quarks, $\mu_u = -\frac16 T_{\rm ch}(\ln k_\pi+\ln k_p)$, $\mu_d = -\frac16 T_{\rm ch}(-2\ln k_\pi+\ln k_p)$, and $\mu_s = -\frac16 T_{\rm ch}(\ln k_\pi-3\ln k_K+\ln k_p)$. The temperature $T_{\rm ch}(\sqrt{s_{NN}})$ is an empirical limiting-temperature curve from the literature, and the measured ratios are replaced by primary-production ratios taken from a published model calculation that removes strong and weak decays. Fitting smooth curves to the energy-dependent ratios and then applying these identities is what turns monotonic ratio trends into chemical potentials with a peak near 4 GeV.
What would settle it
Recompute the proton and quark chemical potentials from the same decay-corrected ratios using a different accepted freeze-out temperature parameterization, such as separate temperatures for strange and non-strange particles; if the maximum near 4 GeV vanishes under that alternative, the peak is an artifact of the single-temperature curve rather than a physical energy scale.
Extended reading notes
Core claim
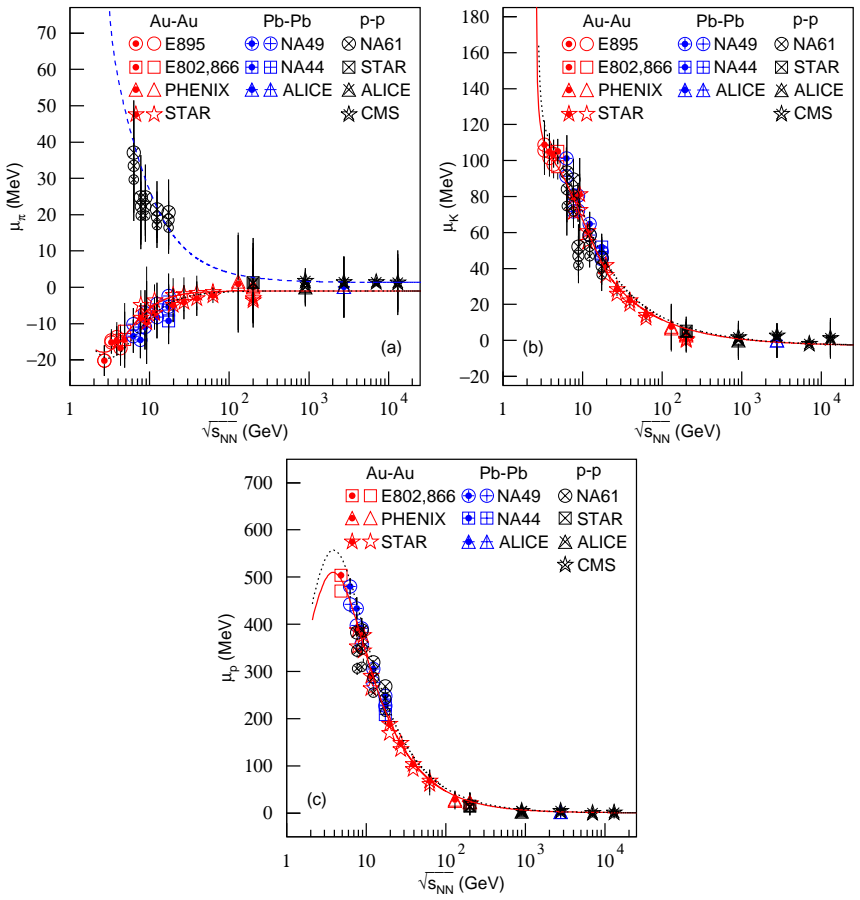
After correcting the measured yield ratios $k_\pi=\pi^-/\pi^+$, $k_K=K^-/K^+$, and $k_p=\bar p/p$ by removing strong-decay contributions from high-mass resonances and weak-decay contributions from heavy-flavor hadrons, the paper extracts chemical potentials from $k_j = \exp(-2\mu_j/T_{\rm ch})$, giving $\mu_j = -\tfrac12 T_{\rm ch}\ln k_j$ for particles and linear combinations of the $\ln k_j$ for quarks. Over $\sqrt{s_{NN}}$ from a few GeV to above 10 TeV, the energy-dependent $\mu_p$, $\mu_u$, $\mu_d$, and $\mu_s$ show a maximum at about 4 GeV, whereas $k_\pi$, $k_K$, $k_p$, $\mu_\pi$, and $\mu_K$ do not show such an extremum. The paper ties this scale to the onset of hadronic limiting fragmentation and to a possible liquid-to-gas-like transition of nucleons and mesons in central nucleus-nucleus collisions.
Load-bearing premise
The whole extraction rests on the empirical freeze-out temperature curve, which is assumed to hold for every collision system and energy in the study; if that curve is wrong or does not apply to proton-proton collisions, the 4 GeV maximum could move or disappear.
Editorial extensions
If this is right
- The 4 GeV maximum gives a specific energy to look for in beam-energy scans: particle and quark chemical potentials should change slope there even though the raw yield ratios do not.
- The extraction supplies a way to estimate up, down, and strange quark chemical potentials directly from measured particle ratios, not just the baryon chemical potential.
- At collision energies above the top RHIC energy, all extracted chemical potentials tend to zero and all ratios tend to one, so the method's predictions at the LHC are essentially vanishing potentials.
- In proton-proton collisions, where the freeze-out temperature is not measured, using $T_{\rm ch}$, $0.9T_{\rm ch}$, or $0.8T_{\rm ch}$ changes the size of the potentials but preserves the reported energy trends.
Reading between the lines
- Testing the same decay-corrected ratios with a different published freeze-out temperature curve would show whether the 4 GeV peak survives; if it does not, the peak is an artifact of the assumed $T_{\rm ch}$.
- A direct measurement of the freeze-out temperature in proton-proton collisions around 4 GeV, rather than an assumed fraction of $T_{\rm ch}$, would settle whether the peak in pp data is physical.
- The same formalism extends to D and B meson yield ratios, so charm and bottom quark chemical potentials could be extracted once those ratios are measured with decay corrections.
- Because the decay corrections come from a single published calculation, an independent calculation of primary-production ratios would test whether the corrections, not the data, create the peak.
Signed reviews
Editorial analysis
A structured set of objections, weighed in public.
Referee Report
Summary. The paper compiles published mid-rapidity yield ratios π-/π+, K-/K+, and anti-proton/proton from central Au-Au, central Pb-Pb, and pp collisions over √sNN from a few GeV to above 10 TeV, corrects them for strong and weak decay contributions using a recent statistical-thermal-model study [8], and then extracts particle chemical potentials μπ, μK, μp via Eq. (5) and quark chemical potentials μu, μd, μs via Eq. (6). The chemical freeze-out temperature Tch is taken from the empirical parametrization of Eq. (1). The central claim is that, unlike the monotonic yield ratios, the extracted μp, μu, μd, and μs exhibit a maximum at about 4 GeV, which the authors interpret as a possible limiting-fragmentation or phase-transition energy scale.
Significance. If the claimed ~4 GeV maximum in the extracted chemical potentials were robust, it would provide a potentially interesting energy-scale marker in heavy-ion freeze-out phenomenology, and the paper would offer a simple method for simultaneously determining light-particle and light-quark chemical potentials. The paper deserves credit for collecting a wide dataset, for explicitly separating decay-corrected and uncorrected ratios, and for clearly presenting the algebraic relations. However, the central claim is currently not established: the maximum is inherited from the assumed Tch parametrization rather than from the yield-ratio data, no uncertainties are propagated, and the fits that drive the conclusion have poor χ2. The paper's own treatment of pp collisions with Tch scaled by 0.9 and 0.8 shows that the extracted potentials are strongly Tch-dependent. With additional robustness checks, the result could become a useful observation, but as it stands the significance is limited.
major comments (3)
- [Sec. 3, Eq. (5), Eqs. (1) and (21)] The claimed maximum near 4 GeV in μp, μu, μd, and μs is not a property of the yield-ratio data alone, but is essentially imposed by the assumed Tch(s) of Eq. (1). Since μp = -(1/2)Tch ln kp and the fit of Eq. (21) gives ln kp ≈ -37.4 s^{-0.884} - 0.007, which is monotonic, the product Tch(s) s^{-0.884} has a maximum wherever d ln Tch/d ln s = 0.884. For the particular function in Eq. (1) that condition is satisfied near 4 GeV; a different, equally plausible Tch(s) would shift or remove the maximum. The paper itself acknowledges in Sec. 2 that the single-Tch scenario is adopted only because Eq. (1) is available. To support the abstract's central claim, the authors should demonstrate robustness by recomputing the potentials with alternative Tch parametrizations (e.g., from Refs. [3,4,35]) or by varying Tch by ±10%; if the maximum disappears or moves substantially, the claim should be reframed as a property of the assumed Tch model rather than of the data.
- [Sec. 3, Eqs. (15)–(21), Figs. 2–3] The extracted chemical potentials are presented without any statistical uncertainties. The fit to kp has χ2/dof = 7.7 for Au-Au (Eq. (20)) and 5.3 for Pb-Pb (Eq. (21)), indicating that the fitted curves do not describe the data within the quoted point-to-point scatter; the kK fits also have χ2/dof above 2 (Eqs. (18)–(19)). Because the µp, µu, µd, and µs curves in Figs. 2 and 3 are derived from these fits through Eqs. (5)–(6), the 4 GeV maximum is not shown to be statistically significant relative to fit uncertainty or data scatter. The authors should propagate the fit parameter uncertainties (and, ideally, the experimental uncertainties of the yield ratios) into the extracted potentials and display error bands or error bars in Figs. 2 and 3.
- [Sec. 2 and Sec. 3 (pp treatment)] The paper's treatment of pp collisions explicitly uses Tch, 0.9Tch, and 0.8Tch in Eq. (5) because the chemical freeze-out temperature is unavailable for pp, producing three sets of extracted potentials (Sec. 3, Fig. 2 caption). This is an explicit demonstration that the results depend sensitively on the assumed Tch value. The same sensitivity should be quantified for Au-Au and Pb-Pb, where Tch is also an external input from Eq. (1) rather than a measured quantity; the conclusion that the maximum at about 4 GeV is a common feature of central heavy-ion collisions cannot be evaluated without such a test.
minor comments (5)
- [Title] The title contains a typo: 'negative ly' should be 'negatively'.
- [Sec. 1 and Sec. 2] The phrase 'yield rations' appears in Sec. 1 and Sec. 2 and should read 'yield ratios'.
- [Sec. 3] In Sec. 3, 'absorbtion' should be 'absorption'.
- [Fig. 1 caption] The caption sentence describing the solid, dotted, and dashed curves for kπ is grammatically ambiguous: it says 'the solid (dotted) and dashed curves ... in central Au-Au (Pb-Pb) collisions without (with) the corrections of decays and in INEL or NSD pp collisions respectively', which can be read as three systems but only two curve styles. Please clarify which curve corresponds to which system and correction case.
- [Sec. 3, text near Eqs. (15)–(21)] The sentence 'According to the functions Eqs. (7)–(13), by using Eqs. (5) and (6)...' refers to the two- and multi-Tch formulas that are not used in the actual analysis; the text should refer to Eqs. (1), (3)–(6) instead to avoid confusion.
Circularity Check
No significant circularity: chemical potentials are derived from measured yield ratios and an external T_ch parametrization; the 4-GeV peak is model-dependent, not self-referential.
full rationale
The extraction chain is transparent: measured yield ratios k_pi, k_K, k_p (with decay corrections quoted from the independent work [8]) enter Eq. (5) via mu_j = -(1/2) T_ch ln k_j, and the freeze-out temperature T_ch in Eq. (1) is an external empirical parametrization attributed to [4,5,33-35], not fitted to the present paper's own data. Quark potentials in Eq. (6) are linear combinations of the same inputs, so there is no self-definition or fitted parameter renamed as a prediction. The reported maximum near 4 GeV is a derived consequence of multiplying a rising, saturating T_ch(s) by a falling ln k(s); this is model-dependent but not circular, because T_ch is not defined in terms of the extracted potentials and the yield ratios themselves are independent inputs. The paper explicitly acknowledges that a two- or multi-T_ch scenario is possible and that a single T_ch is used only because Eq. (1) is available, so no uniqueness claim is imported. Self-citations ([9], [32], [39], [44]) reproduce or complement standard formulas, but the load-bearing relations are also cited to independent literature ([1-4], [17], [34], [36-39]); the self-citations are not load-bearing. The sensitivity of the 4-GeV feature to the assumed T_ch(s) is a robustness/correctness concern, not circularity.
Assumptions & free parameters
free parameters (9)
- Tlim (limiting temperature) =
0.16 GeV
- kpi fit parameters, Au-Au (Eq. 15) =
A=4.212±0.682, b=1.799±0.152, C=1.012±0.019
- kpi fit parameters, Pb-Pb (Eq. 16) =
A=3.712±0.611, b=1.519±0.148, C=1.012±0.019
- kpi fit parameters, pp (Eq. 17) =
A=-2.453±0.292, b=0.943±0.057, C=0.984±0.009
- kK fit parameters, solid curve (Eq. 18) =
Segment 1: -0.291, 0.306; Segment 2: -2.172, 0.554, 1.039
- kK fit parameters, dotted curve (Eq. 19) =
Segment 1: -0.299, 0.299; Segment 2: -2.372, 0.554, 1.039
- kp fit parameters, Au-Au (Eq. 20) =
34.803±3.685, 0.896±0.041, 0.008±0.004
- kp fit parameters, Pb-Pb (Eq. 21) =
37.403±3.776, 0.884±0.036, 0.007±0.003
- Tch scaling factors for pp =
1.0, 0.9, 0.8
assumptions (4)
- domain assumption Boltzmann approximation and grand-canonical ensemble for non-interacting hadron gas
- domain assumption Single chemical freeze-out temperature Tch described by Eq. (1)
- domain assumption Decay corrections from Ref. [8] are applicable to the compiled yield ratios
- domain assumption Neglect of difference between chemical potentials of negatively and positively charged particles and between quarks and antiquarks
Cite this review
Pith. "Pith review of Light particle and quark chemical potentials from negatively to positively charged particle yield ratios corrected by removing strong and weak decays." pith.science (2026). https://pith.science/paper/K5VPPABC
@misc{pith2026190804678,
  author       = {Pith},
  title        = {Pith review of: Light particle and quark chemical potentials from negatively to positively charged particle yield ratios corrected by removing strong and weak decays},
  year         = {2026},
  howpublished = {\url{https://pith.science/paper/K5VPPABC}},
  note         = {Machine review of arXiv:1908.04678}
}
abstract
The yield ratios of negatively to positively charged pions ($\pi^-/\pi^+$), negatively to positively charged kaons ($K^-/K^+$), and anti-protons to protons ($\bar p/p$) produced in mid-rapidity interval in central gold-gold (Au-Au) collisions, central lead-lead (Pb-Pb) collisions, and inelastic (INEL) or non-single-diffractive (NSD) proton-proton ($pp$) collisions, as well as in forward rapidity region in INEL $pp$ collisions are analyzed in the present work. Over an energy range from a few GeV to above 10 TeV, the chemical potentials of light flavor particles (pion, kaon, and proton) and quarks (up, down, and strange quarks) are extracted from the mentioned yield ratios in which the contributions of strong decay from high-mass resonance and weak decay from heavy flavor hadrons are removed. Most energy dependent chemical potentials show the maximum at about 4 GeV, while the energy dependent yield ratios do not show such an extremum.
Figures


Reference graph
Works this paper leans on
- [8]
-
[1]
J. Cleymans, B. K¨ ampfer, and S. Wheaton, Phys. Rev. C, 65: 027901 (2002)
work page 2002
-
[2]
F. Becattini, J. Manninen, and M. Ga´ zdzicki, Phys. Rev. C, 73: 044905 (2006)
work page 2006
-
[3]
A. Andronic, P. Braun-Munzinger, K. Redlich, and J. Stachel, Nucl. Phys. A, 789: 334 (2007)
work page 2007
-
[4]
J. Cleymans, H. Oeschler, K. Redlich, and S. Wheaton, Phys. Rev. C, 73: 034905 (2006)
work page 2006
-
[5]
A. Andronic, P. Braun-Munzinger, and J. Stachel, Nucl. Phys. A, 834: 237c (2010)
work page 2010
-
[6]
Adamczyk et al (STAR Collaboration), Phys
L. Adamczyk et al (STAR Collaboration), Phys. Rev. C, 96: 044904 (2017)
work page 2017
-
[7]
Bellwied, EPJ Web Conf., 171: 02006 (2018)
R. Bellwied, EPJ Web Conf., 171: 02006 (2018)
work page 2018
Show all 46 references
-
[9]
Lao, Y.-Q
H.-L. Lao, Y.-Q. Gao, and F.-H. Liu, Universe, 5: 152 (2019)
2019
-
[10]
J. L. Klay et al (E895 Collaboration), Phys. Rev. C, 68: 054905 (2003)
2003
-
[11]
Ahle et al (E866/E917 Collaboration), Phys
L. Ahle et al (E866/E917 Collaboration), Phys. Lett. B, 490: 53 (2000)
2000
-
[12]
J. L. Klay et al (E895 Collaboration), Phys. Rev. Lett., 88: 102301 (2002)
2002
-
[13]
Akiba for the E802 Collaboration, Nucl
Y. Akiba for the E802 Collaboration, Nucl. Phys. A, 610: 139c (1996)
1996
-
[14]
Ahle et al (E802 Collaboration), Phys
L. Ahle et al (E802 Collaboration), Phys. Rev. C, 57: 466(R) (1998)
1998
-
[15]
Adcox et al (PHENIX Collaboration), Phys
K. Adcox et al (PHENIX Collaboration), Phys. Rev. C, 69: 024904 (2004)
2004
-
[16]
Adcox et al (PHENIX Collaboration), Phys
K. Adcox et al (PHENIX Collaboration), Phys. Rev. Lett., 88: 242301 (2002)
2002
-
[17]
S. S. Adler et al (PHENIX Collaboration), Phys. Rev. C, 69: 034909 (2004)
2004
-
[18]
Abelev et al (STAR Collaboration), Phys
B. Abelev et al (STAR Collaboration), Phys. Rev. C, 81: 024911 (2010)
2010
-
[19]
Abelev et al (STAR Collaboration), Phys
B. Abelev et al (STAR Collaboration), Phys. Rev. C, 79: 034909 (2009)
2009
-
[20]
Adams et al (STAR Collaboration), Phys
J. Adams et al (STAR Collaboration), Phys. Rev. Lett., 92: 112301 (2004)
2004
-
[21]
Alt et al (NA49 Collaboration), Phys
C. Alt et al (NA49 Collaboration), Phys. Rev. C, 77: 024903 (2008)
2008
-
[22]
S. V. Afanasiev et al (NA49 Collaboration), Phys. Rev. C, 66: 054902 (2002)
2002
-
[23]
Alt et al (NA49 Collaboration), Phys
C. Alt et al (NA49 Collaboration), Phys. Rev. C, 73: 044910 (2006)
2006
-
[24]
S. V. Afanasiev et al (NA49 Collaboration), Phys. Rev. C, 69: 024902 (2004)
2004
-
[25]
I. G. Bearden et al (NA44 Collaboration), Phys. Rev. C, 66: 044907 (2002)
2002
-
[26]
Abelev et al (ALICE Collaboration), Phys
B. Abelev et al (ALICE Collaboration), Phys. Rev. C, 88: 044910 (2013)
2013
-
[27]
Aduszkiewicz et al (NA61/SHINE Collaboration), Eur
A. Aduszkiewicz et al (NA61/SHINE Collaboration), Eur. Phys. J. C, 77: 671 (2017)
2017
-
[28]
B. I. Abelev et al (STAR Collaboration), Phys. Rev. C, 75: 064901 (2007)
2007
-
[29]
Aamodt et al (ALICE Collaboration), Eur
K. Aamodt et al (ALICE Collaboration), Eur. Phys. J. C, 71: 1655 (2011)
2011
-
[30]
Chatrchyan et al (CMS Collaboration), Eur
S. Chatrchyan et al (CMS Collaboration), Eur. Phys. J. C, 72: 2164 (2012) 10
2012
-
[31]
A. M. Sirunyan et al (CMS Collaboration), Phys. Rev. D, 96: 112003 (2017)
2017
-
[32]
Gao, H.-L
Y.-Q. Gao, H.-L. Lao, and F.-H. Liu, Adv. High Energy Phys., 2018: 6047960 (2018)
2018
-
[33]
Andronic, P
A. Andronic, P. Braun-Munzinger, and J. Stachel, Acta Phys. Pol. B, 40: 1005 (2009)
2009
-
[34]
Andronic, P
A. Andronic, P. Braun-Munzinger, and J. Stachel, Nucl. Phys. A, 772: 167 (2006)
2006
-
[35]
Andronic, P
A. Andronic, P. Braun-Munzinger, K. Redlich, and J. Stachel, Nature, 561: 321 (2018)
2018
-
[36]
P. Koch, J. Rafelski, and W. Greiner, Phys. Lett. B, 123: 151 (1983)
1983
-
[37]
Braun-Munzinger, D
P. Braun-Munzinger, D. Magestro, K. Redlich, and J. Stachel, Phys. Lett. B 518: 41 (2001)
2001
-
[38]
Arsene et al (BRAHMS Collaboration), Nucl
I. Arsene et al (BRAHMS Collaboration), Nucl. Phys. A, 757: 1 (2005)
2005
-
[39]
Zhao and F.-H
H. Zhao and F.-H. Liu, Adv. High Energy Phys., 2015: 137058 (2015)
2015
-
[40]
Chatterjee, S
S. Chatterjee, S. Das, L. Kumar, D. Mishra, B. Mo- hanty, R. Sahoo, and N. Sharma, Adv. High Energy Phys., 2015: 349013 (2015)
2015
-
[41]
Chatterjee, B
S. Chatterjee, B. Mohanty, and R. Singh, Phys. Rev. C, 92: 024917 (2015)
2015
-
[42]
Chatterjee and B
S. Chatterjee and B. Mohanty, Phys. Rev. C, 90: 034908 (2014)
2014
-
[43]
Thakur, S
D. Thakur, S. Tripathy, P. Garg, R. Sahoo, and J. Cley- mans, Adv. High Energy Phys., 2016: 4149352 (2016)
2016
-
[44]
Lao, H.-R
H.-L. Lao, H.-R. Wei, F.-H. Liu, and R. A. Lacey, Eur. Phys. J. A, 52: 203 (2016)
2016
-
[45]
Lindfors (edited), Introduction to Joint Institute for Nuclear Research, Dubna, USSR, 1980, p.41 (unpub- lished)
O. Lindfors (edited), Introduction to Joint Institute for Nuclear Research, Dubna, USSR, 1980, p.41 (unpub- lished)
1980
-
[46]
M. I. Adamovich et al (EMU01 Collaboration), Phys. Rev. Lett., 62: 2801 (1989) 11
1989
Reviewed August 14, 2026 · model on record in the stance chip above.
Discussion (0). Continue with ORCID to comment.