REVIEW 5 major objections 4 minor 9 references
Deep Learning-Based Classification of Hyperkinetic Movement Disorders in Children
T0 review · 5 major / 4 minor · reviewed 2026-08-12 · deepseek-v4-flash
Pith's one-line read A graph-LSTM network separates childhood dystonia from chorea in video with 85% accuracy.
desk verdict The reported 85% accuracy is inflated by clip-level splitting that leaks patient identity, but the task, the released data, and the honest limitations write-up make this worth a serious revision rather than a desk reject. read the letter →
The pith
A machine-rendered reading of the paper's core claim, the machinery that carries it, and where it could break.
The reading
What carries the argument
The machinery is a two-stream spatial-temporal network with an interpretability layer. Its input is a matrix of $x,y$ coordinates for 25 body keypoints, extracted by OpenPose, over 75 consecutive frames, ordered as a travelling sequence so joints that move together are adjacent. A spatial stream uses fully connected layers to encode five body parts, self-attention to weight the parts, and a graph convolutional network to model relationships between non-adjacent parts such as arm-leg coordination. A temporal stream uses four bidirectional LSTM layers to capture how joint positions evolve, with self-attention over frames. The two streams are fused by a multi-head attention layer before fully connected layers and a SoftMax output. Focal Loss with $\alpha=0.1$ and bootstrapped oversampling compensate for class imbalance, and the learned attention scores are visualised as colour-coded body parts plus a temporal attention bar.
What would settle it
Take the released code and data, rebuild the same model, and hold out all clips of entire patients—not individual clips—when testing. If test accuracy drops toward chance (50%) or substantially below the reported 85%, the paper's generalization claim would be refuted; if accuracy stays near 85%, the claim survives.
Extended reading notes
Core claim
On the paper's own terms, the discovery is a new application: automated, interpretable classification of pediatric hyperkinetic movement disorders from pose-extracted video. Using 50 baseline recordings (31 chorea-predominant, 19 dystonia-predominant) of a standardized outstretched-arm task, the authors convert OpenPose keypoint coordinates into a spatiotemporal input of 25 joints over 75 frames. The spatial branch encodes five body parts with shared-weight fully connected layers and a graph convolutional network; the temporal branch stacks four bidirectional LSTM layers; self-attention and multi-head attention weight parts, frames, and the merged representation. On the best configuration, sampled at 15 fps, the model achieves 85% accuracy, 81% F1, 81% sensitivity, and 88% specificity, with the paper's bootstrap confidence intervals and p-values indicating these are significantly above chance. The attention maps are offered as evidence that the model learned clinically meaningful movement patterns: sustained arm posturing in dystonia, diffuse multi-body attention in chorea, and misclassifications tied to occlusions, subtle or mixed presentations, and voluntary movements.
Load-bearing premise
The load-bearing premise is that the train/validation/test split keeps every video clip from the same child in the same side of the split; if clips from one child appear in both training and test, the 85% figure could reflect patient-specific signatures rather than generalization to new patients.
Editorial extensions
If this is right
- A clinical deployment of this pipeline would turn a short, simple motor task into a quantitative readout, letting non-specialist centers flag children who need a movement-disorder workup instead of waiting years for expert review.
- The attention maps provide a checkable rationale: each automated diagnosis could be reviewed by looking at which frames and body parts the model considered decisive, making the tool more acceptable in clinical workflows than a black box.
- The 15 fps optimum gives future data collection a concrete protocol: record or downsample at 15 fps to save storage and compute while keeping the information the network needs.
- Because the spatial and temporal pathways are modular, the same architecture can be retrained for other hyperkinetic disorders or for tracking severity over time, both directions the paper names as future work.
Reading between the lines
- Beyond the paper, the decisive next validation is a patient-level split: if clips from the same child appear in both training and test sets, part of the 85% could reflect memorized individual movement signatures, so rerunning with each child confined to one fold would quantify the true generalization.
- Beyond the paper, a natural stress test is to add healthy controls and mildly affected children, since the current cohort is drawn from severely affected patients referred for deep brain stimulation; the paper itself notes the model is not ready for a general population.
- Beyond the paper, the attention maps could be scored against independent clinician judgment—do the body parts the model highlights match the features a neurologist would cite for the same video?—turning visual plausibility into a measurable claim.
- Beyond the paper, because the pose tracker was trained on able-bodied movement, its keypoint errors in children with abnormal postures are a hidden variable; comparing model predictions against manual joint annotations on a subset of frames would show how sensitive the 85% is to pose-estimation quality.
Editorial analysis
A structured set of objections, weighed in public.
Referee Report
Summary. This manuscript presents a proof-of-concept deep learning model for differentiating dystonia from chorea in children using video-based pose data. The model combines a GCN-based spatial branch, a bidirectional LSTM temporal branch, and attention mechanisms, and is evaluated on 50 videos using OpenPose keypoints. The authors report 85% accuracy, 81% sensitivity, 88% specificity, and an F1 score of 0.811 at 15 fps, alongside qualitative attention-map analyses. The paper also makes its code and data publicly available.
Significance. Automated classification of pediatric hyperkinetic movement disorders is clinically relevant, and the proposed architecture is a reasonable approach for skeleton-based spatiotemporal classification. The explicit attention-map analysis is a valuable step toward interpretability, and the public repository strengthens reproducibility. However, the quantitative results are not reliable because the train/test split appears to be at the clip level rather than the patient level, and the statistical inference ignores patient clustering. Given the small single-center dataset and single-rater labels (acknowledged in Section 4.4), the current evidence does not establish that the model generalizes to new patients. If the evaluation is corrected, the work could be of interest, but the present manuscript's central claim is not supported.
major comments (5)
- [Section 2.4.2, Section 2.5.3, Table 3.1, Section 3.2] The evaluation split is described at the level of clips, not patients. Section 3.2 states that 45 patients were identified in the training set, while Table 3.1 reports 318 training clips and 88 test clips from a total of 50 videos. Unless the test set was deliberately restricted to the remaining 5 patients (which the paper never states), clips from the same patient appear in both training and test. Because videos of the same child share static cues such as body proportions, background, and OpenPose error patterns, the model can memorize patient-specific signatures rather than learn a generalizable movement signature. The reported 85% accuracy therefore does not support the claim of classification performance on unseen patients.
- [Section 2.5.3, Table 3.2] The evaluation protocol is internally inconsistent. Section 2.4.2 describes an 80/10/10 split, whereas Section 2.5.3 describes 5-fold cross-validation followed by fine-tuning and a final independent test set. Table 3.2 is captioned 'Cross-Validation Metrics' even though the text reports these as test-set metrics. Additionally, the 15 fps frame rate was selected after comparing test-set performance across frame rates, so the reported metrics are the best of multiple evaluations and the p-values do not account for this selection. The authors should specify the exact protocol, use a patient-disjoint holdout, and treat frame-rate selection as model selection.
- [Section 2.5.3, Table 3.2] The bootstrap confidence intervals and one-sample t-tests treat individual clips as independent units. Clips are nested within patients, and the effective sample size at the patient level is at most 50. This clustering violates the independence assumption and produces overconfident CIs and p-values. Inference should be performed at the patient level (e.g., cluster bootstrap, permutation test by patient, or mixed-effects model), and the baseline for the p-value should reflect the class imbalance and the number of distinct patients.
- [Sections 2.1.1, 3.1, Table 3.2] The class labeling is contradictory and makes sensitivity/specificity uninterpretable. Section 2.1.1 defines chorea as the negative class and dystonia as the positive class. Section 3.1 refers to 'dystonia-predominant HMDs (minority class)' but later states 'the minority class (chorea) compared to the majority class (dystonia)'. Table 3.2 reports Sensitivity=0.810 and Specificity=0.878, but without a consistent definition of the positive class, readers cannot tell which class these correspond to. The authors must define the reference class and report per-class performance.
- [Section 2.4.4, Table 2.1] The hyperparameter selection procedure is not fully specified and may bias the reported performance. Table 2.1 states that hyperparameters were 'tuned based on classification accuracy for the training dataset,' and Section 2.4.4 says the final model was evaluated on the test set after selecting the best hyperparameters. If the grid search used the test set (or the training set without a validation set), the reported accuracy is optimistically biased. Please clarify which data were used for model selection and whether a separate validation set was used.
minor comments (4)
- [Section 4.2] The qualitative analysis of attention maps is based on a small number of selected frames, and the claim that attention patterns are 'clinically meaningful' is not validated against independent clinician judgments or quantitative metrics. Please temper the claim or provide supporting evidence.
- [Section 2.1.2] The confidence threshold of 5% for keypoint detection is unusually low; please justify this choice, as low-confidence keypoints may degrade the input data.
- [Section 2.5.3] The section heading contains a typo: 'STatistical Ananlysis' should be 'Statistical Analysis'.
- [Section 3.2] The text says 'Figures 1-6 show frames' but the figures are numbered 3.4 through 3.7; please renumber or correct the references.
Circularity Check
Evaluation is partially circular because the clip-level split does not separate patients, so the reported 85% accuracy is not demonstrated on truly unseen children.
-
other
[Section 2.4.2 (Network Optimisation); Section 2.5.3 (Cross-validation and Statistical Analysis); Table 3.1; Section 3.2 (Attention Mapping)]
"The dataset was split using stratified sampling (80% training, 10% validation, 10% test) to preserve class distribution and ensure reliable evaluation. ... Out of 45 patients identified in the training set, 20 patients had all their respective video clips correctly identified, 17 were half or more of their respective video clips correctly identified and 7 patients were under half of their respective video clips correctly identified."
The split is at clip level, not patient level. With 50 videos total and 45 patients named in the training set, at most five patients can be entirely absent from training; most of the 88 test clips therefore come from children already seen during training. The model can memorize patient-specific static cues (body proportions, background, camera framing, and smoothed OpenPose tracking errors) shared across clips of the same video, so the reported 85% accuracy partly reflects within-patient memorization rather than generalization to new patients. Section 2.5.3's claim that the final model was tested on an independent test set 'to provide an unbiased assessment of the model’s performance on unseen data' is therefore not supported by the experimental design as described.
full rationale
This is an empirical machine-learning study, not a formal derivation, so most circularity patterns (self-definitional equations, self-citation chains, imported uniqueness theorems, ansatz smuggling, or renaming a known result) do not apply. The network is trained with focal loss on OpenPose keypoint matrices, and the reported 85% accuracy is a measured test-set statistic rather than a quantity defined to equal a fitted parameter. However, the central evaluation claim is partially circular because the data split is by clips within the same 50 videos, while Section 3.2 reveals that 45 patients appear in the training set. Test clips therefore substantially overlap with training patients, making the 'unseen data' evaluation not patient-independent. This is a leakage/evaluation-independence concern rather than an equation-level reduction, but it directly weakens the paper's headline generalization claim, so a moderate score of 4 is warranted. No load-bearing self-citation or definitional circularity was found.
Assumptions & free parameters
free parameters (6)
- focal loss alpha =
0.1
- focal loss gamma =
not reported in final text (searched over 0, 1, 2, 3, 5)
- learning rate =
one of 0.001 or 0.0001 (final not stated)
- weight decay =
one of 0.001, 0.0001, 0.00001 (final not stated)
- sampling frame rate =
15 fps
- network size hyperparameters (n_part, n_rnn) =
selected from Table 2.1 values; final values not clearly stated
assumptions (5)
- domain assumption OpenPose 2D keypoints accurately represent dystonia and chorea movements in children despite training predominantly on able-bodied adults.
- domain assumption A single consultant neurologist's clinical diagnosis is a reliable ground truth for chorea-predominant versus dystonia-predominant labels.
- ad hoc to paper 75 consecutive frames at the chosen sampling rate capture enough movement dynamics for classification.
- domain assumption The outstretched-arms task is sufficient to distinguish dystonia from chorea.
- domain assumption The GCN plus LSTM plus attention architecture from skeleton-based action recognition transfers to medical movement classification.
Cite this review
Pith. "Pith review of Deep Learning-Based Classification of Hyperkinetic Movement Disorders in Children." pith.science (2026). https://pith.science/paper/GODMQ5ZK
@misc{pith2026241115200,
  author       = {Pith},
  title        = {Pith review of: Deep Learning-Based Classification of Hyperkinetic Movement Disorders in Children},
  year         = {2026},
  howpublished = {\url{https://pith.science/paper/GODMQ5ZK}},
  note         = {Machine review of arXiv:2411.15200}
}
read the original abstract
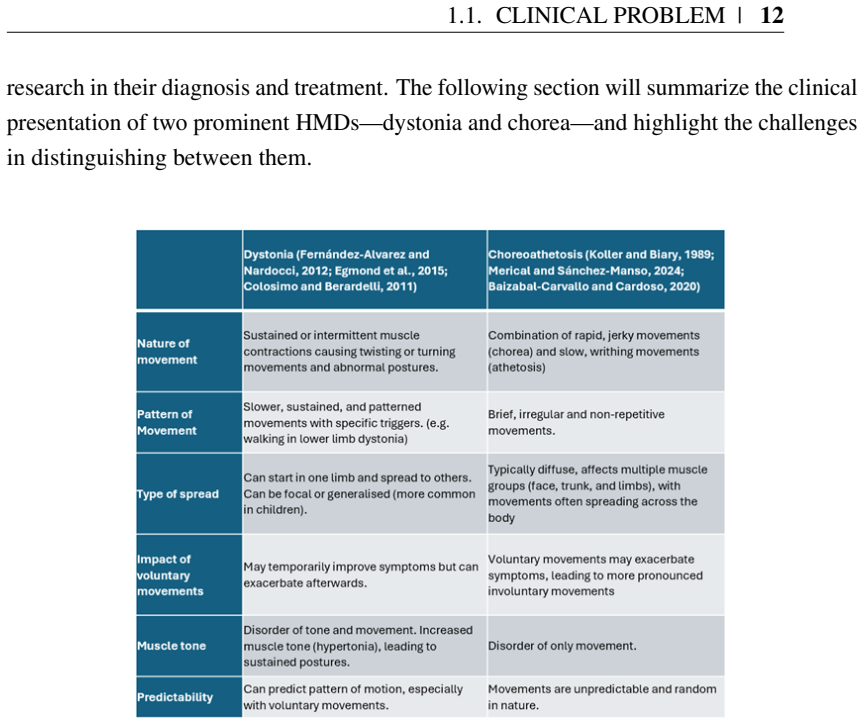
Hyperkinetic movement disorders (HMDs) in children, including dystonia (abnormal twisting) and chorea (irregular, random movements), pose significant diagnostic challenges due to overlapping clinical features. The prevalence of dystonia ranges from 2 to 50 per million, and chorea from 5 to 10 per 100,000. These conditions are often diagnosed with delays averaging 4.75 to 7.83 years. Traditional diagnostic methods depend on clinical history and expert physical examinations, but specialized tests are ineffective due to the complex pathophysiology of these disorders. This study develops a neural network model to differentiate between dystonia and chorea from video recordings of paediatric patients performing motor tasks. The model integrates a Graph Convolutional Network (GCN) to capture spatial relationships and Long Short-Term Memory (LSTM) networks to account for temporal dynamics. Attention mechanisms were incorporated to improve model interpretability. The model was trained and validated on a dataset of 50 videos (31 chorea-predominant, 19 dystonia-predominant) collected under regulatory approval from Guy's and St Thomas' NHS Foundation Trust. The model achieved 85% accuracy, 81% sensitivity, and 88% specificity at 15 frames per second. Attention maps highlighted the model's ability to correctly identify involuntary movement patterns, with misclassifications often due to occluded body parts or subtle movement variations. This work demonstrates the potential of deep learning to improve the accuracy and efficiency of HMD diagnosis and could contribute to more reliable, interpretable clinical tools.
Figures


Figures from the paper (11 more)


Reference graph
Works this paper leans on
-
[1]
Albanese, A. et al. (2006) A systematic review on the diagnosis and treatment of primary (idiopathic) dystonia and dystonia plus syndromes: report of an EFNS/MDS-ES Task Force. European Journal of Neurology. [Online] 13 (5), 433–444. [online]. Available from: https://onlinelibrary.wiley.com/doi/10.1111/j.1468-1331.2006.01537.x (Accessed 28 August 2024). A...
-
[10]
[online]. Avail- able from: https://www.frontiersin.org/articles/10.3389/frobt.2023.1108114 (Accessed 12 March 2024). Hara, K. et al. (2017) Learning Spatio-Temporal Features with 3D Residual Networks for Action Recognition. [online]. Available from: https://arxiv.org/abs/1708.07632 (Accessed 28 August 2024). He, K. et al. (2015a) Deep Residual Learning f...
arXiv 2017
-
[18]
Automated Learning Rate Scheduler for Large-batch Training
[online]. Available from: https://journalofbigdata.springeropen.com/ articles/10.1186/s40537-023-00876-4 (Accessed 28 August 2024). Kim, C. et al. (2021) Automated Learning Rate Scheduler for Large-batch Training. [on- line]. Available from: http://arxiv.org/abs/2107.05855 (Accessed 28 August 2024). Kim, W. et al. (2021) Ergonomic postural assessment usin...
work page Pith review arXiv 2021
-
[29]
[online]. Available from: http://www.dovepress.com/update-on-pediatric-dystonias- etiology-epidemiology-and-management-peer-reviewed-article-DNND (Accessed 21 Au- gust 2024). Gatto, E. M. et al. (2021) Worldwide barriers to genetic testing for movement disorders. European Journal of Neurology. [Online] 28 (6), 1901–1909. [online]. Available from: https://...
-
[59]
Available from: https://journals.lww.com/10.4103/0028-3886.226447 (Accessed 28 August 2024)
[online]. Available from: https://journals.lww.com/10.4103/0028-3886.226447 (Accessed 28 August 2024). Baratloo, A. et al. (2015) Part 1: Simple Definition and Calculation of Accuracy, Sensitiv- ity and Specificity. Emergency (Tehran, Iran). 3 (2), 48–49. Barry, M. J. et al. (1999) Reliability and responsiveness of the Barry–Albright Dystonia Scale. Devel...
-
[61]
Available from: https://www.mdpi.com/2409-9287/9/3/61 (Accessed 28 August 2024)
[online]. Available from: https://www.mdpi.com/2409-9287/9/3/61 (Accessed 28 August 2024). Defferrard, M. et al. (2016) ‘Convolutional neural networks on graphs with fast localized spectral filtering’, in Proceedings of the 30th International Conference on Neural Infor- mation Processing Systems. NIPS’16. 5 December 2016 Red Hook, NY , USA: Curran Associa...
arXiv 2016
-
[380]
Available from: https://www.mdpi.com/ 1999-5903/14/12/380 (Accessed 28 August 2024)
[online]. Available from: https://www.mdpi.com/ 1999-5903/14/12/380 (Accessed 28 August 2024). Cortes, C. et al. (2012) L2 Regularization for Learning Kernels. [online]. Available from: http://arxiv.org/abs/1205.2653 (Accessed 28 August 2024). Dahiru, T. (2011) P-Value, a true test of statistical significance? a cautionary note. An- nals of Ibadan Postgra...
arXiv 2012
-
[1558]
[online]. Available from: http://archneur.jamanetwork.com/article.aspx?doi=10.1001/archneurol.2012.574 (Accessed 28 August 2024). Vaswani, A. et al. (2023) Attention Is All You Need. [online]. Available from: http://arxiv.org/abs/1706.03762 (Accessed 28 August 2024). Washabaugh, E. P. et al. (2022) Comparing the accuracy of open-source pose estimation met...
arXiv 2023
Show all 9 references
-
[4111]
Available from: https://www.nature.com/articles/s41598- 022-08157-5 (Accessed 3 June 2024)
[online]. Available from: https://www.nature.com/articles/s41598- 022-08157-5 (Accessed 3 June 2024). Refaeilzadeh, P. et al. (2009) ‘Cross-Validation’, in Ling Liu & M. Tamer Özsu (eds.) Encyclopedia of Database Systems. [Online]. Boston, MA: Springer US. pp. 532–538. [online...
2009 arXiv
Reviewed August 12, 2026 · model on record in the stance chip above.
Discussion (0). Continue with ORCID to comment.