REVIEW 4 major objections 4 minor 1 cited by
Well log data generation and imputation using sequence-based generative adversarial networks
T0 review · 4 major / 4 minor · reviewed 2026-08-12 · deepseek-v4-flash
Pith's one-line read This paper claims that a two-model sequence-based GAN framework, pairing TSGAN for generation with SeqGAN for imputation, outperforms existing deep-learning baselines on well-log data.
desk verdict The paper applies two existing sequence GANs to Dutch well log data, but the headline claim of superior imputation accuracy is contradicted by the paper's own Table 5. read the letter →
The pith
A machine-rendered reading of the paper's core claim, the machinery that carries it, and where it could break.
The reading
What carries the argument
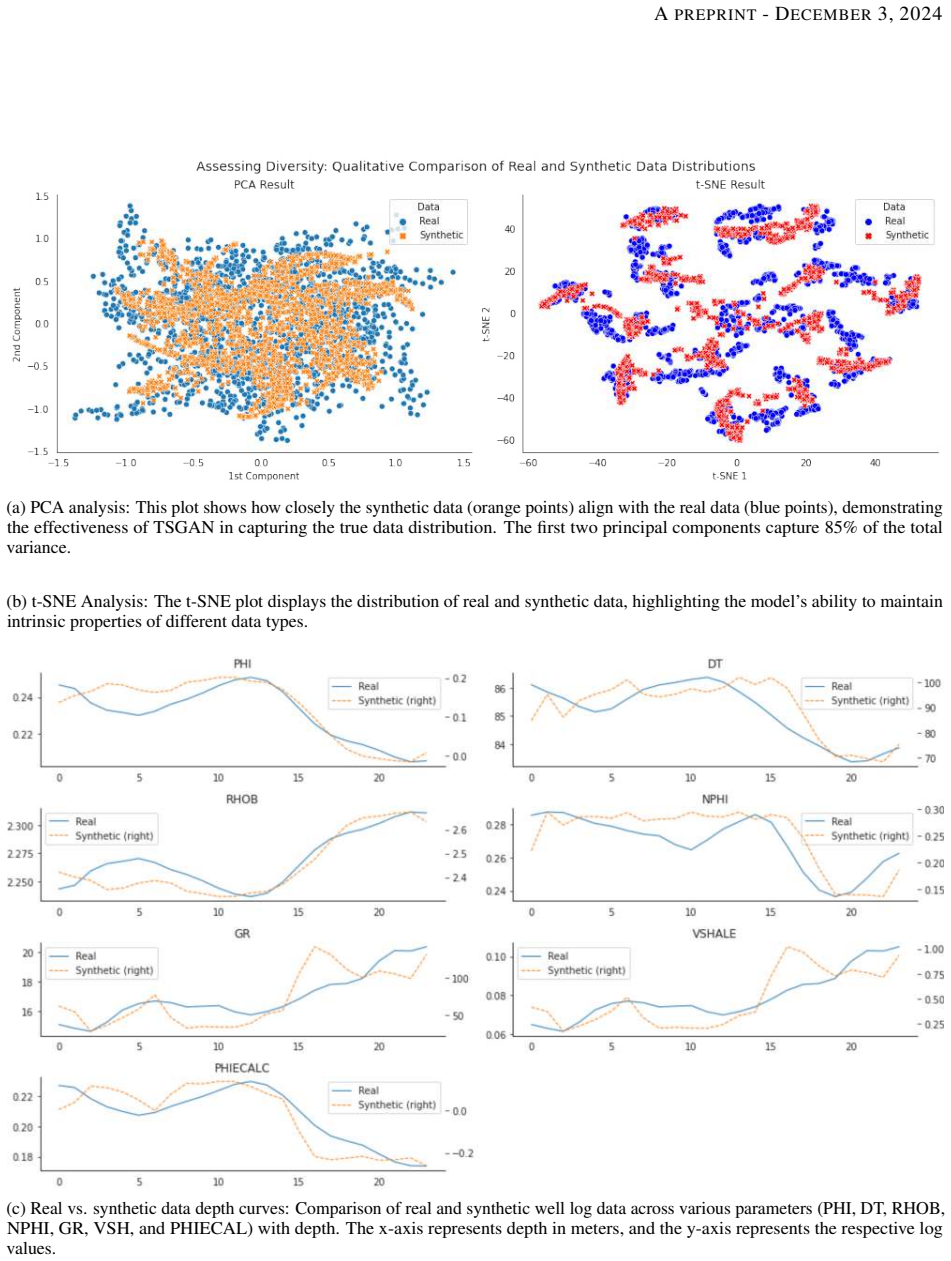
The machinery is the adversarial training loop applied to depth sequences rather than time series. TSGAN uses an embedding/recovery autoencoder, a generator, a discriminator, and a supervisor trained with adversarial, supervised, and moment losses to synthesize logs; SeqGAN casts imputation as a sequential decision problem where a generator predicts missing values and a discriminator scores the coherence of the completed sequence. The paper validates the generated data with PCA and t-SNE visualizations, KS tests, Pearson correlation, and KL divergence, and evaluates imputation with R², MAE, and MAPE.
What would settle it
Run the trained SeqGAN imputer on gaps that were not created by a random mask, such as intervals flagged as bad hole or tool failure in the same wells, and compare imputed values against original readings if available; if accuracy on those real operational gaps falls well below the R² of 0.9 reported on artificially masked sections, the benchmark claim fails. Also, repeating the 50-point experiment across different mask seeds would test stability, since the reported MAPE jumps from 0.005 to 151.154 across section sizes.
Extended reading notes
Core claim
The central claim, stated on the paper's own terms, is that a dual sequence-based GAN framework is superior to other deep-learning models for well-log imputation and synthetic generation. TSGAN generates gamma ray, sonic, neutron porosity, bulk density, and derived logs whose distributions match the real data, with KS test p-values around 0.4–0.65, Pearson correlations of 0.90–0.94, and low KL divergence, while SeqGAN imputes missing DT-log segments and, for 5- and 10-point gaps, achieves higher R² than the BRITS and NAOMI baselines. The authors extend this into a claim that the method sets a new benchmark for data integrity and utility in geoscience.
Load-bearing premise
The load-bearing assumption is that deliberately masking known stretches of the DT log with random masks reproduces how data goes missing in real wells, where gaps often stem from tool failure or bad hole conditions that may correlate with the rock properties being measured.
Editorial extensions
If this is right
- SeqGAN's reported R² of 0.866 on 5-point gaps and 0.921 on 10-point gaps, both above BRITS and NAOMI, means the method is most reliable for short missing stretches of a log.
- TSGAN's synthetic logs pass KS, Pearson, and KL checks, so they can stand in for real logs in training or augment sparse datasets.
- The framework handles data repair and data augmentation in one workflow, so a field team could fill gaps and enrich small training sets with the same learned representations.
- On 50-point gaps the advantage is not uniform: NAOMI has the higher R² (0.594 vs 0.574) while SeqGAN has the lower MAE (0.030 vs 0.032), so long-gap imputation remains the weaker part of the benchmark.
Reading between the lines
- The same dual-GAN recipe could transfer to other ordered borehole measurements, such as resistivity, image, or production logs, because the paper only demonstrates it on GR, DT, NPHI, RHOB, and derived curves.
- Because the gaps are created by random masks over known sections, the headline accuracy may be optimistic for field gaps caused by tool failure or bad hole conditions; a leave-one-well-out test on naturally missing intervals would settle this.
- The MAPE swing from 0.005 on 10-point gaps to 151.154 on 50-point gaps suggests the percentage error is dominated by a few near-zero values, so scaled or log-error metrics would give a more stable comparison.
- If synthetic logs continue to pass KS and KL checks across more wells and formations, TSGAN could become a data-augmentation engine for training petrophysical classifiers where labeled wells are scarce.
Editorial analysis
A structured set of objections, weighed in public.
Referee Report
Summary. The paper proposes a dual GAN framework for well log data: TSGAN for generating synthetic well log curves and SeqGAN for imputing missing depth intervals. The authors evaluate imputation performance against BRITS and NAOMI on artificially corrupted DT log sections of lengths 5, 10, and 50 points, reporting MAPE, MAE, and R2 values, and they claim in the abstract that the approach achieves superior accuracy and sets a new benchmark for data integrity in geosciences.
Significance. The application domain — generating and imputing well log data — is practically relevant, and the comparison against BRITS and NAOMI is a reasonable baseline choice. The paper also provides detailed hyperparameter tables and uses multiple evaluation metrics. However, the central empirical claim of the paper is contradicted by its own Table 5: the abstract's headline numbers are not the performance of a single proposed method but are taken from different models and different gap sizes. Because the load-bearing evidence does not support the claimed superiority, the paper cannot be accepted in its present form. The synthetic-generation component includes useful statistical checks (KS, PCC, KL), but the evaluation protocol for the imputation component is not sufficiently specified to rescue the central claim.
major comments (4)
- [Abstract and Table 5] The abstract reports R2 values of 0.921, 0.899, and 0.594 with MAPE values of 8.320, 0.005, and 151.154 as if they were achieved by the proposed framework. In Table 5, these values are the best entries from different models and different gap sizes: R2 0.921 and MAPE 8.320 are SeqGAN at length 10; R2 0.899 and MAPE 0.005 are BRITS at length 10; R2 0.594 and MAPE 151.154 are NAOMI at length 50. The abstract's claim of 'superior accuracy' is therefore not supported by the paper's own results; it mixes per-model best outcomes across rows and models.
- [Section 4.2.1, bullet on 5-point sections] The text states that for sections of length 5 the GAN model exhibits superior performance with the lowest MAPE and MAE values. Table 5 shows that BRITS has MAPE 0.004 while SeqGAN has MAPE 1.109, so the GAN does not have the lowest MAPE. For length 50, NAOMI has higher R2 (0.594 versus 0.574) and lower MAPE (151.154 versus 166.63) than SeqGAN. The written summary of Table 5 is inconsistent with the numeric results, and this inconsistency directly undermines the paper's central comparative claim.
- [Section 3.4.2 and Table 3] Table 3 reports an R2 value of 0.894544 for 'Real' data and 0.923233 for 'Synthetic' data. R2 is a comparison metric between predicted and observed values, not an intrinsic property of a single dataset, so it is unclear what the 'Real' row is comparing. Without a precise statement of the evaluation protocol (e.g., real data compared to itself, or real versus synthetic), the quantitative claim of synthetic-data fidelity is not interpretable and the conclusion that synthetic data has 'higher R2' than real data is meaningless.
- [Section 3.1 and Section 3.4.1] The imputation evaluation uses artificially corrupted 'specific depth ranges' and mask matrices, but the paper does not report the number of test wells, the number of corrupted sections per well, whether the same masks are used across models, or any variance/confidence estimates for the metrics in Table 5. All values are point estimates, and without this information the reader cannot assess whether the reported differences are meaningful or stable across random masks. This is a load-bearing methodological gap for an empirical comparison study.
minor comments (4)
- [Section 2.2.3, Eq. (5)] Equation (5) defines the generator loss as 'Adversarial Loss + Supervised Loss + 100 × sqrt(Supervised Loss)', which is dimensionally inconsistent and not a standard formulation. The authors should either correct the formula or explain the intended regularization term.
- [Section 4.2.2, Figure 10] The text's subplot references for Figure 10 are inconsistent with the figure caption: the text attributes Figure 10(b) to NAOMI and Figure 10(c) to GAN, while the caption labels 10(b) as GAN and 10(c) as NAOMI. This makes the qualitative comparison difficult to follow.
- [Section 2.3.2] SeqGAN is described as imputing continuous well log values, but the original SeqGAN [48] is formulated for discrete sequence generation with policy gradient and Monte Carlo rollouts. The paper does not describe how the generator, discriminator, and rewards are adapted to continuous well log imputation, so the method is not fully reproducible from the text.
- [Figure 4] The label 'Data premutation & window selection' contains a typo; it should read 'Data permutation & window selection'.
Circularity Check
No load-bearing circularity: the imputation claim rests on empirical held-out tests; the only soft circularity is the TSGAN fidelity check reusing its own training objective.
-
fitted input called prediction
[Section 2.2.3 (loss functions) vs Section 4.1.3 / Table 4 (fidelity evaluation)]
"Moment Loss (LM): Focuses on matching the statistical moments of the real and synthetic data. In this study, we consider the 1st (mean) and 2nd (variance) moments. ... The KS test results show no significant difference between the distributions of real and synthetic data [35]."
The TSGAN training loss explicitly enforces distributional matching: the supervised loss compares generated sequences against real sequences, and the moment loss matches the 1st and 2nd moments of real and synthetic data. Consequently, the KS, PCC, and KL metrics reported in Table 4 measure the same distributional closeness that the training objective was designed to maximize; the 'high fidelity' conclusion is partly a restatement that training succeeded, not an independent prediction on unseen data. This is minor because the paper's central imputation claim rests on Table 5 (held-out corrupted sections), which is not circular.
full rationale
The paper's central claim of superior imputation accuracy is an empirical comparison on artificially corrupted DT-log sections, with metrics computed against the original values; that procedure is not circular. The model citations for TSGAN and SeqGAN point to external prior work, and the authors' own cited papers are background only. There is no uniqueness theorem, no ansatz smuggled via citation, and no renaming of a known result. The only mildly circular element is the synthetic-fidelity evaluation: TSGAN is trained with supervised and moment losses designed to match the real distribution, and the KS/PCC/KL checks in Table 4 then confirm that same distribution match, so the reported fidelity partly reduces to the training objective. This does not affect the main imputation benchmark. The abstract's headline numbers mix NAOMI, SeqGAN, and BRITS entries from different rows of Table 5 (e.g., R2 0.921 is SeqGAN at 10 points, 0.899 is BRITS at 10 points, 0.594 is NAOMI at 50 points), so the claimed superiority is internally inconsistent with the paper's own table; that is a correctness and reporting problem, not circularity, and does not change the circularity score.
Assumptions & free parameters
free parameters (4)
- Outlier removal fraction =
~10% of points per well
- TSGAN supervised loss weight =
100 (in Eq. 5)
- TSGAN sequence length and hidden size =
24
- SeqGAN training schedule =
Pretrain 2000 iterations, train 1000; policy lr 3e-6, discount 1e-3
assumptions (4)
- domain assumption TSGAN and SeqGAN, originally designed for time-series or discrete sequences, transfer to continuous depth-series well log data with adaptation.
- domain assumption Randomly masking known DT values simulates realistic well log missingness.
- ad hoc to paper Removing about 10% of each well as outliers improves data quality without biasing downstream results.
- domain assumption Per-log metrics averaged across logs remain meaningful for evaluating imputation.
Cite this review
Pith. "Pith review of Well log data generation and imputation using sequence-based generative adversarial networks." pith.science (2026). https://pith.science/paper/TC5XTK5M
@misc{pith2026241200718,
  author       = {Pith},
  title        = {Pith review of: Well log data generation and imputation using sequence-based generative adversarial networks},
  year         = {2026},
  howpublished = {\url{https://pith.science/paper/TC5XTK5M}},
  note         = {Machine review of arXiv:2412.00718}
}
read the original abstract
Well log analysis is crucial for hydrocarbon exploration, providing detailed insights into subsurface geological formations. However, gaps and inaccuracies in well log data, often due to equipment limitations, operational challenges, and harsh subsurface conditions, can introduce significant uncertainties in reservoir evaluation. Addressing these challenges requires effective methods for both synthetic data generation and precise imputation of missing data, ensuring data completeness and reliability. This study introduces a novel framework utilizing sequence-based generative adversarial networks (GANs) specifically designed for well log data generation and imputation. The framework integrates two distinct sequence-based GAN models: Time Series GAN (TSGAN) for generating synthetic well log data and Sequence GAN (SeqGAN) for imputing missing data. Both models were tested on a dataset from the North Sea, Netherlands region, focusing on different sections of 5, 10, and 50 data points. Experimental results demonstrate that this approach achieves superior accuracy in filling data gaps compared to other deep learning models for spatial series analysis. The method yielded R^2 values of 0.921, 0.899, and 0.594, with corresponding mean absolute percentage error (MAPE) values of 8.320, 0.005, and 151.154, and mean absolute error (MAE) values of 0.012, 0.005, and 0.032, respectively. These results set a new benchmark for data integrity and utility in geosciences, particularly in well log data analysis.
Figures


Figures from the paper (7 more)





Forward citations
Cited by 1 Pith paper
-
Leveraging Time-Series Foundation Model for Subsurface Well Logs Prediction and Anomaly Detection
Fine-tuned TimeGPT forecasts some well logs reasonably, but the claimed 93% anomaly detection accuracy is contradicted by ROC-AUC near 0.51 and MCC near zero.
Reference graph
Works this paper leans on
-
[1]
O. Akinnikawe, S. Lyne, and J. Roberts. Synthetic well log generation using machine learning techniques. In SPE/AAPG/SEG Unconventional Resources Technology Conference 2018, URTC 2018 , page 4, 2018. https://doi.org/10.15530/urtec-2018-2877021
-
[2]
N. M. Al-Areeq and A. S. Alaug. Well log analysis and hydrocarbon potential of the Sa’ar-Nayfa reservoir, Hiswah Oilfield, eastern Yemen. Arabian Journal of Geosciences, 7(7), 2014. https://doi.org/10.1007/s12517- 013-1003-5
doi:10.1007/s12517- 2014
-
[3]
A. Al-Fakih, A. F. Ibrahim, S. Elkatatny, and A. Abdulraheem. Estimating electrical resistivity from logging data for oil wells using machine learning. Journal of Petroleum Exploration and Production Technology, 13(6), 2023. https://doi.org/10.1007/s13202-023-01617-2
-
[4]
A. Al-Fakih, S. I. Kaka, and A. I. Koeshidayatullah. Reservoir Property Prediction in the North Sea Using Machine Learning. IEEE Access, 11, 2023. https://doi.org/10.1109/ACCESS.2023.3336623
arXiv 2023
-
[5]
N. Ali, J. Chen, X. Fu, W. Hussain, M. Ali, M. Hussain, A. Anees, M. Rashid, and H. V . Thanh. Prediction of Cretaceous reservoir zone through petrophysical modeling: Insights from Kadanwari gas field, Middle Indus Basin. Geosystems and Geoenvironment, 1(3), 2022. https://doi.org/10.1016/j.geogeo.2022.100058
arXiv 2022
-
[6]
J. S. Armstrong and F. Collopy. Error measures for generalizing about forecasting methods: Empirical comparisons. International Journal of Forecasting, 8(1), pages 69–80, 1992. https://doi.org/10.1016/0169- 2070(92)90008-W
doi:10.1016/0169- 1992
-
[7]
A. E. Bakhshipour, A. Koochali, U. Dittmer, A. Haghighi, S. Ahmad, and A. Dengel. A Bayesian Generative Adversarial Network (GAN) to Generate Synthetic Time-Series Data, Application in Combined Sewer Flow Prediction. arXiv preprint arXiv:2301.13733, 2023
work page Pith review arXiv 2023
-
[8]
J. Benesty, J. Chen, Y . Huang, and I. Cohen. Pearson Correlation Coefficient. In Noise Reduction in Speech Processing, pages 37–40, 2009. https://doi.org/10.1007/978-3-642-00296-0_5
Show all 51 references
-
[9]
L. A. Blanes de Oliveira and C. de Carvalho Carneiro. Synthetic geochemical well logs generation using ensemble machine learning techniques for the Brazilian pre-salt reservoirs. Journal of Petroleum Science and Engineering, 196, 2021. https://doi.org/10.1016/j.petrol.2020.108080
2021
-
[10]
W. Cao, D. Wang, J. Li, H. Zhou, L. Li, and Y . Li. BRITS: Bidirectional recurrent imputation for time series. Neural Information Processing Systems, 2018. https://api.semanticscholar.org/CorpusID:44119917
2018
-
[11]
Y . Chen, Y . Wang, D. Kirschen, and B. Zhang. Model-Free Renewable Scenario Genera- tion Using Generative Adversarial Networks. IEEE Transactions on Power Systems , 33(3), 2018. https://doi.org/10.1109/TPWRS.2018.2794541
2018
-
[12]
T. Darling. Well Logging and Formation Evaluation. In Well Logging and Formation Evaluation, pages 215–217,
-
[13]
A. G. Doré and B. A. Vining. Petroleum geology: North-West Europe and global perspectives—Proceedings of the 6th Petroleum Geology Conference. Geological Society of London, 2005. https://doi.org/10.1144/006
2005 doi
-
[14]
R. Feng, D. Grana, and N. Balling. Imputation of missing well log data by random forest and its uncertainty analysis. Computers and Geosciences, 152, 2021. https://doi.org/10.1016/j.cageo.2021.104763
2021
-
[15]
I. J. Goodfellow, J. Pouget-Abadie, M. Mirza, B. Xu, D. Warde-Farley, S. Ozair, A. Courville, and Y . Bengio. Gen- erative Adversarial Nets. In Proceedings of the 27th International Conference on Neural Information Processing Systems (NIPS’14), pages 2672–2680, MIT Press, 2014...
2014
-
[16]
H. M. A., N. D. Nur, N. Md Tahir, Z. I. A. Latiff, M. H. Jusoh, and Y . Akimasa. Missing data imputation of MAGDAS-9’s ground electromagnetism with supervised machine learning and conventional statistical analysis models. Alexandria Engineering Journal, 61(1), 2022. https://do...
2022 doi
-
[17]
Hallam, D
A. Hallam, D. Mukherjee, and R. Chassagne. Multivariate imputation via chained equations for elastic well log imputation and prediction. Applied Computing and Geosciences , 14, 2022. https://doi.org/10.1016/j.acags.2022.100083
2022
-
[18]
T. M. Hossain, J. Watada, Z. Jian, H. Sakai, S. Rahman, and I. A. Aziz. Missing well log data handling in complex lithology prediction: An nis apriori algorithm approach. International Journal of Innovative Computing, Information and Control, 16(3), 2020. https://doi.org/10.24...
2020 doi
-
[19]
Huang, P
T. Huang, P. Chakraborty, and A. Sharma. Deep convolutional generative adversarial networks for traffic data imputation encoding time series as images. International Journal of Transportation Science and Technology, 12(1), 2023. https://doi.org/10.1016/j.ijtst.2021.10.007
2023 doi
-
[20]
R. J. Hyndman and A. B. Koehler. Another look at measures of forecast accuracy. International Journal of Forecasting, 22(4), pages 679–688, 2006. https://doi.org/10.1016/j.ijforecast.2006.03.001
2006 doi
-
[21]
M. S. Jamshidi Gohari, M. E. Niri, S. Sadeghnejad, and J. Ghiasi-Freez. Synthetic Graphic Well Log Generation Using an Enhanced Deep Learning Workflow: Imbalanced Multiclass Data, Sample Size, and Scalability Challenges. SPE Journal, 29, 2024. https://doi.org/10.2118/217466-PA
2024 doi
-
[22]
Juneja, S
T. Juneja, S. B. Bajaj, and N. Sethi. Synthetic Time Series Data Generation Using Time GAN with Synthetic and Real-Time Data Analysis. Lecture Notes in Electrical Engineering , 1011 LNEE, 2023. https://doi.org/10.1007/978-981-99-0601-7_51
2023 doi
-
[23]
S. I. Khan and A. S. M. L. Hoque. SICE: an improved missing data imputation technique. Journal of Big Data, 7(1), 2020. https://doi.org/10.1186/s40537-020-00313-w
2020 doi
-
[24]
S. Kim, K. H. Kim, B. Min, J. Lim, and K. Lee. Generation of Synthetic Density Log Data Using Deep Learning Algorithm at the Golden Field in Alberta, Canada. Geofluids, 2020. https://doi.org/10.1155/2020/5387183
2020 doi
-
[25]
Klopries and A
H. Klopries and A. Schwung. ITF-GAN: Synthetic time series dataset generation and manipulation by inter- pretable features. Knowledge-Based Systems, 283, 2024. https://doi.org/10.1016/j.knosys.2023.111131
2024
-
[26]
Kullback and R
S. Kullback and R. A. Leibler. On Information and Sufficiency. The Annals of Mathematical Statistics, 22(1), pages 79–86, 1951. https://doi.org/10.1214/aoms/1177729694
1951
-
[27]
F. I. Kurniadi, R. C. Rohmana, and L. Taufani. Local mean imputation for handling miss- ing value to provide more accurate facies classification. Procedia Computer Science , 216, 2022. https://doi.org/10.1016/j.procs.2022.12.140
2022 doi
-
[28]
J. Lai, X. Pang, X. Zhao, Y . Zhao, G. Wang, Y . Huang, H. Li, and Y . Li. Typical misinterpreta- tions and scientific concepts in well-logging geologic studies. Natural Gas Industry B , 10(2), 2023. https://doi.org/10.1016/j.ngib.2023.02.003
2023 doi
-
[29]
J. Lai, G. Wang, S. Wang, J. Cao, M. Li, X. Pang, C. Han, X. Fan, L. Yang, Z. He, and Z. Qin. A review on the applications of image logs in structural analysis and sedimentary characterization. Marine and Petroleum Geology, 95, 2018. https://doi.org/10.1016/j.marpetgeo.2018.04.020
2018 doi
-
[30]
D. Li, D. Chen, B. Jin, L. Shi, J. Goh, and S. K. Ng. MAD-GAN: Multivariate Anomaly Detection for Time Series Data with Generative Adversarial Networks. Lecture Notes in Computer Science (Including Subseries Lecture Notes in Artificial Intelligence and Lecture Notes in Bioinfo...
2019 doi
-
[31]
W. C. Lin and C. F. Tsai. Missing value imputation: a review and analysis of the literature (2006–2017).Artificial Intelligence Review, 53(2), 2020. https://doi.org/10.1007/s10462-019-09709-4
2006 doi
-
[32]
G. Liu. Challenges and countermeasures of log evaluation in unconventional petroleum exploration and development. Shiyou Kantan Yu Kaifa/Petroleum Exploration and Development , 48(5), 2021. https://doi.org/10.11698/PED.2021.05.02
2021 doi
-
[33]
Y . Liu, R. Yu, S. Zheng, E. Zhan, and Y . Yue. NAOMI: Non-autoregressive multiresolution sequence imputation. In H. M. Wallach, H. Larochelle, A. Beygelzimer, F. d’Alché-Buc, E. A. Fox, and R. Garnett, editors,Advances in Neural Information Processing Systems 32, pages 11236–...
2019
-
[34]
S. M. Luthi. Geological Well Logs. Springer Berlin Heidelberg, 2001. https://doi.org/10.1007/978-3-662-04627- 2
2001 doi
-
[35]
F. J. Massey. The Kolmogorov-Smirnov Test for Goodness of Fit.Journal of the American Statistical Association, 46(253), pages 68–78, 1951. https://doi.org/10.1080/01621459.1951.10500769
1951
-
[36]
McDonald
A. McDonald. Impact of Missing Data on Petrophysical Regression-Based Machine Learning Model Performance. In SPWLA 63rd Annual Logging Symposium, 2022. https://doi.org/10.30632/SPWLA-2022-0125. 24 A PREPRINT - DECEMBER 3, 2024
2022 doi
-
[37]
W. R. Moore, Y . Zee Ma, J. Urdea, and T. Bratton. Uncertainty analysis in well-log and petrophysical interpreta- tions. AAPG Memoir, 96, 2011. https://doi.org/10.1306/13301405M963478
2011 doi
-
[38]
Oluwaseye Joel, W
L. Oluwaseye Joel, W. Doorsamy, and B. Sena Paul. A Review of Missing Data Handling Techniques for Machine Learning. International Journal of Innovative Technology and Interdisciplinary Sciences, 5(3), pages 971–1005, 2022. https://doi.org/10.15157/IJITIS.2022.5.3.971-1005
2022 doi
-
[39]
C. Peng, J. Zhang, and L. Lou. Missing Joint Point Repair of Sign Language Sample Skeleton Based on Conditional Generation Adversarial Networks. Jisuanji Fuzhu Sheji Yu Tuxingxue Xuebao/Journal of Computer- Aided Design and Computer Graphics, 35(3), 2023. https://doi.org/10.37...
2023
-
[40]
F. Qu, H. Liao, J. Liu, T. Wu, F. Shi, and Y . Xu. A novel well log data imputation methods with CGAN and swarm intelligence optimization. Energy, 293, 2024. https://doi.org/10.1016/j.energy.2024.130694
2024
-
[41]
Sharma, M
P. Sharma, M. Kumar, H. K. Sharma, and S. M. Biju. Generative adversarial networks (GANs): Intro- duction, Taxonomy, Variants, Limitations, and Applications. Multimedia Tools and Applications , 2024. https://doi.org/10.1007/s11042-024-18767-y
2024 doi
-
[42]
S. Sun, J. Nie, Z. Qu, Y . Cheng, X. Wang, J. Zhu, and J. Geng. Oil saturation estimation and uncertainty evaluation by modeling-data-driven Gaussian mixture conditional generative adversarial networks. SEG Technical Program Expanded Abstracts, 2021. https://doi.org/10.1190/se...
2021 doi
-
[43]
R. Vera, S. Spang, J.-N. Möller, and M. V oigt-Antons. Protect and Extend - Using GANs for Synthetic Data Generation of Time-Series Medical Records. In QoMEX, pages 171–176, 2023. https://doi.org/10.1109/QoMEX58391.2023.10178496
2023
-
[44]
H. Wang, H. Huang, W. Bi, G. Ji, B. Zhou, and L. Zhuo. Deep and ultra-deep oil and gas well drilling technologies: Progress and prospect. Natural Gas Industry B, 9(2), 2022. https://doi.org/10.1016/j.ngib.2021.08.019
2022 doi
-
[45]
Y . Xu, F. Li, Q. Li, Y . Wang, J. Nie, and L. Yang. Numerical simulation method and structural optimiza- tion for shearing capacity of ram blowout preventers. Geoenergy Science and Engineering , 233, 2024. https://doi.org/10.1016/j.geoen.2023.212559
2024
-
[46]
Z. Yang, Y . Li, and G. Zhou. TS-GAN: Time-series GAN for Sensor-based Health Data Augmentation.ACM Transactions on Computing for Healthcare, 4(2), 2023. https://doi.org/10.1145/3583593
2023 doi
-
[47]
J. Yoon, D. Jarrett, and M. van der Schaar. Time-series generative adversarial networks. In Neural Information Processing Systems, 2019. https://api.semanticscholar.org/CorpusID:202774781
2019
-
[48]
L. Yu, W. Zhang, J. Wang, and Y . Yu. SeqGAN: Sequence generative adversarial nets with policy gradient. In 31st AAAI Conference on Artificial Intelligence, AAAI 2017, 2017. https://doi.org/10.1609/aaai.v31i1.10804
2017 doi
-
[49]
Y . Yu, C. Xu, S. Misra, W. Li, M. Ashby, W. Pan, T. Deng, H. Jo, J. E. Santos, L. Fu, C. Wang, A. Kalbekov, V . Suarez, E. P. Kusumah, M. Aviandito, Y . Pamadya, and H. Izadi. Synthetic Sonic Log Generation with Machine Learning: A Contest Table from Five Methods. Petrophysic...
2021 doi
-
[50]
Zhang, Y
D. Zhang, Y . Chen, and J. Meng. Well logging curve generation method based on recurrent neural network. Petroleum Exploration and Development, 45(4), pages 598–607, 2018. https://doi.org/10.11698/PED.2018.04.06. A Outlier detection and data cleaning techniques in well log 25 ...
2018 doi
-
[2005]
https://doi.org/10.1016/B978-075067883-4/50015-2
Reviewed August 12, 2026 · model on record in the stance chip above.
Discussion (0). Continue with ORCID to comment.