REVIEW 4 major objections 4 minor 17 references
Classification Drives Geographic Bias in Street Scene Segmentation
T0 review · 4 major / 4 minor · reviewed 2026-08-11 · deepseek-v4-flash
Pith's one-line read Misclassification, not localization, drives the geographic gap in street-scene models.
desk verdict First geo-bias study on instance segmentation in driving data; useful diagnostic but the headline claims outrun the evidence on metric choices and class-merging. read the letter →
The pith
A machine-rendered reading of the paper's core claim, the machinery that carries it, and where it could break.
The reading
What carries the argument
The load-bearing instrument is the class-merging strategy: during evaluation, ground-truth and predicted labels are collapsed from fine classes into structural super-classes (four-wheelers, two-wheelers, humans), then the IoU earned by the merged class is remapped to the original fine class as a "corrected IoU." Paired with a scale-invariant geo-disparity measure, Disp = sigma/mu over continent IoUs, the before-and-after comparison isolates how much of the geographic performance gap is attributable to misclassification versus localization. The strategy works because the merged groups are precisely the pairs the model confuses, so the corrected IoU rescues instances that were localized correctly but labeled wrongly.
What would settle it
Re-run the class-merging analysis on randomly paired classes that are visually dissimilar and rarely confused (e.g., person-car, bus-bicycle); if geo-disparity falls by as much as with the cited groups, the conclusion that similarity-driven misclassification causes the bias is not supported.
Extended reading notes
Core claim
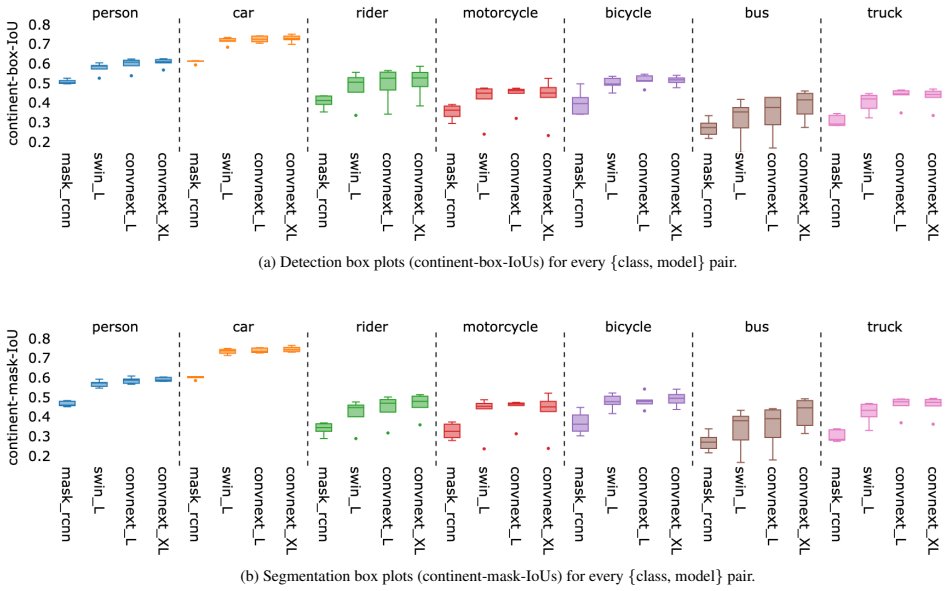
The central claim is that geographic bias in Eurocentric instance-segmentation models is driven by classification errors while localization is geographically robust. On six continents, models pre-trained on Cityscapes performed markedly worse for buses, trucks, motorcycles, bicycles, and riders in Africa and Asia, largely because objects there resemble different European classes—African mini-buses look like cars, Asian motorcycles look like bicycles. When the authors merge confusable classes (car-bus-truck, motorcycle-bicycle, person-rider) at evaluation time, the inter-continental spread of per-class IoU shrinks dramatically, and the reduction in geo-disparity quantifies the classification-error share: 19-88% in detection and 10-90% in segmentation across the geo-biased classes. This is the first demonstration for a localization task that geo-bias resides in the classifier rather than the localizer.
Load-bearing premise
The whole attribution rests on the assumption that merging car-bus-truck, motorcycle-bicycle, and person-rider removes exactly the classification errors that cause geographic disparity; if other confusions or interactions with the metric contribute, the reported 10-90% shares are overstated.
Editorial extensions
If this is right
- If the claim holds, improving classification alone—without touching localization—can close most of the geographic gap for these classes.
- Deploying region-specific models globally with coarse labels (four-wheeler, two-wheeler, human) is a practical mitigation that requires no retraining.
- Fine-grained applications still need region-specific training data or geography-aware classification to recover the lost class distinctions.
- Localization errors, though a smaller share, remain a residual source of geo-bias and are the next target for mitigation.
Reading between the lines
- A diagnostic the authors leave implicit: the same class-merging procedure could serve as a general tool to decompose any domain-shift performance gap into classification versus localization components, not just geographic bias.
- Because the merged classes are also a hierarchy, the results suggest that fine-grained taxonomies themselves encode geographic priors—a model trained only in Europe can localize a vehicle but cannot learn that "bus" in Africa is a smaller van-like object.
- A testable extension would be to apply geography-aware classifiers (which the paper mentions) and check whether geo-disparity after class-merging falls further, which would confirm the residual gap is localization rather than remaining label noise.
Signed reviews
Editorial analysis
A structured set of objections, weighed in public.
Referee Report
Summary. The paper investigates geographic bias in instance segmentation and detection. Four models (Mask-RCNN and OneFormer with Swin-L, ConvNext-L, ConvNext-XL backbones) trained on the Eurocentric Cityscapes dataset are evaluated on Mapillary Vistas images from six continents. The authors define a continent-IoU metric that averages per-instance IoU over ground-truth instances, and a geo-disparity measure Disp = sigma/mu over the six continent means. To isolate the contribution of classification errors, they merge visually similar classes (car-bus-truck, motorcycle-bicycle, person-rider) and compute the percentage reduction in geo-disparity after merging. They find that person and car are geographically robust, while rider, bus, truck, motorcycle, and bicycle are geo-biased, and report that classification errors contribute 19-88% of geo-disparity in detection and 10-90% in segmentation. The paper concludes that geo-bias in these Eurocentric models is driven primarily by classification errors rather than localization errors, and suggests that coarser class labels could mitigate the bias.
Significance. If the quantitative claim were established, this would be a useful and timely result: it is the first study of geo-bias on a task combining classification and localization in driving scenes, and it offers a simple practical mitigation (coarser classes). The analysis is transparent, the release of image-location metadata is a reproducible contribution, and the qualitative finding that specific cross-class confusions (mini-buses versus cars in Africa, motorcycles versus bicycles in Asia) drive much of the disparity in most models is well supported by the examples and by the consistency across several architectures. However, the headline numerical ranges are not yet established because the class-merging groups are chosen post hoc, the continent-IoU metric ignores false positives, and no uncertainty is reported for the six-continent disparity estimates. The qualitative conclusion about the importance of classification errors is likely robust; the specific quantitative attribution is not.
major comments (4)
- [Abstract and Section 4.3, Tables 2, 7, 8] The abstract's ranges '19-88%' and '10-90%' are presented as general findings, but they are the ranges across classes for the Swin-L model only. Table 7 shows, for example, a -7.99% detection reduction for bicycle under ConvNext-L, and Table 8 shows a +32.55% increase for bus under Faster-RCNN. The paper should report the per-model ranges, account for the increase in geo-disparity for Faster-RCNN bus, and qualify the abstract so that it does not overstate the universality of the 10-90% and 19-88% figures.
- [Section 4.3 and Limitations] The class-merging groups (car-bus-truck, motorcycle-bicycle, person-rider) are selected after inspecting the misclassifications in Section 4.2, and the Limitations section acknowledges that the classes were manually identified. Because the merge groups encode exactly the confusions the authors already observed, the percentage reduction in Disp computed in Eqs. (2) and (3) measures the effect of those specific confusions rather than an independent estimate of the total classification-error contribution. The paper's causal phrasing, such as 'classification errors caused geo-bias,' overstates what this post hoc diagnostic can establish; the numbers should be described as an upper-end estimate for the chosen merge groups.
- [Section 3.4, Eq. (1)] The continent-IoU metric averages only over ground-truth instances, ignores duplicate predictions, and never penalizes predictions with no ground-truth overlap. As a result, a model that hallucinates many objects in one continent can still show zero geo-bias, so the conclusion that 'localization (including detection and segmentation) is geographically robust' is conditional on a recall-style metric. The authors should re-analyze with a metric that includes false positives (e.g., standard AP or a precision-aware matching) or explicitly justify why false positives are irrelevant to the geo-bias question.
- [Section 4.3 and Table 5] All geo-disparity values are computed from six continent-level means, and no error bars or confidence intervals are provided. The small instance counts in Table 5, such as 24 bicycle instances in Africa and 37 motorcycle instances in Oceania, mean that the 10-19% reductions reported for bicycle in Table 2 could be within sampling noise. A bootstrap or per-image re-sampling procedure for Disp and for the percentage change would be needed before the headline ranges can be interpreted quantitatively.
minor comments (4)
- [Section B] The supplementary text says that the Table 4 total of 10,547 images is 'lesser' than the 11,300 evaluation images 'because a few images were eliminated in pre-processing.' If images were eliminated, the final count should be smaller than 11,300, not larger; please clarify whether 11,300 is the count before or after pre-processing.
- [Abstract and Supplementary title] There are minor typographical issues: 'as4-wheeler' should be 'as 4-wheeler', and the supplementary section title 'Dataset Comparision' should be 'Dataset Comparison'.
- [Figures 2 and 3] Each box plot is built from only six continent-level data points, making interquartile ranges visually unstable; overlaying the individual continent values as a strip or beeswarm plot would let readers verify the spread directly.
- [Section 4.3, Eq. (2)] The notation 'Dispdet-det-corrected' is confusing because it denotes a percentage change rather than a disparity value; renaming it as something like 'PercentChangeDet' would improve readability.
Circularity Check
The headline 'classification-error contribution' percentages are the class-merging disparity reduction by definition, but qualitative examples and cross-model consistency give the qualitative conclusion independent content.
-
self definitional
[Section 4.3, Eq. (2)-(3); Abstract and Conclusion restate the result]
"To measure the contribution of classification errors in detection, we computed two measures: Disp det, the disparity in detection performance originally (before class-merging), and Disp det-corrected, the disparity in detection performance after class-merging. We computed the percentage change in disparity for detection performance before and after class-merging: Dispdet-det-corrected = Dispdet-corrected − Dispdet / Dispdet × 100 (2)... This shows that classification errors accounted for 19-88% of the geo-biases in detection performance."
The 'contribution of classification errors' is not independently defined or measured; it is stipulated as the relative change in geo-disparity after class-merging. Therefore the reported 19-88% (detection) and 10-90% (segmentation) values are, by construction, the output of Eq. (2)/(3), and the sentence 'classification errors accounted for X%' restates the diagnostic's operation rather than testing it. Additionally, the merge groups (car-bus-truck, motorcycle-bicycle, person-rider) are selected after observing the specific confusions they remove (Section 4.2, Figure 4), so the counterfactual is partly chosen with knowledge of the failures.
full rationale
The evaluation itself is externally grounded: the models are off-the-shelf Eurocentric models evaluated on a fixed, geographically diverse Vistas set, and the continent-IoU and geo-disparity metrics are stated explicitly rather than fitted. There is no load-bearing self-citation: the OneFormer GitHub reference is a model source, not an argument, and the claim that Vistas is the only suitable dataset is supported by a dataset comparison table. The central quantitative attribution, however, is self-definitional in an important sense: 'classification-error contribution' is operationalized as the percentage reduction in geo-disparity after class-merging, so the headline ranges are the formula outputs rather than an independent estimate of a separately defined quantity. The paper partially mitigates this by showing concrete misclassification examples and by reporting the same qualitative pattern across multiple architectures; the supplementary also shows an exception (Faster-RCNN buses), indicating the direction of the effect is not fully forced. Concerns about the recall-only IoU metric ignoring false positives, the post hoc choice of merge groups, and the absence of uncertainty estimates are validity and robustness limitations rather than circularity per se, and they are at least partially acknowledged in the Limitations section. Overall, the qualitative finding that misclassification is geographically correlated has independent support, but the quantified 'contribution of classification errors' is close to a restatement of the paper's own diagnostic, yielding a partial circularity score of 4.
Assumptions & free parameters
free parameters (2)
- point-like object area threshold =
0.01% of image pixels
- class-merging groups
assumptions (3)
- domain assumption Mapillary Vistas is the only publicly available driving dataset with global coverage and instance-level annotations.
- domain assumption Misclassifications within the merged groups are the dominant classification errors contributing to geo-bias.
- domain assumption Best-match IoU per ground truth instance, ignoring false positives, is a valid performance measure for geo-bias.
Cite this review
Pith. "Pith review of Classification Drives Geographic Bias in Street Scene Segmentation." pith.science (2026). https://pith.science/paper/THASJ7E5
@misc{pith2026241211061,
  author       = {Pith},
  title        = {Pith review of: Classification Drives Geographic Bias in Street Scene Segmentation},
  year         = {2026},
  howpublished = {\url{https://pith.science/paper/THASJ7E5}},
  note         = {Machine review of arXiv:2412.11061}
}
read the original abstract
Previous studies showed that image datasets lacking geographic diversity can lead to biased performance in models trained on them. While earlier work studied general-purpose image datasets (e.g., ImageNet) and simple tasks like image recognition, we investigated geo-biases in real-world driving datasets on a more complex task: instance segmentation. We examined if instance segmentation models trained on European driving scenes (Eurocentric models) are geo-biased. Consistent with previous work, we found that Eurocentric models were geo-biased. Interestingly, we found that geo-biases came from classification errors rather than localization errors, with classification errors alone contributing 10-90% of the geo-biases in segmentation and 19-88% of the geo-biases in detection. This showed that while classification is geo-biased, localization (including detection and segmentation) is geographically robust. Our findings show that in region-specific models (e.g., Eurocentric models), geo-biases from classification errors can be significantly mitigated by using coarser classes (e.g., grouping car, bus, and truck as 4-wheeler).
Figures


Figures from the paper (2 more)


Reference graph
Works this paper leans on
- [1]
-
[2]
nuscenes: A multi- modal dataset for autonomous driving
Holger Caesar, Varun Bankiti, Alex H Lang, Sourabh V ora, Venice Erin Liong, Qiang Xu, Anush Krishnan, Yu Pan, Gi- ancarlo Baldan, and Oscar Beijbom. nuscenes: A multi- modal dataset for autonomous driving. In Proceedings of the IEEE/CVF conference on computer vision and pattern recognition, pages 11621–11631, 2020. 1, 2
2020
-
[3]
Mmdetection: Open mmlab detection tool- box and benchmark
Kai Chen, Jiaqi Wang, Jiangmiao Pang, Yuhang Cao, Yu Xiong, Xiaoxiao Li, Shuyang Sun, Wansen Feng, Ziwei Liu, Jiarui Xu, et al. Mmdetection: Open mmlab detection tool- box and benchmark. arXiv preprint arXiv:1906.07155, 2019. 3
arXiv 1906
-
[4]
The cityscapes dataset for semantic urban scene understanding
Marius Cordts, Mohamed Omran, Sebastian Ramos, Timo Rehfeld, Markus Enzweiler, Rodrigo Benenson, Uwe Franke, Stefan Roth, and Bernt Schiele. The cityscapes dataset for semantic urban scene understanding. In Proceed- ings of the IEEE conference on computer vision and pattern recognition, pages 3213–3223, 2016. 1, 3, 2
work page 2016
-
[5]
Terrance De Vries, Ishan Misra, Changhan Wang, and Lau- rens Van der Maaten. Does object recognition work for ev- eryone? In Proceedings of the IEEE/CVF Conference on Computer Vision and Pattern Recognition Workshops, pages 52–59, 2019. 1, 2
work page 2019
-
[6]
Imagenet: A large-scale hierarchical image database
Jia Deng, Wei Dong, Richard Socher, Li-Jia Li, Kai Li, and Li Fei-Fei. Imagenet: A large-scale hierarchical image database. In 2009 IEEE conference on computer vision and pattern recognition, pages 248–255. Ieee, 2009. 1, 2
2009
-
[7]
Laura Gustafson, Megan Richards, Melissa Hall, Caner Hazirbas, Diane Bouchacourt, and Mark Ibrahim. Exploring why object recognition performance degrades across income levels and geographies with factor annotations. Advances in Neural Information Processing Systems, 36, 2024. 2
work page 2024
-
[8]
The apolloscape dataset for autonomous driving
Xinyu Huang, Xinjing Cheng, Qichuan Geng, Binbin Cao, Dingfu Zhou, Peng Wang, Yuanqing Lin, and Ruigang Yang. The apolloscape dataset for autonomous driving. InProceed- ings of the IEEE conference on computer vision and pattern recognition workshops, pages 954–960, 2018. 2
work page 2018
Show all 17 references
-
[9]
Geonet: Benchmarking unsupervised adaptation across ge- ographies
Tarun Kalluri, Wangdong Xu, and Manmohan Chandraker. Geonet: Benchmarking unsupervised adaptation across ge- ographies. In Proceedings of the IEEE/CVF Conference on Computer Vision and Pattern Recognition, pages 15368– 15379, 2023. 2
2023
-
[10]
The open images dataset v4: Unified image classification, object detection, and visual relationship detection at scale
Alina Kuznetsova, Hassan Rom, Neil Alldrin, Jasper Ui- jlings, Ivan Krasin, Jordi Pont-Tuset, Shahab Kamali, Stefan Popov, Matteo Malloci, Alexander Kolesnikov, et al. The open images dataset v4: Unified image classification, object detection, and visual relationship detection...
1956
-
[11]
Presence- only geographical priors for fine-grained image classifica- tion
Oisin Mac Aodha, Elijah Cole, and Pietro Perona. Presence- only geographical priors for fine-grained image classifica- tion. In Proceedings of the IEEE/CVF International Con- ference on Computer Vision, pages 9596–9606, 2019. 7
2019
-
[12]
The mapillary vistas dataset for semantic understanding of street scenes
Gerhard Neuhold, Tobias Ollmann, Samuel Rota Bulo, and Peter Kontschieder. The mapillary vistas dataset for semantic understanding of street scenes. In Proceedings of the IEEE International Conference on Computer Vision, pages 4990– 4999, 2017. 2, 3, 1
2017
-
[13]
Geode: a geograph- ically diverse evaluation dataset for object recognition
Vikram V Ramaswamy, Sing Yu Lin, Dora Zhao, Aaron Bryan Adcock, Laurens van der Maaten, Deepti Ghadiyaram, and Olga Russakovsky. Geode: a geograph- ically diverse evaluation dataset for object recognition. In Thirty-seventh Conference on Neural Information Process- ing Systems...
2023
-
[14]
The dollar street dataset: Images representing the geo- graphic and socioeconomic diversity of the world
William A Gaviria Rojas, Sudnya Diamos, Keertan Ranjan Kini, David Kanter, Vijay Janapa Reddi, and Cody Cole- man. The dollar street dataset: Images representing the geo- graphic and socioeconomic diversity of the world. In Thirty- sixth Conference on Neural Information Proces...
2022
-
[15]
No classification without rep- resentation: Assessing geodiversity issues in open data sets for the developing world
Shreya Shankar, Yoni Halpern, Eric Breck, James Atwood, Jimbo Wilson, and D Sculley. No classification without rep- resentation: Assessing geodiversity issues in open data sets for the developing world. arXiv preprint arXiv:1711.08536,
-
[16]
Idd: A dataset for exploring problems of autonomous navigation in uncon- strained environments
Girish Varma, Anbumani Subramanian, Anoop Namboodiri, Manmohan Chandraker, and CV Jawahar. Idd: A dataset for exploring problems of autonomous navigation in uncon- strained environments. In 2019 IEEE Winter Conference on Applications of Computer Vision (WACV), pages 1743–1751....
2019
-
[17]
Bdd100k: A diverse driving dataset for heterogeneous multitask learning
Fisher Yu, Haofeng Chen, Xin Wang, Wenqi Xian, Yingying Chen, Fangchen Liu, Vashisht Madhavan, and Trevor Dar- rell. Bdd100k: A diverse driving dataset for heterogeneous multitask learning. In Proceedings of the IEEE/CVF con- ference on computer vision and pattern recognition ...
2020
Reviewed August 11, 2026 · model on record in the stance chip above.
Discussion (0). Continue with ORCID to comment.