REVIEW 4 major objections 5 minor 40 references
Distribution Shifts at Scale: Out-of-distribution Detection in Earth Observation
T0 review · 4 major / 5 minor · reviewed 2026-08-11 · deepseek-v4-flash
Pith's one-line read The paper claims that a pre-trained geospatial model can detect distribution shifts without any OOD labels by clustering its own internal activations.
desk verdict A plausible label-free OOD pipeline with a real deployment story, but the benchmark tables don't line up and g* is evaluated against its own surrogate labels. read the letter →
The pith
A machine-rendered reading of the paper's core claim, the machinery that carries it, and where it could break.
The reading
What carries the argument
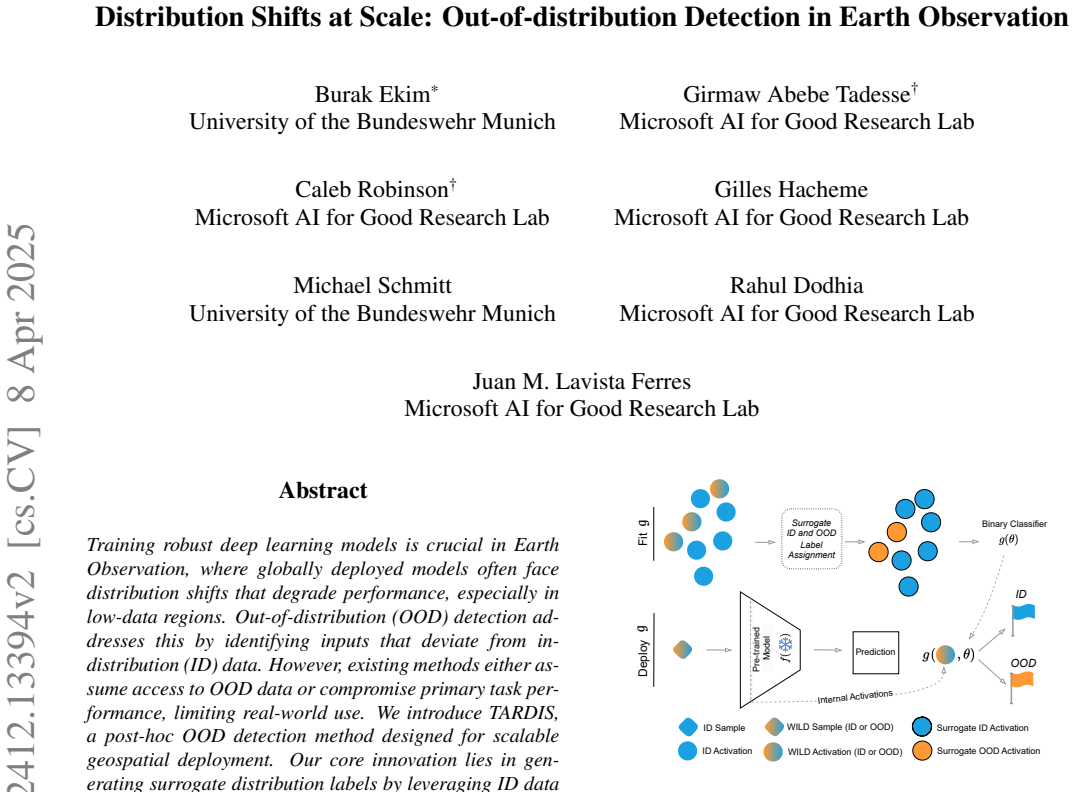
The load-bearing mechanism is surrogate label assignment: max-pooled internal activations from known ID samples and unknown WILD samples are pooled together and clustered with k-means; a cluster is labeled surrogate-ID if the fraction of ID samples in it reaches a threshold T, and surrogate-OOD otherwise. The paper fixes k at 30% of the training sample count and T at 0.1, based on tuning curves on EuroSAT and xBD that show performance approaching the oracle as k grows. A logistic regression classifier is then fit on the surrogate-labeled activations and becomes the detector g; clustering alone is insufficient, since removing the classifier drops ROC AUC for the River experiment from 97% to 79%. The mechanism's work is to convert an unlabeled WILD pool into a labeled training set, so the OOD detector is trainable without true OOD labels.
What would settle it
Take a domain pair where ID and OOD images are known to overlap heavily in the chosen activation layer, apply TARDIS with the fixed hyperparameters k=0.3M and T=0.1, and measure surrogate label accuracy against true labels; if it nears chance, or if on a new deployment dataset with ground-truth OOD labels (e.g., manually labeling a subset of the FTW WILD pool) the AUROC gap between g* and the oracle exceeds about 0.1, the central claim would be refuted.
Extended reading notes
Core claim
The central claim is that surrogate labels produced by k-means clustering of internal activations, with an ID-fraction threshold, are accurate enough that a binary classifier trained on them approaches an oracle classifier that uses ground-truth ID/OOD labels. The paper reports the gap is not statistically significant (p < 0.05) in 13 of 17 setups for AUROC and in all 17 setups for FPR95. This holds across covariate shifts (geographic, temporal, disaster type) and semantic shifts (withheld classes) on two very different tasks, patch classification and semantic segmentation. The method is post-hoc, requires no OOD data, and leaves the base model unchanged, so it is offered as a practical detector for real-world geospatial deployment rather than a maximally accurate one.
Load-bearing premise
The entire method rests on ID and OOD features being separable enough in the chosen activation layer that k-means with an ID-fraction threshold yields mostly correct surrogate labels; if clusters mix ID and OOD heavily, the surrogate-trained classifier cannot approach the oracle.
Editorial extensions
If this is right
- Geospatial models can be screened for distribution shifts at inference time without any OOD labels, making monitoring feasible in low-data regions.
- Because the base model is never modified, ID task performance is preserved, avoiding the trade-off that limits activation-manipulation methods.
- The fixed hyperparameters (k=0.3M, T=0.1) appear to transfer across datasets and tasks, so per-deployment tuning is unnecessary.
- The detector is fast enough (0.003 s per 256×256 patch) to screen continental-scale areas on a single GPU, enabling spatial diagnostics of model reliability.
- Skewness of the detector's scores correlates with the base model's test performance, so the method can flag questionable test splits as well as deployment shifts.
Reading between the lines
- If the surrogate-labeling logic generalizes, the same recipe (cluster activations, threshold by ID fraction, fit a linear classifier) could serve as a label-free shift monitor for any pre-trained vision model, not only Earth observation.
- The fixed k=0.3M suggests the method may be sensitive to the ID/OOD ratio within the WILD pool; a direct test would vary this ratio and measure the gap to the oracle.
- Max pooling outperforming mean pooling implies the most salient activation per channel carries the shift signal, which could be probed with attention-based pooling to see if the oracle gap closes further.
- The paper's assumption that activation clusters correspond to distribution distance could be cross-checked against calibrated uncertainty scores from the base model; where the two disagree, one of them is mislabeling.
Editorial analysis
A structured set of objections, weighed in public.
Referee Report
Summary. TARDIS is a post-hoc OOD detection method for Earth Observation. Given a pre-trained model f, an ID set, and unlabeled WILD data, it extracts activations from a chosen layer, clusters the combined ID+WILD feature space with k-means, assigns surrogate ID/OOD labels based on the ID fraction per cluster (threshold T), trains a logistic regression classifier g on these labels, and uses g at inference. The paper evaluates on EuroSAT and xBD across 17 covariate/semantic shift setups, comparing g* (surrogate labels) with an oracle classifier goracle (true labels), and compares TARDIS with MSP, Energy, Mahalanobis, ReAct, and NAP. It also reports a real-world deployment on the Fields of the World dataset. The central claims are that g* approaches the oracle in 13/17 AUROC and 17/17 FPR95 comparisons, that TARDIS matches or beats state-of-the-art post-hoc detectors, and that the method scales to large geographic regions.
Significance. The proposed idea is attractive: it avoids OOD labels, preserves ID task performance, and the deployment study is a genuine attempt to show scalability. The code release and use of public datasets are strengths. If the results are correct, TARDIS would be a useful tool for monitoring geospatial models. However, the current evidence is not yet convincing. The numerical inconsistency between Tables 2 and 3, the ambiguity about which labels are used for evaluation, and the selection of hyperparameters and layers on the evaluation setups all affect the central empirical claims. The significance is therefore conditional on resolving these issues.
major comments (4)
- [Tables 2 and 3] Table 3 cannot be reconciled with Table 2. For the ten semantic-shift setups, the g* AUROC values in Table 2 average 0.875 and the FPR95 values average 0.34, while Table 3 reports TARDIS semantic AUROC 0.95 ± 0.02 and FPR95 0.16 ± 0.03; the covariate averages from Table 2 are 0.946 and 0.20 versus 0.98 ± 0.01 and 0.11 ± 0.04 in Table 3. These discrepancies are far outside the reported standard deviations. The paper must specify the exact protocol for Table 3 (which labels are used, whether test sets are pooled, and which classifier is evaluated) and provide code that reproduces both tables from the same per-setup evaluations.
- [Section 5, Table 2] Section 5 says g* is 'trained and evaluated using surrogate labels' while goracle is trained and evaluated with true labels. If Table 2 reports AUROC/FPR95 against surrogate labels, then the near-oracle comparison measures how well the classifier reproduces the clustering assignment, not how well TARDIS detects true OOD samples. The evaluation labels must be identical for a valid comparison. Please report g* metrics against ground-truth labels as well, and state explicitly whether Table 3 uses ground-truth labels.
- [Sections 6, 10.1, and 10.4] The hyperparameters k and T are selected on the same 17 setups whose results are then reported: Section 10.4 says 'we run 20 independent experiments and select the best-performing (k, T) pair,' and Section 10.1 says 'we select the best-performing layer for each experiment.' The caption of Table 3 claims TARDIS requires 'no hyperparameter tuning,' but the reported numbers are obtained after tuning on the evaluation sets. This selection bias must be addressed, for example by fixing the layer/k/T protocol a priori or by using a separate held-out validation set, and the claim of no tuning should be revised or removed.
- [Section 7 vs. Supplementary Section 9.3] There is a direct numerical contradiction for the FTW deployment: Section 7 fixes k = 0.3 × 1200 = 360, while Supplementary Section 9.3 states k = 150, 'calculated as 0.3 times the total number of WILD samples' (0.3 × 1200 would be 360). The authors should state the correct value and ensure the released code uses it.
minor comments (5)
- [Figure 4] The reported best-fit line has R² = 0.16, which is a weak correlation; the claim that 'low skewness may signal the presence of OOD samples' should be tempered accordingly.
- [Section 10.4, Eq. (1)] The composite objective H(S) + Pmis-ID − Pcorr-ID mixes an entropy term with proportions that require ground-truth ID/OOD labels to compute; the section should clarify that this objective is only used in the controlled experiments where labels are available, and that deployment uses the fixed values.
- [Sections 4 and 6] The notation for M is inconsistent: Section 4 defines M as the number of ID samples, while Section 6 uses M for the total number of samples when setting k = 0.3 × M. Please define all symbols consistently.
- [Table 7] The table reports 'mean ± SEM' while Section 6 says 'mean and standard deviation'; please specify which one is shown and use consistent terminology.
- [Tables 1 and 2] The note 'All conditions are post-event except where specified' is unclear for the Portugal Wildfire row; please clarify what 'pre' and 'post' refer to in that setup.
Circularity Check
Near-oracle and SOTA claims are partly fitted: per-setup layer selection on test labels plus (k,T) tuning on the same 17 setups precede the benchmark tables.
-
fitted input called prediction
[Supplementary Section 10.1 (Which Layer?), Tables 4/5, and Table 2]
"We benchmark FPR95 scores for OOD detection across the first convolutional layer, eight randomly selected intermediate layers, and the last convolutional layer. As shown in Table 4 for the EuroSAT dataset and Table 5 for the xBD dataset, layer performance varies significantly. While late layers often perform well, early and middle layers frequently give competitive results, depending on the dataset and task. Based on these findings, we select the best-performing layer for each experiment."
The activation layer is chosen separately for each of the 17 setups by ranking FPR95 on that setup's own OOD test split. Table 2 then reports g* and goracle for those exact setups using the selected layer, and Section 6 interprets the small gap as evidence that TARDIS can assign surrogate labels without test-time labels. Because the layer was selected using each setup's OOD labels, each reported AUROC/FPR95 is the best among the tested layers for that setup; the near-oracle comparison is therefore a post-selection maximum, not an independent prediction, and the statistical-significance flag does not account for this selection.
-
fitted input called prediction
[Section 6 (Ablation Studies) / Supplementary Section 10.4 / Table 2]
"To determine k and T, we use a Tree-structured Parzen Estimator for sampling. ... We then run 20 independent experiments and select the best-performing (k, T) pair. Fixing T based on the hyperparameter search results, we observe a recurring pattern that enables us to fix k to 0.3 × M across all setups."
The surrogate-labeling hyperparameters k and T are selected by running 20 trials on EuroSAT and xBD with known OOD labels and choosing the best pair; T is then fixed at 0.1 and k at 0.3M. The same EuroSAT and xBD setups are subsequently reported in Table 2 for g* and in Table 3 for TARDIS. Consequently, the claim that the performance gap is not statistically significant in 13 AUROC and all 17 FPR95 cases is a result of hyperparameters fitted to the evaluation data, not an out-of-sample validation; the FTW deployment then reuses these fitted constants without independent verification.
full rationale
There is no narrow definitional circularity: surrogate ID/OOD labels are produced by k-means clustering of ID plus WILD activations, and the binary classifier g is a separate function trained on those labels; its AUROC/FPR95 are naturally read as evaluated against true OOD labels, so inputs and outputs are not identical. There is also no load-bearing self-citation chain, since the cited activation-pattern works [25,30] are external to the authors. The main circularity is statistical and belongs to the fitted-input-called-prediction pattern. First, the activation layer is selected per experiment using that experiment's test-set FPR95, and Table 2/3 report scores from those selected layers. Second, k and T are tuned on the same EuroSAT and xBD setups with known OOD labels before those setups are used for the headline benchmark tables. The central claims of near-upper-bound surrogate labeling and SOTA-matching performance are therefore partly artifacts of fitting configuration parameters to the evaluation data. Separately, Table 2 and Table 3 are numerically inconsistent (semantic g* AUROC averages about 0.875 from Table 2 versus 0.95 +/- 0.02 in Table 3; FPR95 about 0.34 versus 0.16 +/- 0.03), which is a correctness/reproducibility issue rather than circularity but reinforces that the published benchmark numbers need re-examination. Because the core validation claim is partially fitted rather than an independent prediction, the circularity score is 6.
Assumptions & free parameters
free parameters (4)
- k (number of clusters) =
0.3 x M (M = number of WILD samples)
- T (ID fraction threshold) =
0.1
- Activation layer per experiment =
best-performing layer per experiment (e.g., layer 199/217 for EuroSAT)
- Downsampling method =
max pooling
assumptions (4)
- domain assumption ID and OOD features are separable enough in the chosen activation layer for k-means clustering to be effective.
- domain assumption Euclidean distance in the activation space is a good proxy for distribution similarity.
- domain assumption Internal activations of a pre-trained model carry signal distinguishing ID from OOD inputs.
- ad hoc to paper The fixed hyperparameters (k=0.3M, T=0.1) found on EuroSAT and xBD transfer to new deployment data such as FTW.
Cite this review
Pith. "Pith review of Distribution Shifts at Scale: Out-of-distribution Detection in Earth Observation." pith.science (2026). https://pith.science/paper/62G7WC4B
@misc{pith2026241213394,
  author       = {Pith},
  title        = {Pith review of: Distribution Shifts at Scale: Out-of-distribution Detection in Earth Observation},
  year         = {2026},
  howpublished = {\url{https://pith.science/paper/62G7WC4B}},
  note         = {Machine review of arXiv:2412.13394}
}
read the original abstract
Training robust deep learning models is crucial in Earth Observation, where globally deployed models often face distribution shifts that degrade performance, especially in low-data regions. Out-of-distribution (OOD) detection addresses this by identifying inputs that deviate from in-distribution (ID) data. However, existing methods either assume access to OOD data or compromise primary task performance, limiting real-world use. We introduce TARDIS, a post-hoc OOD detection method designed for scalable geospatial deployment. Our core innovation lies in generating surrogate distribution labels by leveraging ID data within the feature space. TARDIS takes a pre-trained model, ID data, and data from an unknown distribution (WILD), separates WILD into surrogate ID and OOD labels based on internal activations, and trains a binary classifier to detect distribution shifts. We validate on EuroSAT and xBD across 17 setups covering covariate and semantic shifts, showing near-upper-bound surrogate labeling performance in 13 cases and matching the performance of top post-hoc activation- and scoring-based methods. Finally, deploying TARDIS on Fields of the World reveals actionable insights into pre-trained model behavior at scale. The code is available at \href{https://github.com/microsoft/geospatial-ood-detection}{https://github.com/microsoft/geospatial-ood-detection}
Figures


Figures from the paper (9 more)



Reference graph
Works this paper leans on
-
[1]
Emily Aiken, Esther Rolf, and Joshua Blumenstock. Fairness and representation in satellite-based poverty maps: Evidence of urban-rural disparities and their impacts on downstream policy. arXiv preprint arXiv:2305.01783, 2023. 2
work page Pith review arXiv 2023
-
[2]
Detecting out-of- distribution earth observation images with diffusion models,
Georges Le Bellier and Nicolas Audebert. Detecting out-of- distribution earth observation images with diffusion models,
-
[3]
Hybrid dnn-dirichlet anomaly detection and ranking: Case of burned areas discovery
Mihai Coca, Iulia Coca Neagoe, and Mihai Datcu. Hybrid dnn-dirichlet anomaly detection and ranking: Case of burned areas discovery. IEEE Transactions on Geoscience and Re- mote Sensing, 60:1–16, 2022. 2, 3
work page 2022
-
[4]
Extremely simple activation shaping for out- of-distribution detection
Andrija Djurisic, Nebojsa Bozanic, Arjun Ashok, and Rosanne Liu. Extremely simple activation shaping for out- of-distribution detection. In The Eleventh International Con- ference on Learning Representations, 2023. 2
work page 2023
-
[5]
Nng-mix: Improving semi-supervised anomaly detection with pseudo-anomaly generation
Hao Dong, Ga ¨etan Frusque, Yue Zhao, Eleni Chatzi, and Olga Fink. Nng-mix: Improving semi-supervised anomaly detection with pseudo-anomaly generation. IEEE Transac- tions on Neural Networks and Learning Systems, 2024. 3
work page 2024
-
[6]
Out-of-distribution detection in satellite image classification, 2021
Jakob Gawlikowski, Sudipan Saha, Anna Kruspe, and Xiao Xiang Zhu. Out-of-distribution detection in satellite image classification, 2021. 2, 3
work page 2021
-
[7]
Jakob Gawlikowski, Sudipan Saha, Julia Niebling, and Xiao Xiang Zhu. Handling unexpected inputs: incorporating source-wise out-of-distribution detection into SAR-optical data fusion for scene classification. EURASIP J. Adv. Sig- nal Process., 2023(1), 2023. 2
work page 2023
-
[8]
Out-of-Distribution Detection through Soft Clustering with Non-Negative Kernel Regression
Aryan Gulati, Xingjian Dong, Carlos Hurtado, Sarath Shekkizhar, Swabha Swayamdipta, and Antonio Or- tega. Out-of-distribution detection through soft cluster- ing with non-negative kernel regression. arXiv preprint arXiv:2407.13141, 2024. 3
work page Pith review arXiv 2024
Show all 40 references
-
[9]
On calibration of modern neural networks
Chuan Guo, Geoff Pleiss, Yu Sun, and Kilian Q Weinberger. On calibration of modern neural networks. In International conference on machine learning, pages 1321–1330. PMLR,
-
[10]
xbd: A dataset for assessing building dam- age from satellite imagery, 2019
Ritwik Gupta, Richard Hosfelt, Sandra Sajeev, Nirav Patel, Bryce Goodman, Jigar Doshi, Eric Heim, Howie Choset, and Matthew Gaston. xbd: A dataset for assessing building dam- age from satellite imagery, 2019. 5, 1
2019
-
[11]
Delving deep into rectifiers: Surpassing human-level per- formance on imagenet classification
Kaiming He, Xiangyu Zhang, Shaoqing Ren, and Jian Sun. Delving deep into rectifiers: Surpassing human-level per- formance on imagenet classification. In Proceedings of the IEEE International Conference on Computer Vision (ICCV),
-
[12]
Eurosat: A novel dataset and deep learning benchmark for land use and land cover classification, 2019
Patrick Helber, Benjamin Bischke, Andreas Dengel, and Damian Borth. Eurosat: A novel dataset and deep learning benchmark for land use and land cover classification, 2019. 4, 1
2019
-
[13]
A baseline for detect- ing misclassified and out-of-distribution examples in neural networks
Dan Hendrycks and Kevin Gimpel. A baseline for detect- ing misclassified and out-of-distribution examples in neural networks. arXiv preprint arXiv:1610.02136, 2016. 1, 2, 6
2016 arXiv
-
[14]
Lavista Ferres, and Jennifer Marcus
Hannah Kerner, Snehal Chaudhari, Aninda Ghosh, Caleb Robinson, Adeel Ahmad, Eddie Choi, Nathan Jacobs, Chris Holmes, Matthias Mohr, Rahul Dodhia, Juan M. Lavista Ferres, and Jennifer Marcus. Fields of the world: A ma- chine learning benchmark dataset for global agricultural fi...
2024
-
[15]
How accurate are existing land cover maps for agri- culture in sub-saharan africa? Scientific Data, 11(1):486,
Hannah Kerner, Catherine Nakalembe, Adam Yang, Ivan Zvonkov, Ryan McWeeny, Gabriel Tseng, and Inbal Becker- Reshef. How accurate are existing land cover maps for agri- culture in sub-saharan africa? Scientific Data, 11(1):486,
-
[16]
Multi- region transfer learning for segmentation of crop field bound- aries in satellite images with limited labels
Hannah Kerner, Saketh Sundar, and Mathan Satish. Multi- region transfer learning for segmentation of crop field bound- aries in satellite images with limited labels. arXiv preprint arXiv:2404.00179, 2024. 2
2024 arXiv
-
[17]
Wilds: A benchmark of in-the- wild distribution shifts
Pang Wei Koh, Shiori Sagawa, Henrik Marklund, Sang Michael Xie, Marvin Zhang, Akshay Balsubra- mani, Weihua Hu, Michihiro Yasunaga, Richard Lanas Phillips, Irena Gao, et al. Wilds: A benchmark of in-the- wild distribution shifts. In International conference on machine learning...
2021
-
[18]
Imagenet classification with deep convolutional neural net- works
Alex Krizhevsky, Ilya Sutskever, and Geoffrey E Hinton. Imagenet classification with deep convolutional neural net- works. In Advances in Neural Information Processing Sys- tems. Curran Associates, Inc., 2012. 1
2012
-
[19]
A simple unified framework for detecting out-of-distribution samples and adversarial attacks, 2018
Kimin Lee, Kibok Lee, Honglak Lee, and Jinwoo Shin. A simple unified framework for detecting out-of-distribution samples and adversarial attacks, 2018. 2, 6
2018
-
[20]
Shiyu Liang, Yixuan Li, and R. Srikant. Enhancing the re- liability of out-of-distribution image detection in neural net- works, 2020. 2
2020
-
[21]
Owens, and Yixuan Li
Weitang Liu, Xiaoyun Wang, John D. Owens, and Yixuan Li. Energy-based out-of-distribution detection, 2021. 6
2021
-
[22]
Owens, and Yixuan Li
Weitang Liu, Xiaoyun Wang, John D. Owens, and Yixuan Li. Energy-based out-of-distribution detection, 2021. 2
2021
-
[23]
Revisiting the calibration of modern neu- ral networks, 2021
Matthias Minderer, Josip Djolonga, Rob Romijnders, Frances Hubis, Xiaohua Zhai, Neil Houlsby, Dustin Tran, and Mario Lucic. Revisiting the calibration of modern neu- ral networks, 2021. 2
2021
-
[24]
Deep neural networks are easily fooled: High confidence predictions for unrecognizable images
Anh Nguyen, Jason Yosinski, and Jeff Clune. Deep neural networks are easily fooled: High confidence predictions for unrecognizable images. In Proceedings of the IEEE con- ference on computer vision and pattern recognition , pages 427–436, 2015. 1
2015
-
[25]
Detection of out- of-distribution samples using binary neuron activation pat- terns, 2023
Bartlomiej Olber, Krystian Radlak, Adam Popowicz, Michal Szczepankiewicz, and Krystian Chachuła. Detection of out- of-distribution samples using binary neuron activation pat- terns, 2023. 2, 6
2023
-
[26]
Mission critical–satellite data is a dis- tinct modality in machine learning
Esther Rolf, Konstantin Klemmer, Caleb Robinson, and Hannah Kerner. Mission critical–satellite data is a dis- tinct modality in machine learning. arXiv preprint arXiv:2402.01444, 2024. 2
2024 arXiv
-
[27]
Is it all a cluster game?–exploring out- of-distribution detection based on clustering in the embed- ding space
Poulami Sinhamahapatra, Rajat Koner, Karsten Roscher, and Stephan G¨unnemann. Is it all a cluster game?–exploring out- of-distribution detection based on clustering in the embed- ding space. arXiv preprint arXiv:2203.08549, 2022. 3
2022 arXiv
-
[28]
mi- crosoft/planetarycomputer: October 2022, 2022
Microsoft Open Source, Matt McFarland, Rob Emanuele, Dan Morris, and Tom Augspurger. mi- crosoft/planetarycomputer: October 2022, 2022. 7
2022
-
[29]
Dice: Leveraging sparsification for out-of-distribution detection, 2022
Yiyou Sun and Yixuan Li. Dice: Leveraging sparsification for out-of-distribution detection, 2022. 2
2022
-
[30]
React: Out-of- distribution detection with rectified activations, 2021
Yiyou Sun, Chuan Guo, and Yixuan Li. React: Out-of- distribution detection with rectified activations, 2021. 2, 6
2021
-
[31]
Intriguing properties of neural networks
Christian Szegedy, Wojciech Zaremba, Ilya Sutskever, Joan Bruna, Dumitru Erhan, Ian Goodfellow, and Rob Fergus. Intriguing properties of neural networks. arXiv preprint arXiv:1312.6199, 2013. 1
2013 arXiv
-
[32]
In-n-out: Pre-training and self-training using auxiliary information for out-of- distribution robustness
Sang Michael Xie, Ananya Kumar, Robbie Jones, Fereshte Khani, Tengyu Ma, and Percy Liang. In-n-out: Pre-training and self-training using auxiliary information for out-of- distribution robustness. arXiv preprint arXiv:2012.04550 ,
2012 arXiv
-
[34]
EuroSAT EuroSAT [12] is a scene classification dataset derived from Sentinel-2 satellite images, covering various loca- tions across Europe
Datasets and Model Details 9.1. EuroSAT EuroSAT [12] is a scene classification dataset derived from Sentinel-2 satellite images, covering various loca- tions across Europe. It contains 27,000 images labeled into ten land-use and land-cover classes: Annual Crop, Forest, Herbace...
-
[35]
Design Choices To better understand the impact of various design choices on the performance of our OOD detection method, we con- duct a series of ablation studies. Specifically, we explore four key factors: (1) the choice of layer from which to ex- tract feature representation...
-
[36]
Mean and standard deviation ( Mean Std): Computes the mean and standard deviation across the spatial di- mensions (H, W) for each channel, providing two de- scriptive statistics per feature channel
-
[37]
Average pooling ( Avg Pool): Global average pooling was applied, reducing the activation to a single represen- tative value per channel by averaging all spatial values
-
[38]
Max pooling ( Max Pool): Uses global max pooling to retain the maximum value from each spatial dimension, capturing the most prominent feature in each channel
-
[39]
We summarize the OOD detection performance across all experiments on the EuroSAT and xBD datasets un- der different downsampling methods in Table 6, using the FPR95 metric
PCA-based reduction ( PCA): Applies Principal Com- ponent Analysis to reshape the activation map into a vec- tor and projects it into a lower-dimensional space with 10 components. We summarize the OOD detection performance across all experiments on the EuroSAT and xBD datasets...
-
[40]
The model f trains on 9 classes (excludingForest) and tests on Forest
Further Experimental Results In Figure 10, we show the predictions of the DL model f and the OOD classifier g, along with the ground truth class and distribution annotations for the EuroSAT experiment, where Forest serves as the OOD class. The model f trains on 9 classes (excl...
1970
-
[2020]
Next, we evaluate the impact of various design choices, including layer selec- tion, downsampling methods, classifiers, and surrogate la- bel assignment hyperparameters
2 Distribution Shifts at Scale: Out-of-distribution Detection in Earth Observation Supplementary Material In this supplement, we first detail the datasets and mod- els used, followed by a discussion of the introduced distri- bution shifts and their design rationale. Next, we e...
Reviewed August 11, 2026 · model on record in the stance chip above.
Discussion (0). Continue with ORCID to comment.