REVIEW 3 major objections 6 minor 36 references
Label-free SERS Discrimination of Proline from Hydroxylated Proline at Single-molecule Level Assisted by a Deep Learning Model
T0 review · 3 major / 6 minor · reviewed 2026-08-11 · deepseek-v4-flash
Pith's one-line read A plasmonic nanopore and a 1D convolutional network can tell proline from hydroxyproline one molecule at a time, with 96.6% accuracy.
desk verdict A real experimental effort on single-molecule SERS discrimination of proline from hydroxyproline, but the 96.6% accuracy is confounded by device identity and needs a null control before the claim is established. read the letter →
The pith
A machine-rendered reading of the paper's core claim, the machinery that carries it, and where it could break.
The reading
What carries the argument
Particle-in-pore plasmonic nanopore sensor: a gold nanoparticle is trapped next to a nanopore side wall, creating a sub-nanometre SERS hot spot in which only a few angstroms of a molecule are excited at a time. Peak-occurrence-frequency histogram: a count, over all effective spectra, of how often a Raman peak appears at each wavenumber, used to suppress intensity noise and recover stable band positions. One-dimensional convolutional neural network: the classifier that learns to separate the two molecules from the 1463-point spectra and tolerates leftover citrate. One-dimensional gradient-weighted feature visualization: the interpretability step that maps which spectral positions drive the classification and connects them to ring and CH2 vibration modes.
What would settle it
Take the same proline solution and measure it on several different particle-in-pore devices, then train the identical 1D CNN to label which device each spectrum came from. If batch-identity classification approaches the 96.6% accuracy achieved for proline versus hydroxyproline, the reported molecular discrimination is not yet separated from device identity. Conversely, measuring both molecules on the same device in random order and seeing the accuracy hold would confirm the molecular origin of the signal.
Extended reading notes
Core claim
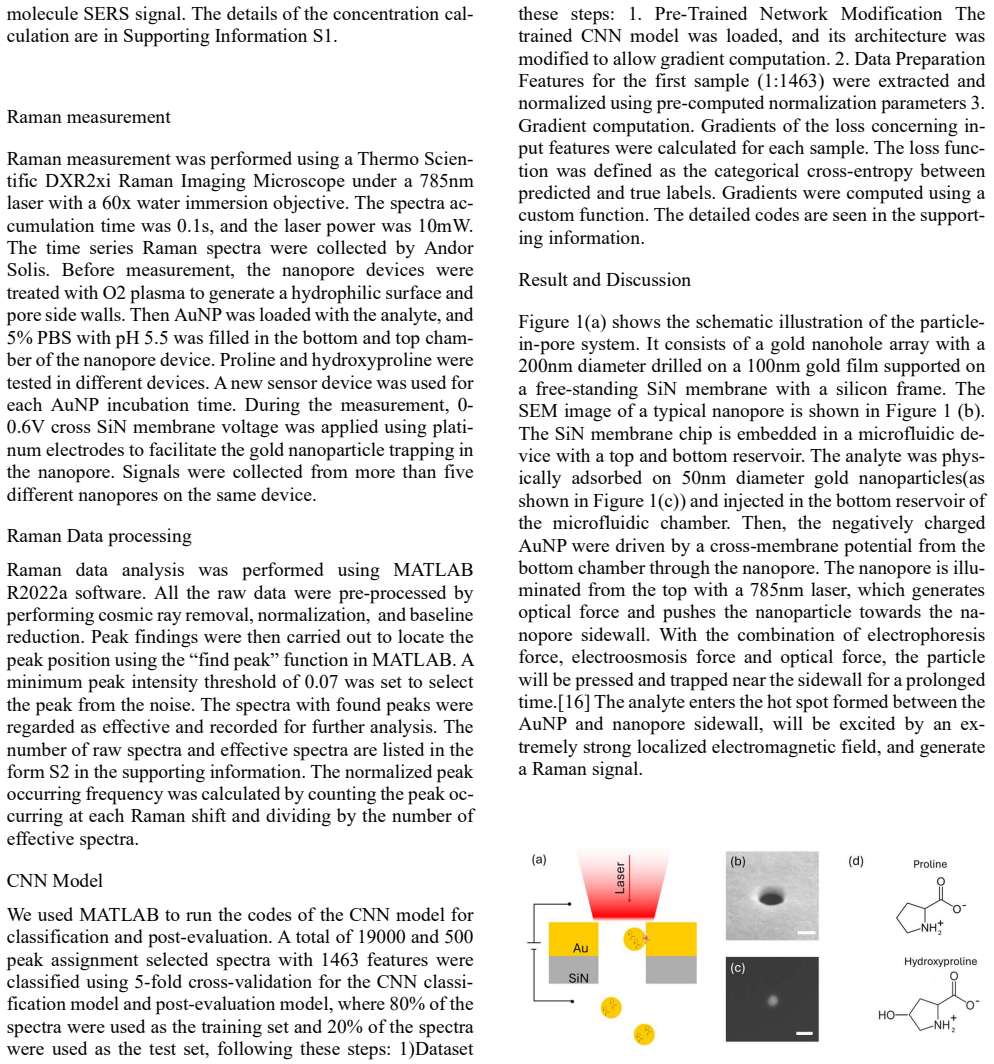
The authors' central claim is that the hydroxyl group on the proline ring produces a learnable, reproducible pattern in otherwise chaotic single-molecule SERS data. In the particle-in-pore sensor, a 50 nm gold nanoparticle trapped beside a 200 nm pore wall creates an electromagnetic hot spot roughly the size of an amino acid, so each recorded spectrum comes from a part of one molecule and changes as the molecule moves. Counting how often each Raman shift appears across tens of thousands of trapping events turns this chaos into stable histograms with sharp bands, such as four resolved CH2 rocking bands around 825-878 cm-1. After 48 hours of incubation with a monolayer of analyte replaces most of the citrate surfactant, the remaining citrate signal becomes a common background and a 1D CNN trained on these spectra classifies proline versus hydroxyproline with 96.6% accuracy. Gradient-weighted feature maps localize the decision to ring-deformation, CH2 twist, and OH-related bands in the 740-1200 cm-1 region, matching the band shifts observed when the OH group is added.
Load-bearing premise
The load-bearing assumption is that the spectral differences the CNN learns come from the hydroxyl group itself and not from stable differences between the separate sensor devices used for the two compounds; the paper does not include a same-molecule, different-device control.
Editorial extensions
If this is right
- A hydroxylation mark, one of the smallest post-translational modifications, becomes detectable without labels or amplification.
- The histogram representation lets a classifier use thousands of noisy single-molecule spectra instead of needing one clean average spectrum.
- Reducing citrate by 48-hour monolayer incubation is enough to keep the classification above 96%, and even incomplete substitution leaves enough molecular information for above-77% accuracy.
- The feature-weight map points to ring and CH2 vibration bands whose shifts report the added OH group, offering a spectral basis for later site-specific PTM analysis.
Reading between the lines
- Not tested here: because the two molecules were measured in different devices, the 96.6% figure should be re-checked with interleaved devices before it is read as a purely molecular metric.
- The histogram-plus-CNN recipe could be pointed at harder siblings, such as 3-hydroxy versus 4-hydroxyproline or proline methylation, to test whether the learned bands are truly specific to the added OH group.
- A practical extension would be counting assigned trapping events to estimate the hydroxylation fraction in a mixed sample, turning a binary classifier into a PTM-ratio assay.
- The single-molecule assumption inherited from earlier particle-in-pore work could be checked directly here by diluting the analyte until spectra disappear and verifying that the remaining spectra still classify correctly.
Signed reviews
Editorial analysis
A structured set of objections, weighed in public.
Referee Report
Summary. The paper reports a label-free surface-enhanced Raman spectroscopy (SERS) method for discriminating proline from hydroxyproline at the single-molecule level using a particle-in-pore plasmonic sensor and a one-dimensional convolutional neural network (1D CNN). The authors use peak-occurrence-frequency histograms to characterize spectral fluctuations and to monitor citrate substitution on gold nanoparticles, and they train a CNN on 19,000 effective spectra (with 500 spectra for post-evaluation) to classify the two amino acids. They report 96.6% held-out accuracy for the 48 h monolayer condition, 77.9% and 85.3% accuracy for a 72 h 1/8-monolayer post-evaluation set, and below 70% accuracy for a 24 h 1/8-monolayer set. They also apply 1D gradient-weighted feature visualization to localize Raman bands attributed to the hydroxyl group. The central claim is that this is the first demonstration of single-molecule discrimination of an amino acid with and without hydroxylation.
Significance. If the claims are correct, the combination of the particle-in-pore SERS platform, peak-occurrence-frequency histograms, and 1D CNN would constitute a notable advance: label-free optical discrimination of a challenging post-translational modification (hydroxylation) at the single-molecule level. The manuscript reports quantitative performance with cross-condition evaluation and openly discusses the limitation posed by residual citrate interference, which is commendable. However, the central claim is currently undermined by a device-identity confound: proline and hydroxyproline were measured on separate devices, so the CNN may be learning device-specific baselines rather than molecular structure. The single-molecule premise is also inherited from prior work rather than demonstrated here. The approach is potentially valuable, but the evidence as presented does not yet establish that the discrimination is due to the hydroxyl group.
major comments (3)
- [Experimental Section, Raman measurement] The statement "Proline and hydroxyproline were tested in different devices. A new sensor device was used for each AuNP incubation time" perfectly confounds analyte identity with device identity. Because each input spectrum carries the full 1463-feature baseline and pore-response information, the CNN could achieve high accuracy by recognizing device-specific baselines, AuNP batch, pore geometry, or laser alignment rather than the molecular difference from the hydroxyl group. The cross-condition post-evaluation (Figure 5(c,d)) does not remove this confound; it only demonstrates that the device-specific signal is consistent across fabrication/incubation batches. The citrate-substitution control (Figure 4) and the gradient feature visualization (Figure 5(e)) are suggestive, but both could also track device/batch variation. A null experiment is required—for example, classifying spectra of the same molecule measured on two different devices, or training on one device and testing on another—before the 96.6% accuracy can be attributed to hydroxylation.
- [Experimental Section, Attachment of amino acid on AuNPs; Raman Data processing] The central claim that the discrimination is at the single-molecule level is not supported by evidence in this manuscript. The text states that the protocol from refs 16 and 17 ensures that "only one molecule occupies the hot spot," but no single-molecule validation (e.g., intensity blinking statistics, concentration-dependent event rate, or comparison with multi-molecule SERS) is provided for proline and hydroxyproline under the exact conditions used here. Additionally, the criteria for selecting "effective spectra" (peak intensity threshold 0.07) and the "peak assignment selected spectra" used for CNN training are not fully defined; if selection depends on the presence of certain peaks, it could bias the data toward particular molecular orientations or events. Please specify the selection criteria and provide evidence that each spectrum corresponds to a single molecule.
- [CNN Model] The description of the CNN training and evaluation is ambiguous: "A total of 19000 and 500 peak assignment selected spectra with 1463 features were classified using 5-fold cross-validation for the CNN classification model and post-evaluation model, where 80% of the spectra were used as the training set and 20% of the spectra were used as the test set." It is unclear how many spectra were used for the main model versus the post-evaluation model, how the 5-fold cross-validation relates to the 80/20 split, what "peak assignment selected spectra" means, and how many spectra per class were in each set. Since the central quantitative claim is the 96.6% accuracy, the exact data partitioning and selection steps must be stated unambiguously for the results to be reproducible.
minor comments (6)
- [Abstract] The abstract contains a typo: "Discriminating the low-abundance hydroxylated proline from hydroxylated proline" should read "from proline."
- [Results and Discussion, Figure 5] The text refers to "Figure 5 (b)" for the feature weight comparison, but the figure caption lists "(e)" for that panel; the panel references should be reconciled.
- [Results and Discussion, deep learning analysis] The phrase "We made the temptation to apply it" should be "We made the attempt to apply it."
- [Conclusions] In the Conclusions, "small Raman cross-session" should be "small Raman cross-section."
- [Results and Discussion, Histogram section] The sentence "The number of spectra events contained in the histograms for proline and hydroxyproline 11002 and 9769 respectively" is missing a verb; it should read "... are 11,002 and 9,769, respectively."
- [Figure 5 caption] The terminology "1-CNN" appears in the Figure 5 caption and should be "1D CNN" for consistency with the rest of the text.
Circularity Check
No significant circularity: the 96.6% accuracy is a held-out empirical measurement with independent post-evaluation, and the self-citations provide independent prior support rather than a derivation collapse.
full rationale
The paper's central quantitative claim is a measured classification accuracy (96.6% on a held-out test split, with 77.9% and 85.3% on post-evaluation data from a different incubation condition), not a derived quantity. The CNN is trained on labelled spectra and evaluated on spectra not used in training; the labels are the molecular identities, and the accuracy is an empirical outcome rather than an identity. No equation in the manuscript defines proline/hydroxyproline discrimination in terms of the CNN output, nor is any fitted parameter renamed as a prediction. The peak-occurrence histograms are descriptive pre-processing, and the gradient-weighted feature weights are post-hoc interpretation; neither enters the accuracy calculation by construction. The main self-citations (refs 16 and 17) establish the single-molecule sensitivity of the particle-in-pore platform and the incubation protocol; they are prior published experiments, independent of the current dataset, and they do not by themselves force the proline/hydroxyproline classification result. The acknowledged limitation that citrate substitution is incomplete is an experimental uncertainty, not a circular step. The device/batch confounding (proline and hydroxyproline measured on different devices) is a real experimental-design risk, but it is not a form of circularity under the definitions used here, because it does not make the prediction equivalent to its input. Verdict: no significant circularity; score 0.
Assumptions & free parameters
free parameters (4)
- Peak detection intensity threshold =
0.07 (normalized intensity)
- Analyte incubation concentration for monolayer coverage =
Not stated numerically; computed from molecular area and AuNP surface area (ref 19)
- 1D CNN architecture and hyperparameters =
Not specified in main text (in Supporting Information)
- Effective-spectrum selection criteria =
Spectra with at least one detected peak above threshold
assumptions (4)
- domain assumption Particle-in-pore platform provides single-molecule SERS sensitivity
- domain assumption Monolayer coverage limits the hotspot to one molecule at a time
- domain assumption Peak positions fluctuate around a stable central value
- domain assumption Residual citrate acts as a common feature the CNN can ignore
Cite this review
Pith. "Pith review of Label-free SERS Discrimination of Proline from Hydroxylated Proline at Single-molecule Level Assisted by a Deep Learning Model." pith.science (2026). https://pith.science/paper/E22EZD6H
@misc{pith2026241218935,
  author       = {Pith},
  title        = {Pith review of: Label-free SERS Discrimination of Proline from Hydroxylated Proline at Single-molecule Level Assisted by a Deep Learning Model},
  year         = {2026},
  howpublished = {\url{https://pith.science/paper/E22EZD6H}},
  note         = {Machine review of arXiv:2412.18935}
}
read the original abstract
Discriminating the low-abundance hydroxylated proline from hydroxylated proline is crucial for monitoring diseases and eval-uating therapeutic outcomes that require single-molecule sensors. While the plasmonic nanopore sensor can detect the hydrox-ylation with single-molecule sensitivity by surface enhanced Raman spectroscopy (SERS), it suffers from intrinsic fluctuations of single-molecule signals as well as strong interference from citrates. Here, we used the occurrence frequency histogram of the single-molecule SERS peaks to extract overall dataset spectral features, overcome the signal fluctuations and investigate the citrate-replaced plasmonic nanopore sensors for clean and distinguishable signals of proline and hydroxylated proline. By ligand exchange of the citrates by analyte molecules, the representative peaks of citrates decreased with incubation time, prov-ing occupation of the plasmonic hot spot by the analytes. As a result, the discrimination of the single-molecule SERS signals of proline and hydroxylated proline was possible with the convolutional neural network model with 96.6% accuracy.
Figures


Figures from the paper (2 more)


Reference graph
Works this paper leans on
-
[1]
Iommarini, L., et al., Non-Canonical Mechanisms Regulat- ing Hypoxia-Inducible Factor 1 Alpha in Cancer. Frontiers in Oncol- ogy, 2017. 7
work page 2017
-
[2]
Ma, H., X.X. Han, and B. Zhao, Enhanced Raman spectro- scopic analysis of protein post-translational modifications. TrAC Trends in Analytical Chemistry, 2020. 131: p. 116019
work page 2020
-
[3]
International Journal of Analytical Chemistry,
Ponomarenko, E., et al., The Size of the Human Proteome: The Width and Depth. International Journal of Analytical Chemistry,
-
[4]
Rosen, C., D. Rodriguez-Larrea, and H. Bayley, Single-mol- ecule site-specific detection of protein phosphorylation with a na- nopore. Nature Biotechnology, 2014. 32(2): p. 179-181
work page 2014
-
[5]
J Am Chem Soc, 2022
Ensslen, T., et al., Resolving Isomeric Posttranslational Modifications Using a Biological Nanopore as a Sensor of Molecular Shape. J Am Chem Soc, 2022. 144(35): p. 16060-16068
2022
-
[6]
Zhang, L., et al., Detection of single peptide with only one amino acid modification via electronic fingerprinting using reengi- neered durable channel of Phi29 DNA packaging motor. Biomaterials,
-
[7]
Fahie, M.A. and M. Chen, Electrostatic Interactions be- tween OmpG Nanopore and Analyte Protein Surface Can Distinguish between Glycosylated Isoforms. J Phys Chem B, 2015. 119(32): p. 10198-206
work page 2015
-
[8]
Chan Cao , et al., Deep learning-assisted single-molecule detection of protein post-translational modifications with a biological nanopore. 2023: bioRxiv. 8
work page 2023
Show all 36 references
-
[9]
Advanced Functional Materials, 2023
Iarossi, M., et al., High-Density Plasmonic Nanopores for DNA Sensing at Ultra-Low Concentrations by Plasmon-Enhanced Ra- man Spectroscopy. Advanced Functional Materials, 2023. 33(41)
2023
-
[10]
Crystengcomm, 2018
Du, J., et al., The role of phosphorylation and dephosphory- lation of shell matrix proteins in shell formation: an in vivo and in vitro study. Crystengcomm, 2018. 20(27): p. 3905-3916
2018
-
[11]
Analytical Chemistry, 2024
Geddis, A., et al., Label-Free SERS Sensors for Real-Time Monitoring of Tyrosine Phosphorylation. Analytical Chemistry, 2024
2024
-
[12]
Bio- sensors & Bioelectronics, 2015
Li, Y., et al., Label-free in-situ monitoring of protein tyro- sine nitration in blood by surface-enhanced Raman spectroscopy. Bio- sensors & Bioelectronics, 2015. 69: p. 1-7
2015
-
[13]
Journal of Photochemistry and Photobiology B-Biology, 2018
Sjöberg, B., et al., Methionine oxidation by hydrogen perox- ide in peptides and proteins: A theoretical and Raman spectroscopy study. Journal of Photochemistry and Photobiology B-Biology, 2018. 188: p. 95-99
2018
-
[14]
Guerrero, A. and R. Aroca, Surface-enhanced Raman scat- tering of hydroxyproline. Journal of Raman Spectroscopy, 2012. 43(4): p. 478-481
2012
-
[15]
A Raman, SERS and theoretical study
Cárcamo, J., et al., Proline and hydroxyproline deposited on silver nanoparticles. A Raman, SERS and theoretical study. Journal of Raman Spectroscopy, 2012. 43(6): p. 750-755
2012
-
[16]
Nature Communications, 2019
Huang, J.-A., et al., SERS discrimination of single DNA ba- ses in single oligonucleotides by electro-plasmonic trapping. Nature Communications, 2019. 10(1): p. 5321
2019
-
[17]
An- gewandte Chemie International Edition, 2020
Huang, J.-A., et al., Multiplexed Discrimination of Single Amino Acid Residues in Polypeptides in a Single SERS Hot Spot. An- gewandte Chemie International Edition, 2020. 59(28): p. 11423-11431
2020
-
[18]
Acs Photonics, 2022
Zhao, Y., et al., Label-Free Optical Analysis of Biomole- cules in Solid-State Nanopores: Toward Single-Molecule Protein Se- quencing. Acs Photonics, 2022. 9(3): p. 730-742
2022
-
[19]
Plos One, 2013
Tien, M., et al., Maximum Allowed Solvent Accessibilites of Residues in Proteins. Plos One, 2013. 8(11)
2013
-
[20]
Nature Com- munications, 2020
Franco-Ulloa, S., et al., Dispersion state phase diagram of citrate-coated metallic nanoparticles in saline solutions. Nature Com- munications, 2020. 11(1)
2020
-
[21]
Buglak, A. and A. Kononov, Comparative study of gold and silver interactions with amino acids and nucleobases. Rsc Advances,
-
[22]
Chemical Reviews, 2017
Zrimsek, A., et al., Single-Molecule Chemistry with Surface- and Tip-Enhanced Raman Spectroscopy. Chemical Reviews, 2017. 117(11): p. 7583-7613
2017
-
[23]
Nano Letters, 2018
Shin, H., et al., Frequency-Domain Proof of the Existence of Atomic-Scale SERS Hot-Spots. Nano Letters, 2018. 18(1): p. 262-271
2018
-
[24]
Acs Nano, 2024
Li, W., et al., High-Throughput Single-Molecule Surface- Enhanced Raman Spectroscopic Profiling of Single-Amino Acid Sub- stitutions in Peptides by a Gold Plasmonic Nanopore. Acs Nano, 2024. 18(29): p. 19200-19207
2024
-
[25]
Herlinger, A.W. and T.V. Long, II, Laser-Raman and infra- red spectra of amino acids and their metal complexes. III. Proline and bisprolinato complexes. Journal of the American Chemical Society,
-
[26]
Langmuir, 1995
MUNRO, C., et al., CHARACTERIZATION OF THE SURFACE OF A CITRATE-REDUCED COLLOID OPTIMIZED FOR USE AS A SUBSTRATE FOR SURFACE-ENHANCED RESONANCE RAMAN-SCATTERING. Langmuir, 1995. 11(10): p. 3712-3720
1995
-
[27]
Journal of Physical Chemistry, 1983
SIIMAN, O., et al., SURFACE-ENHANCED RAMAN- SCATTERING BY CITRATE ON COLLOIDAL SILVER. Journal of Physical Chemistry, 1983. 87(6): p. 1014-1023
1983
-
[28]
Park, J. and J. Shumaker-Parry, Structural Study of Citrate Layers on Gold Nanoparticles: Role of Intermolecular Interactions in Stabilizing Nanoparticles. Journal of the American Chemical Society,
-
[29]
Colloids and Sur- faces B-Biointerfaces, 2010
Majzik, A., et al., Functionalization of gold nanoparticles with amino acid, β-amyloid peptides and fragment. Colloids and Sur- faces B-Biointerfaces, 2010. 81(1): p. 235-241
2010
-
[30]
Jour- nal of Raman Spectroscopy, 2022
Li, J., et al., Machine learning using convolutional neural networks for SERS analysis of biomarkers in medical diagnostics. Jour- nal of Raman Spectroscopy, 2022. 53(12): p. 2044-2057
2022
-
[31]
Analytical Methods, 2023
Lu, P., et al., CNN-assisted SERS enables ultra-sensitive and simultaneous detection of Scr and BUN for rapid kidney function as- sessment. Analytical Methods, 2023. 15(3): p. 322-332
2023
-
[32]
Analytical Chemistry, 2023
Shi, G., et al., 1D Gradient-Weighted Class Activation Map- ping, Visualizing Decision Process of Convolutional Neural Network- Based Models in Spectroscopy Analysis. Analytical Chemistry, 2023. 95(26): p. 9959-9966
2023
-
[33]
Analytical and Bioanalytical Chemistry, 2023
Xiong, C., et al., Rapid and precise detection of cancers via label-free SERS and deep learning. Analytical and Bioanalytical Chemistry, 2023. 415(17): p. 3449-3462
2023
-
[1970]
6481-6486
92(22): p. 6481-6486
-
[2014]
1907-1921
136(5): p. 1907-1921
1907
-
[2020]
34149-34160
10(56): p. 34149-34160
Reviewed August 11, 2026 · model on record in the stance chip above.
Discussion (0). Continue with ORCID to comment.